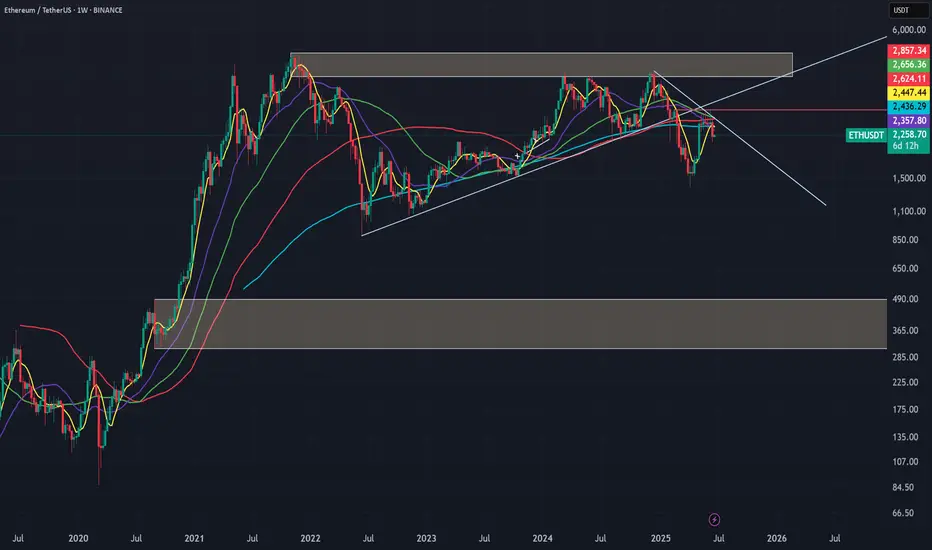
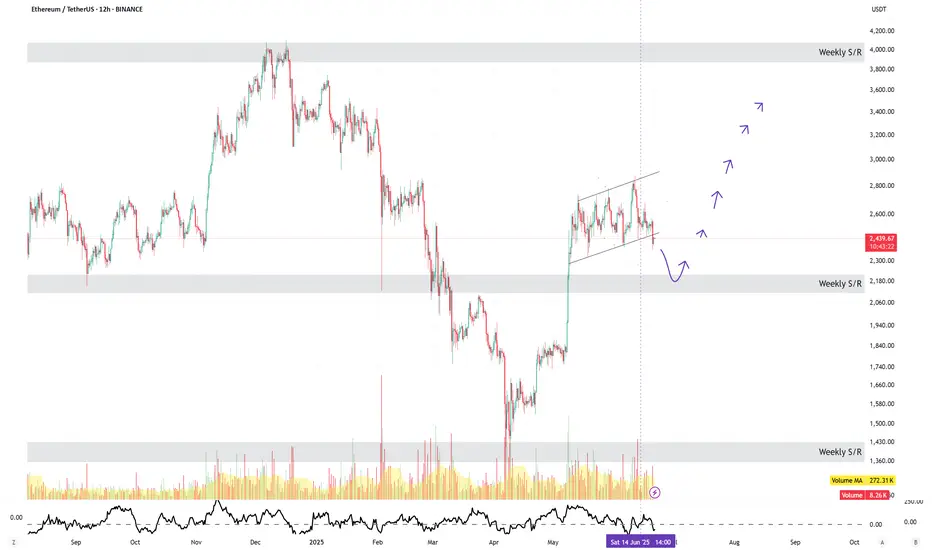
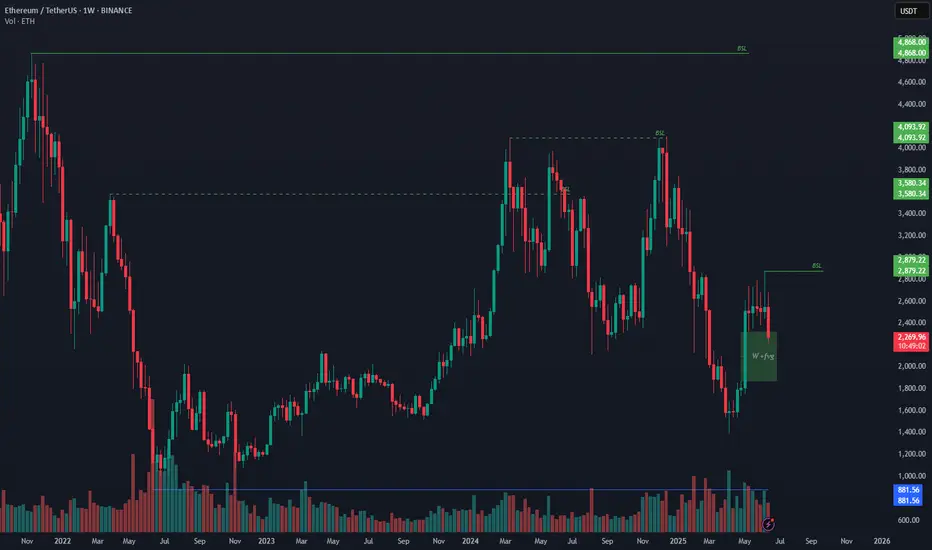
ETHAs seen on the ETH chart, after breaking the upward trend, it performs a retest on the downward trend and creates the second peak of the downtrend by taking liquidity. All the moving averages (7, 25, 50, 100, 200) have converged, reinforcing and supporting the trend.
We have 3 scenarios here:
Wait for a break of the downtrend and enter a trade with a reversal candle.
Wait for the moving averages to act as support.
Wait for support from the block order zone around the 500 level — this is the worst-case scenario.
If the first two scenarios happen together, it could push us significantly higher.
At this point, only short positions are advisable — but they must be adjusted according to risk.
Everything written here is based on the weekly chart. It is possible to trade on lower timeframes, but don’t forget — the overall trend is still down.
ETHUST.P trade ideas
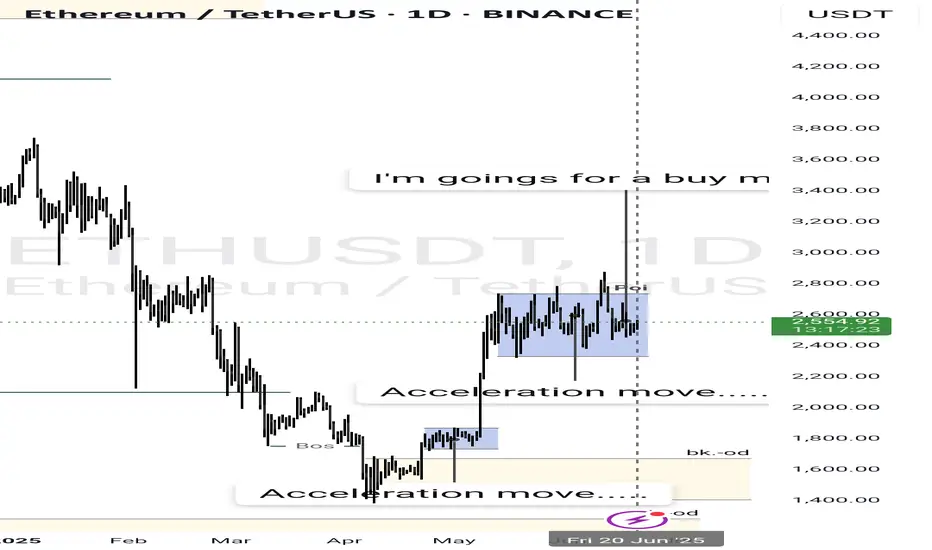
Waiting for a buy move in the btc Seeing all the acceleration move that is happening in the market
I believe is a buy
What do you think is the market movement......
Using PAR indicator to find divergence gaps to find clues of PA Using PAR indicator to find divergence gaps to find clues of PA

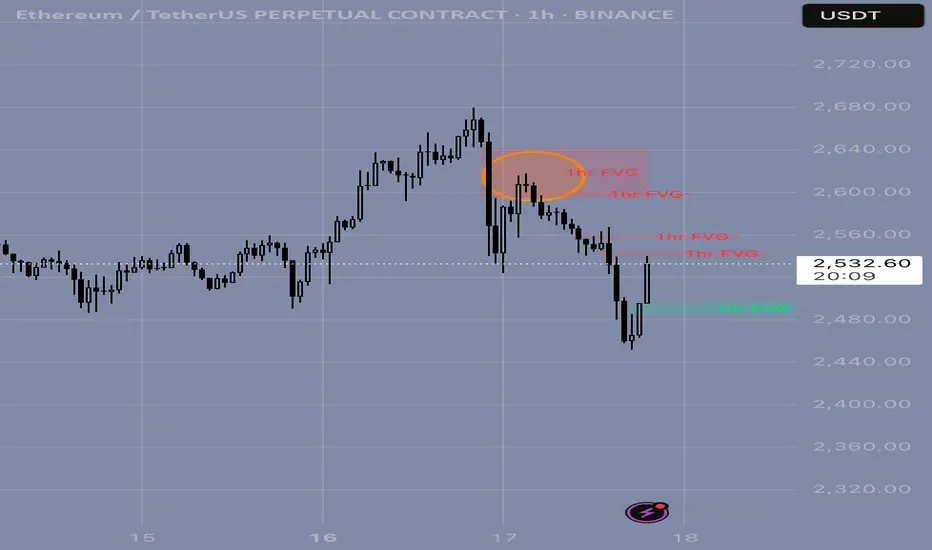
ETH Short – Smart Money Setup | 17.06 🔍 Context:
After a strong dump on ETH, clearly visible on the 1H chart (left side of image), I waited for a retrace into the Fair Value Gap (FVG) zone — typical Smart Money behavior. That’s where I started looking for a short setup.
🎯 Entry Logic:
Now here's the part I’d love to discuss with you.
The classic and maybe "cleanest" approach would be to wait for a market structure break on a lower timeframe and then enter on the continuation, targeting rejection zones visible again on the 1H.
But…
Lately, I’ve been taking entries directly from FVG, even before the break, if another FVG forms on the lower timeframe inside the higher timeframe zone. That’s what happened here — I saw a second FVG form in the key area, and took the short from that.
Sometimes I even treat two FVGs in the same direction (on the same or different timeframes) as a valid entry point on their own.
🤔 Question to the community:
How do you usually approach this?
Do you wait for confirmation/structure break on the lower TF before entering, or do you also go straight from the FVG if the zone is respected well enough?
Would love to hear how others manage similar setups.
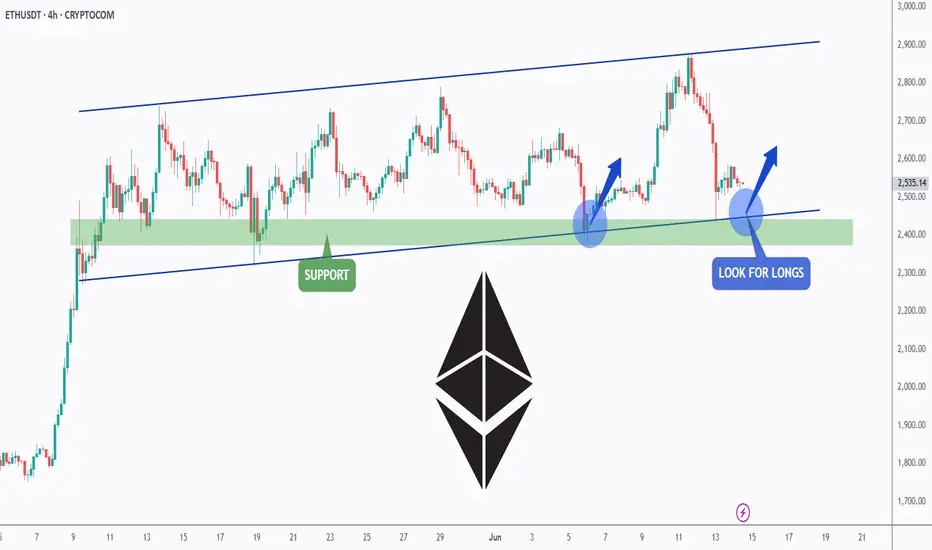
ETH is doing it AGAIN!Hello TradingView Family / Fellow Traders. This is Richard, also known as theSignalyst.
📈ETH has been overall bullish trading within the flat rising channels marked in blue.
Moreover, the green zone is a strong support zone!
🏹 Thus, the highlighted blue circle is a strong area to look for buy setups as it is the intersection of support and lower blue trendlines acting as non-horizontal support.
📚 As per my trading style:
As #ETH approaches the blue circle zone, I will be looking for bullish reversal setups (like a double bottom pattern, trendline break , and so on...)
📚 Always follow your trading plan regarding entry, risk management, and trade management.
Good luck!
All Strategies Are Good; If Managed Properly!
~Rich
Wait for ETHETH faced rejection at the weekly resistance near $2,700.
Price is likely to retest the current weekly support around the $2,100 zone.
Patience is key—wait for ETH to reach this support area before considering entry.
Disclaimer:
This analysis is based on my personnal views and is not a financial advice. Risk is under your control.
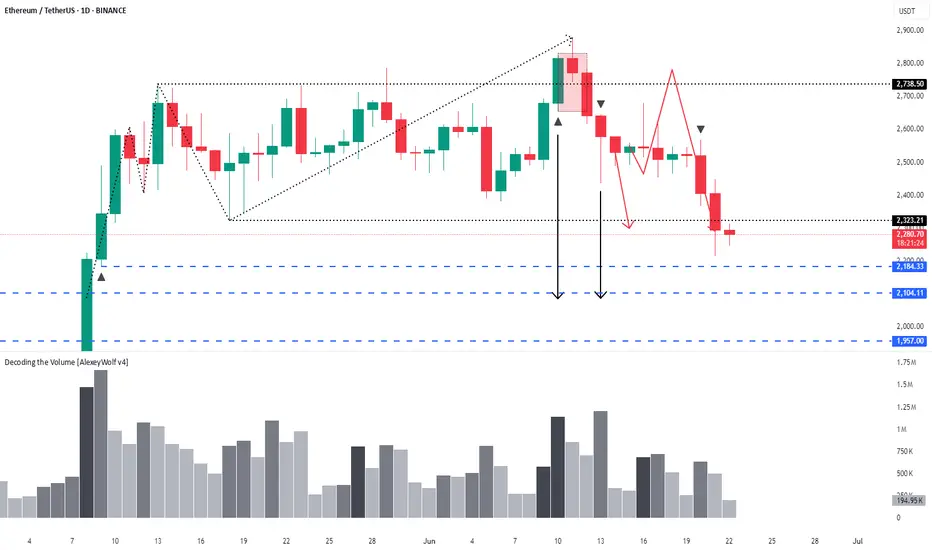
Ethereum – 1D timeframe overview with Initiative AnalysisHey traders and investors!
The price has reached the lower boundary of the range. There is no volume spike.
I expect a further decline toward 2184 and 2100. The 2100 level is a contextual area to look for buying patterns.
As part of a correction, the price could potentially drop to 1800. Monitoring.
This analysis is based on the Initiative Analysis concept (IA).
Wishing you profitable trades!
ETHUSDT – Trade Recap & Daily Bias for June 21Trade Recap (June 20):
I. First thing I did was mark out a DOL on the daily — price was hovering near a swing low, and I started noticing trend-side liquidity building up on the lower timeframes.
So my directional bias for today was short.
II. I marked the daily open.
III. With a short bias in mind, I waited for a Turtle Soup setup right above the daily open.
IV. The equal highs above were clean and obvious — textbook liquidity.
V. Once that liquidity was swept, I dropped to the M15 to watch how price reacted — waited for a clean displacement away from that zone before getting involved.
Daily Bias (June 21):
Still leaning short. We’re pretty close to a weekly FVG, which might act as a magnet.
If price forms liquidity during the day and takes it out in-session, I’ll look to short again.
Bread and Butter & Turtle Soup

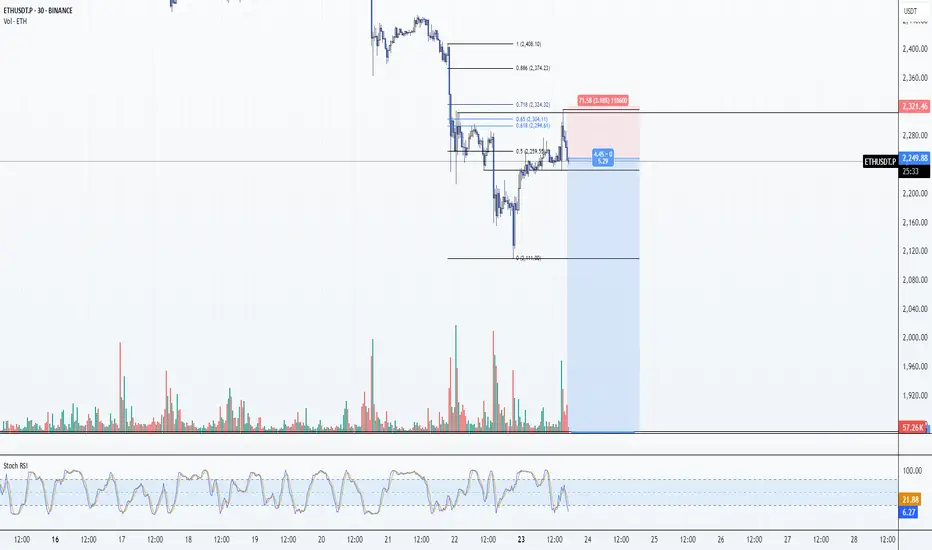
ETH: Short 23/06/25Trade Direction:
ETH Short
Risk Management:
- 0.5% risk allocation
Reason for Entry:
- Tagged and rejected from Daily FVG
- Market sentiment remains bearish across macro and crypto
- News flow is strongly risk-off. Qatar has closed flights, UK and US citizens issued shelter in place warnings aswell
- Heightened geopolitical risk from possible Iranian escalation, with largest US base in the region
- 0.718 rejection
ETH READY TO 3000$ ??? YES eth just about his support level eth can test from here 2450 than possible we can go 3k if iran or isreal war stop and at 18 june also here fomc meating where news about rate cut if not rate cut than possible market dump from here and btc or eth badly if rate cut done than also possible dump to liqudite longer for more deatile check bio
thanks for watching
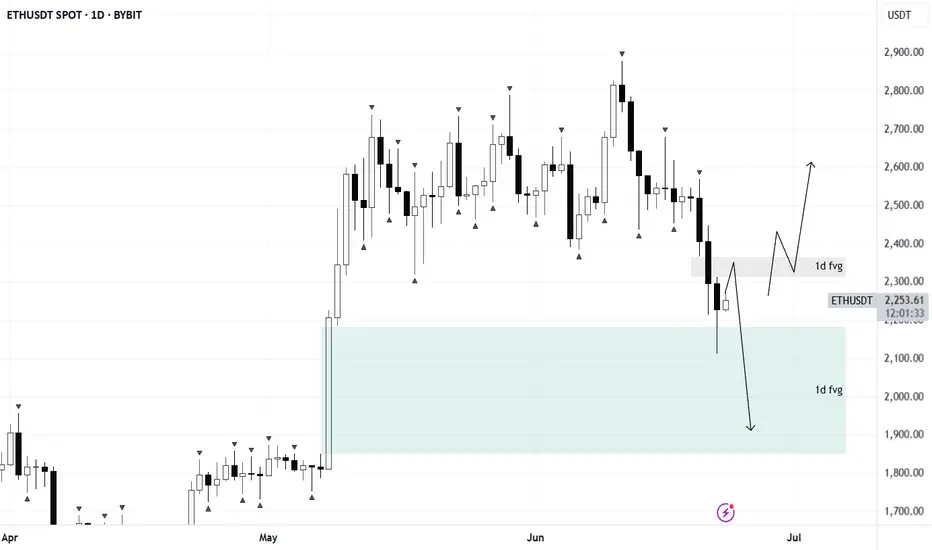
ETH/USDTPrice has entered a daily long FVG zone. For long setups to be valid, we’d like to see a short FVG inversion play out.
If no bullish reaction follows, the bias shifts to shorts — with potential downside targets in the $2000–$1800 range. Wait for confirmation before taking action.
ETH - BOOM or Toink?Okay Mostly boom down, but a toink to get over most peoples liquidity and get sorted up, the probable move is this as per me
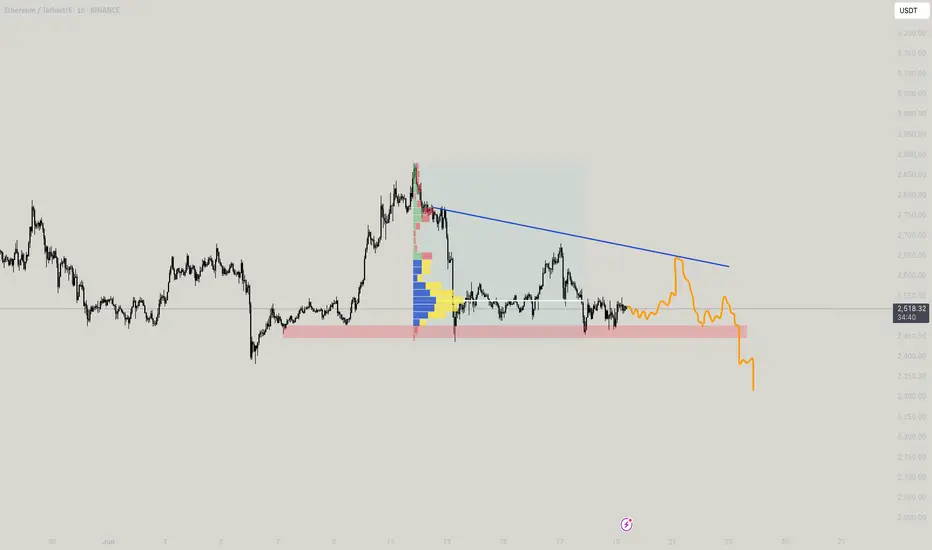
ETH – Rounded Distribution Before the Punch Higher?What we’re seeing here is a potential fakeout setup within a value zone.
Notice the rounded top formation — looks bearish — but price refuses to break the low. This often sets the stage for a sharp reversal.
Structure Breakdown:
Volume profile shows acceptance in current range
Rounded top shape implies weakness — but no breakdown = trap potential
Price holds a higher low inside the range = absorption
Green box marks ideal long entry area — well-defined invalidation below
Bullish case:
We’re watching for that reclaim of the mid-level → quick push into the upper range
Target zone = 2,618 (clean inefficiency fill + local top)
Bearish trap scenario invalidated if price closes below red box (stop hunt level)
Strategy bias:
This is a compression-reversal trap — fake weakness to trap shorts, then launch.
Patience pays here — if it reclaims and consolidates at the mid, it’s time to ride.
📊 More setups like this, early in structure, are shared inside the account description. Tap in for the breakdowns.

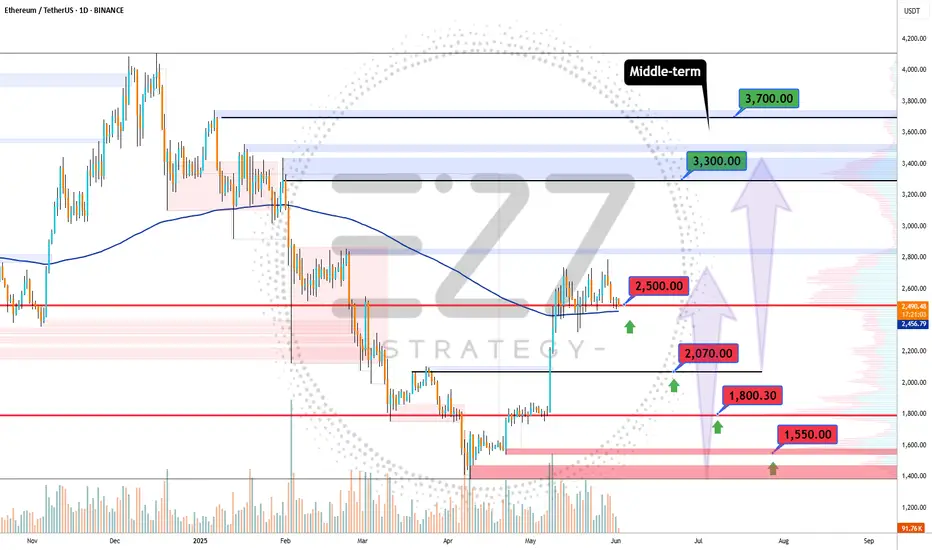
ETHUSDT minor trendsEthereum BINANCE:ETHUSDT is downtrend with lower highs from the bottom is nearly finished 📉 . For a stronger rise, it needs to stabilize above $2500 ⚡. Mid-term targets are $3300 (end of second leg) and $3700 (major resistance) 🎯. Key supports are $2500, $2070, $1800, and $1550, the base where the uptrend began 🛡️.
Supports & Resistances:
Supports: \$2500, \$2070, \$1800, \$1550
Resistances: \$2500 (critical level), \$3300, \$3700
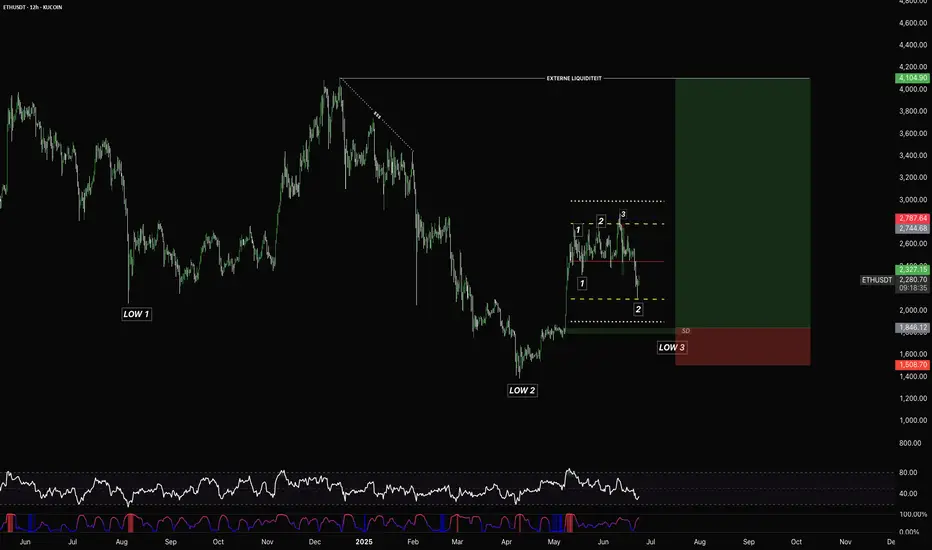
ETHEREUM $1800 IMMINENT – Accumulation nearing completionTraders,
Ethereum is currently forming a textbook example of multi-timeframe accumulation. We’re observing two overlapping accumulation ranges — one on the macro and one on the intraday structure.
In both cases, price has formed two significant lows. A third sweep toward the $1800 zone would complete the pattern and align with the principle of engineered liquidity traps before expansion.
This $1800 level isn't random — it’s where:
- Prior stop runs occurred
- Buyer interest is likely to step in again
- The lower boundary of the range aligns with previous demand
If this level holds, the next logical target sits at $2258, where external liquidity rests above recent highs. The path of least resistance is up once that low is set.
This setup offers high R/R for positional longs, especially if confirmed with absorption or bullish delta response at the $1800 level.
Don’t rush in — but be prepared.
The reaction around $1800 will tell the story.
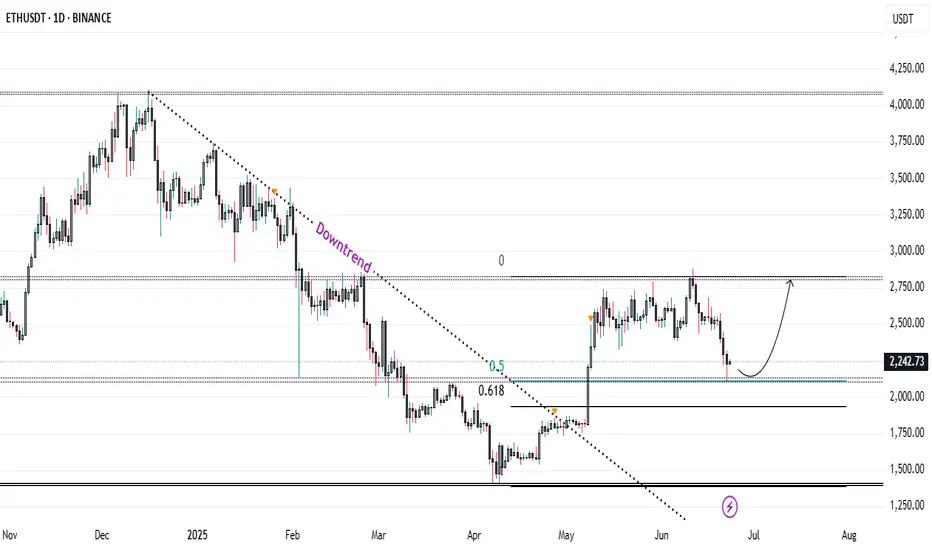
Ethereum Price Reversal ? $2100 Support & Altcoin Season OutlookAfter an extended period of consolidation, Ethereum (ETH) has finally retested the critical support level of $2,100, which aligns closely with the 0.5 Fibonacci retracement level of the bullish trend that began in April. This confluence of technical factors strengthens the validity of this level as a strong demand zone.
The price action suggests that ETH may be gearing up for a bullish reversal, as it respects both horizontal support and key Fibonacci structure. Historically, the 0.5–0.618 retracement zone acts as a high-probability reversal area in trending markets, particularly when accompanied by volume stabilization and long-tailed candles on the daily chart.
Trade Plan: Spot and Futures Positions
Given the current structure, this presents a favorable opportunity to accumulate ETH on spot for the anticipated altcoin season. In addition, leveraged long positions in futures can be considered with clearly defined risk parameters.
Entry Zone: Around \$2,100
Stop Loss: \$2,000 (below key support)
Target Levels:
Primary Target: $2,500 (previous resistance / psychological level)
Secondary Target: $2,600 (major structure high)
The risk-to-reward ratio remains attractive, particularly if the broader crypto market continues its uptrend and Bitcoin maintains stability.
Market Context
Broader macro sentiment and the dominance cycle suggest capital rotation into altcoins could be near. With Ethereum leading major Layer 1s, a recovery from this level could catalyze a wider altcoin rally**, making this an important zone to watch for both intraday traders and swing investors.
⚠️ Note: Due to ongoing geopolitical tensions between Israel, Iran, and the United States, global financial markets—including crypto—may experience heightened volatility. Traders are advised to manage risk carefully and avoid overleveraging during uncertain macro conditions.
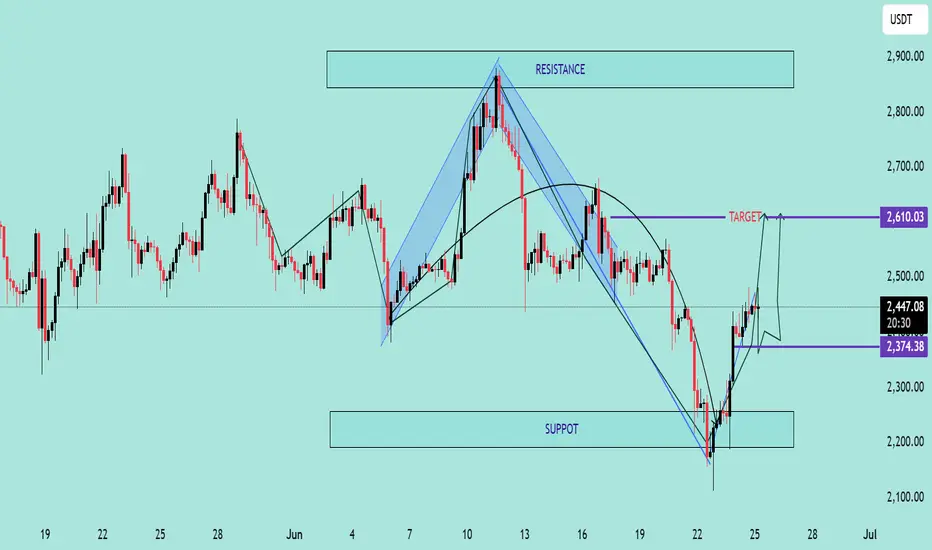
ETH/USDT Bullish Reversal Analysis Chart Overview:
Ethereum (ETH) has shown a strong bullish reversal from the support zone near $2,200, forming a V-shaped recovery pattern. The price is currently trading around $2,450, with upward momentum targeting the next key resistance level.
📌 Key Technical Highlights:
✅ Support Zone:
Clearly respected at $2,200 – $2,300 range
Multiple candle wicks suggest strong buyer interest
✅ Resistance Zone:
Major resistance expected around $2,900
Historical rejection indicates potential selling pressure
✅ Target Level:
Short-term target marked at $2,610 🟣
If momentum sustains, price could push towards this zone before facing resistance
📈 Bullish Momentum:
Strong breakout from downtrend channel
Formation of higher highs and higher lows
Price action respecting upward trend structure
🛠 Pattern Structure:
Reversal pattern after corrective phase
Bullish engulfing candles suggest continuation
📊 Forecast Path:
Two potential scenarios are outlined:
📈 A clean push to the $2,610 target, followed by consolidation
🔄 A short pullback to $2,374 before continuation to the target
⚠️ Conclusion:
ETH/USDT is showing bullish signs with potential to reach $2,610. Watch for consolidation or pullbacks as buying opportunities, but be cautious of heavy resistance above $2,900. Ideal for short- to mid-term bullish setups
ETH-----Buy around 2530, target 2580 areaTechnical analysis of ETH contract on June 19:
Today, the large-cycle daily level closed with a small positive line yesterday, the K-line pattern was a single positive line with continuous negatives, the price was below the moving average, and the attached indicator was dead cross. The big trend of decline is still very obvious, but for now, the continuation and strength are relatively poor, which is also the reason why the price is simple and easy to wash; the short-cycle hourly chart yesterday's European market price fell and did not break down, the US market price supported the rebound, the current K-line pattern is continuous positive, and the attached indicator is golden cross, so there is a high probability that it will rise and break the high during the day.
Today's ETH short-term contract trading strategy:
Buy at the current price of 2530 area, stop loss at 2495 area, and target 2580 area;

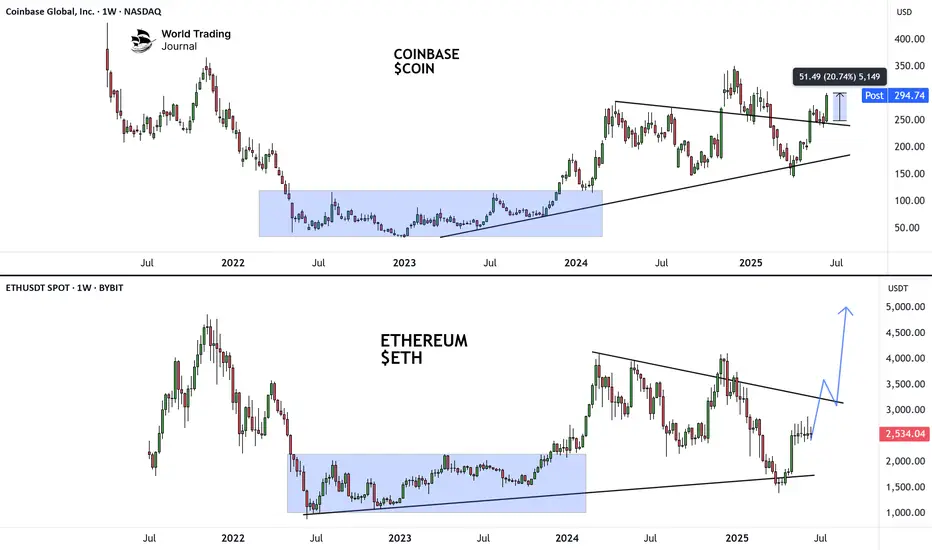
Coinbase #COIN gives a hint for crypto Coinbase #COIN gives a hint of what path awaits #ETH in the coming days
HolderStat┆ETHUSD accumulationBYBIT:ETHUSDT is compressing in an ascending triangle, pivoting around 2 500. A decisive break above 2 520 tees up 2 800–2 900 continuation, while closing back under 2 430 would negate the immediate setup but leave macro structure bullish.
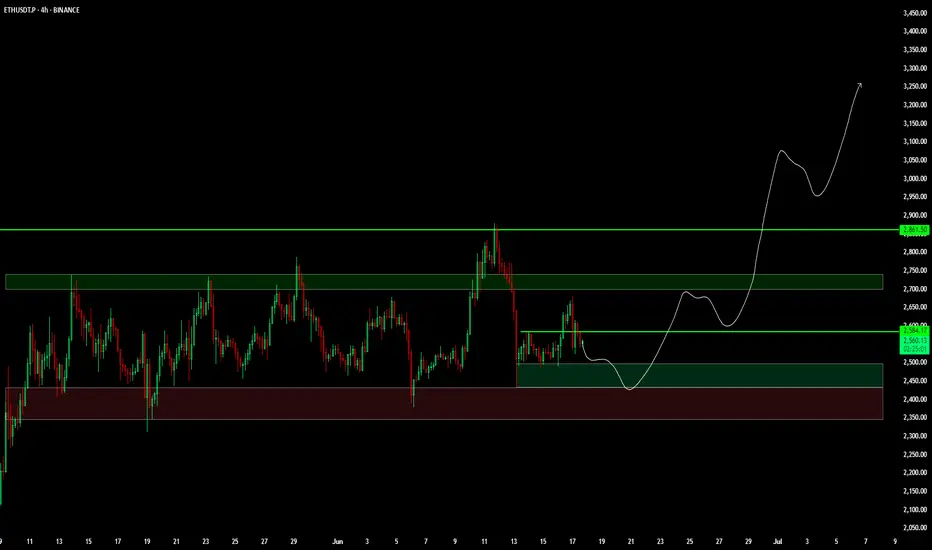
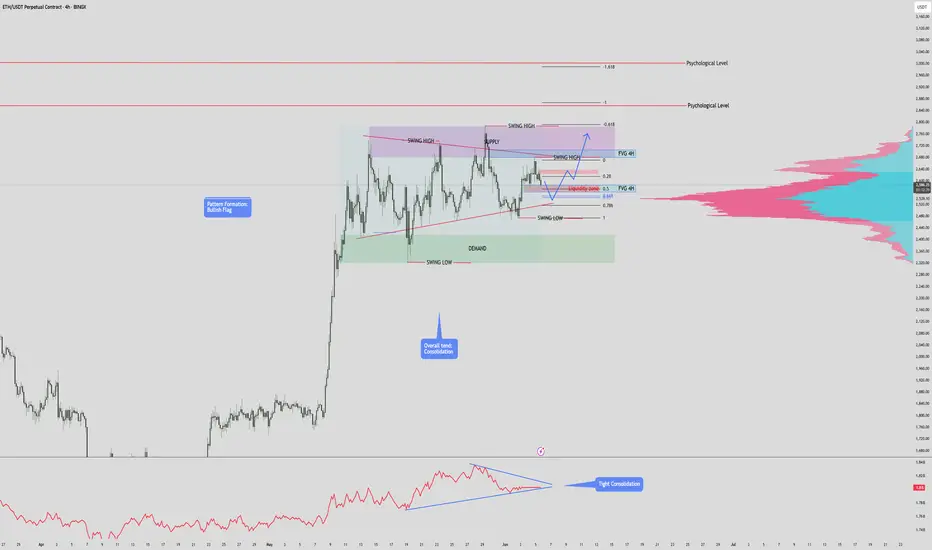
$ETH / USDT – 4H Time Frame Analysis 3,000 INCOMING?? CRYPTOCAP:ETH / USDT – 4H Time Frame Analysis
Structure: Bullish Flag | Outlook: Neutral-Bullish | Target: $3000?
🔹 Chart Overview
-Pattern: Bullish Flag (continuation structure)
Current Range:
- Supply Zone: $2,680.00 – $2,786.21
- Demand Zone: $2,319.79 – $2,417.61
Price Action:
- Tight consolidation between higher lows and lower highs, forming a symmetrical triangle within a flag structure.
Trend:
- Consolidation, but within a macro uptrend (prior strong rally).
Volume Profile:
- Anchored Volume shows high participation around $2,540–$2,600.
OBV:
- Flattening, signaling indecision and potential energy buildup.
Key Psychological Levels:
$2,860: Minor resistance from past S/R flips.
$3,000: Major round-number psychological resistance.
📐 Technical Confluences
Fibonacci Retracement:
- The 0.618 golden pocket aligns with the support trendline, reinforcing this as a critical zone.
Fair Value Gaps (FVG):
- Above Price: Acts as a magnet in bullish continuation.
- Below Price: Risk zone if price drops; aligns with liquidity and trendline support.
- Liquidity Zone: Aligned with 0.5–0.618 retracement; strong reaction expected.
📈 Bullish Scenari o
Breakout of Pennant Resistance:
- A clean break above $2,786 (supply zone & swing high) with volume.
Close above Upper FVG and Liquidity Zone:
- Confirms bullish intent. Targets psychological level at $2,860, then $3,000.
Volume Confirmation:
- OBV uptick and high breakout volume would validate the move.
Bullish Target Zones:
TP1: $2,860 (psych level + previous resistance)
TP2: $3,000 (major psychological level)
TP3: $3,120–$3,180 (1.618 Fib extension)
📉 Bearish Scenario
Rejection from Current Supply or Liquidity Zone:
- Fails to break above supply; rolls over from the upper pennant line.
Break Below Support Trendline:
- Break below golden pocket and $2,417.61 demand zone.
Invalidation of Bullish Flag:
- A breakdown below $2,319.79 (swing low) invalidates the bullish flag and may signal a trend reversal.
Bearish Target Zones:
TP1: $2,200 (local volume gap + structure support)
TP2: $2,060–$2,120 (previous accumulation zone)
TP3: $1,950 (macro support & last strong demand)
✅ Summary
Structure:
- Price is compressing within a bullish continuation pattern, awaiting breakout confirmation.
Bias: Slightly bullish unless the swing low at $2,319 is broken.
Confirmation Needed:
- Break above or below pennant boundaries with volume.
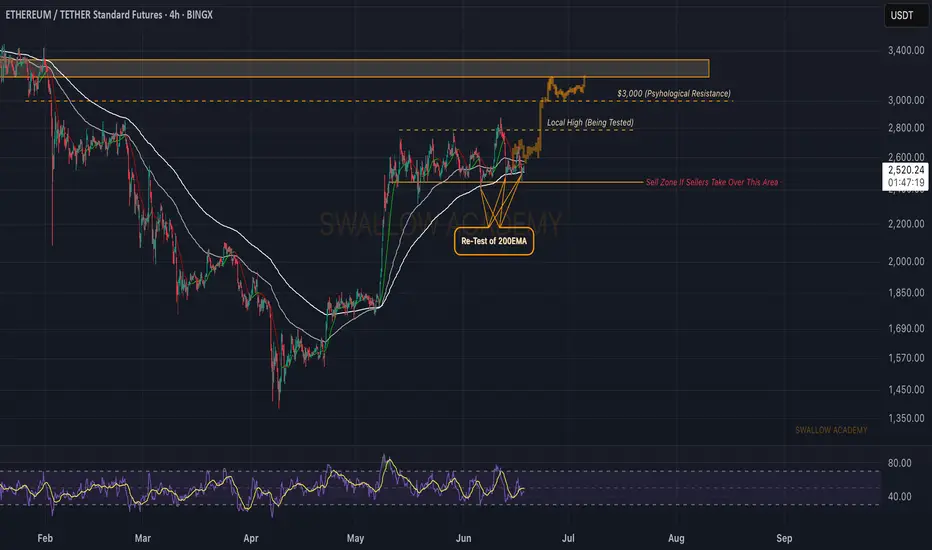
Ethereum (ETH): Are We Doomed or Will We See $3000?Struggle is huge on Ethereum, where we are at a major support area (or let's call it a neckline, as it suits it more here), which is also close to the 200EMA.
So strong a base has formed there that each time we reach that point, we see a strong bounce and dominance from buyers, and yet we always go back to that area.
So, same as Bitcoin, we wait for any more confirmations near the current zone. If we see a breakdown from the neckline area, the drop will be nasty; if we see proper buyside dominance, we will be heading for $3000. So let's wait...
Swallow Academy