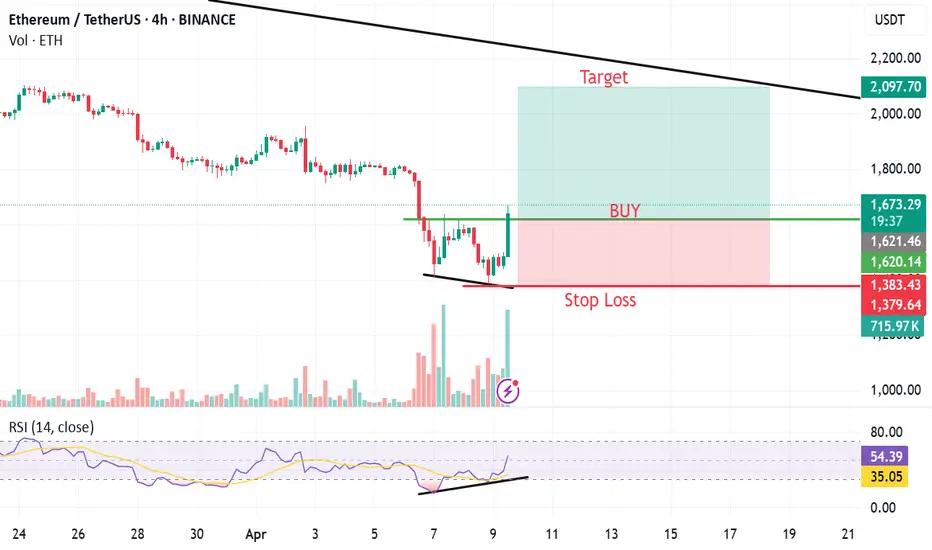
ETHUSDTBullish reversal at 4hr TF. Buy above 1620 with a SL below 1380.
Target should be around 2100.
ETHUST.P trade ideas
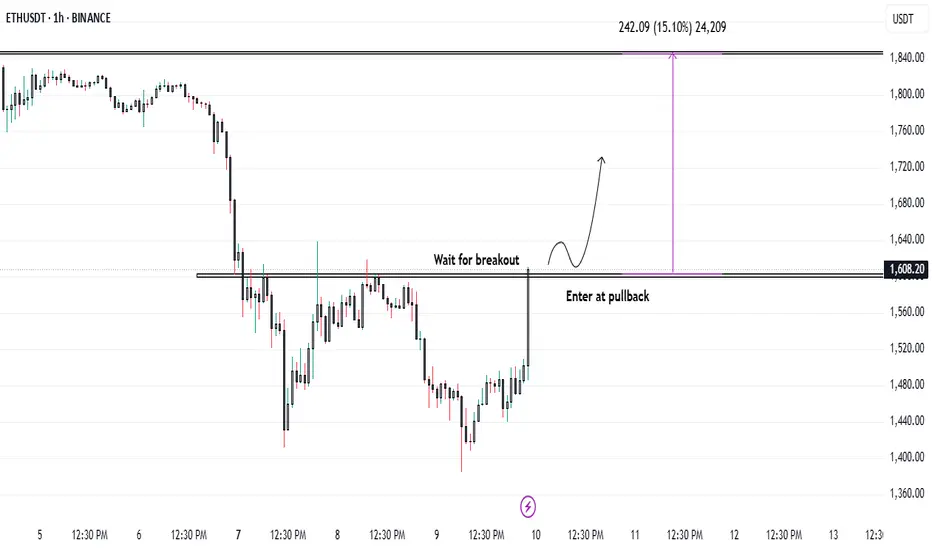
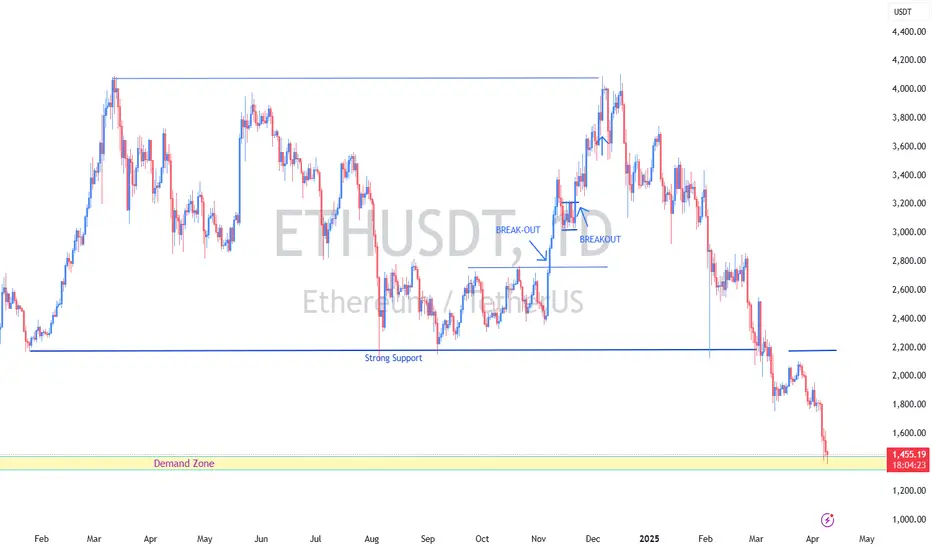
Ethereum Surges Past Resistance as Trump Halts Tariff Plans..!🚨 **Market Update** 🚨
President Donald Trump has announced a 90-day pause on the full effect of new tariffs for certain countries, and the markets are reacting strongly! 📈 Both the stock and crypto markets are surging as a result.
Right now, Ethereum is testing the $1600 resistance level on the 1-hour timeframe. 💥 Our trading strategy is to let it break the resistance and sustain above it, then look for a solid entry on the pullback.
Stay tuned and trade wisely! 🚀💰
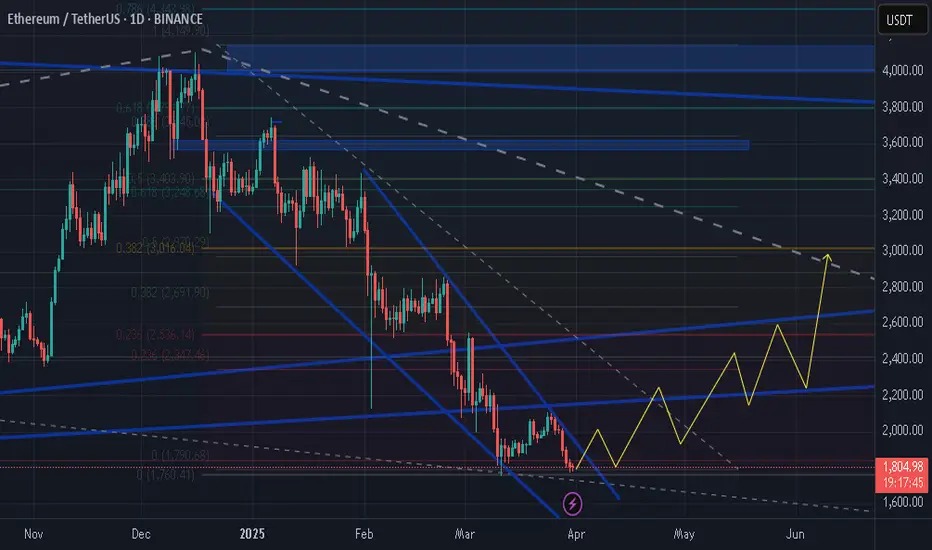
ETHEREUM floating between two powers📊 Ethereum (ETH/USDT) - Daily Outlook 📊
🔹 Current Price: $1,809
🔹 Key Levels:
🟢 Support: $1,762 (Fib 0.65), $1,915 (Fib 0.618)
🔴 Resistance: $2,481 (Fib 0.5), $3,047 (Fib 0.382)
🔮 Possible Scenarios:
📉 Scenario 1: Bounce from Fib 0.65 📈
ETH is testing the key golden pocket zone ($1,762–$1,915).
If buyers step in, we could see a relief rally towards the $2,000-$2,100 zone.
Breaking above $2,100 could trigger a move towards $2,480 (Fib 0.5).
🔹 Odds: 55/45
📈 Scenario 2: Break Below 0.65, Retest Lower Levels 🚨
If ETH loses $1,762, it may drop further towards the $1,600-$1,500 range.
Bearish EMAs (all sloping down) suggest ongoing downside pressure.
RSI is still weak, showing no strong reversal signals yet.
🔹 Odds: 45/55
⚠️ EMA & RSI Considerations
ETH is trading below all key EMAs (50, 100, 200), confirming a bearish structure.
RSI is hovering around 40 but not yet oversold, meaning more downside is possible.
A bullish divergence on RSI would strengthen the bounce scenario.
🎯 Key Watch Points:
1️⃣ Holding above $1,762-$1,915 zone = bullish potential.
2️⃣ Reclaiming 50 EMA ($2,100) = stronger confirmation for upside.
3️⃣ Losing $1,762 = further downside risk.
🚀 Short-term caution, but golden pocket zone (right now) could be a reversal opportunity, especially if you do believe in ETH in a long-term.

ETH ready for Pectra and bull run LONGETH HODLs ready for jump at the end of APRIL for Pectra upgrade.
inte
rest rate of usa
weekly RSI
break
the trend line
im ready for new ATH even for the most important altcoin
Catch ETHAsalamualaikum..
"I have given a buy call on Ethereum based on technical analysisfor SPOT. The setup looks strong, and I’m expecting an upward move in the coming sessions. Please manage your risk accordingly and follow the trade plan.
ETH - 1M - Flat ideaFlat idea on ETH
1M timeframe
This is only an idea assuming we had a 5 waves impulse during last cycle.
COuld be longer to correct
Long term bullish
NFA
ETH AccumulationThis range could turn into an model 1 or 2, but it's to early to tell. I will keep an eye on it.
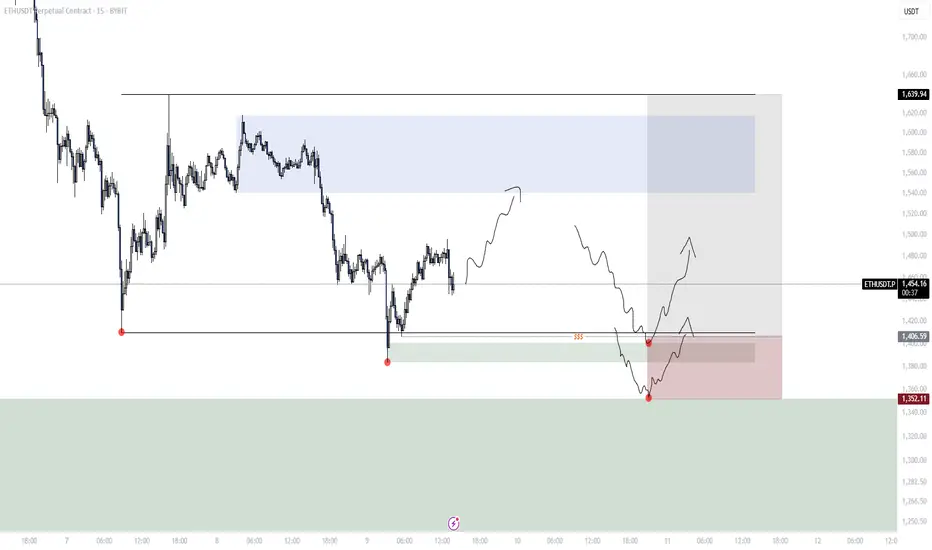
Ethereum (ETH): Buyers Losing Dominance | Liquidity HuntingBuyers are losing dominance on ethereum, where we see how sellers keep on pushing and pushing down, which might result in another wave of selloff.
Despite all signs telling us that we should see a proper upward movement to the resistance zone, currently it does not matter; we are in the liquidity hunting phase with markets right now.
2 zones we keep an eye on; whichever we reach and secure first, there we will head the most likely as well!
Swallow Academy

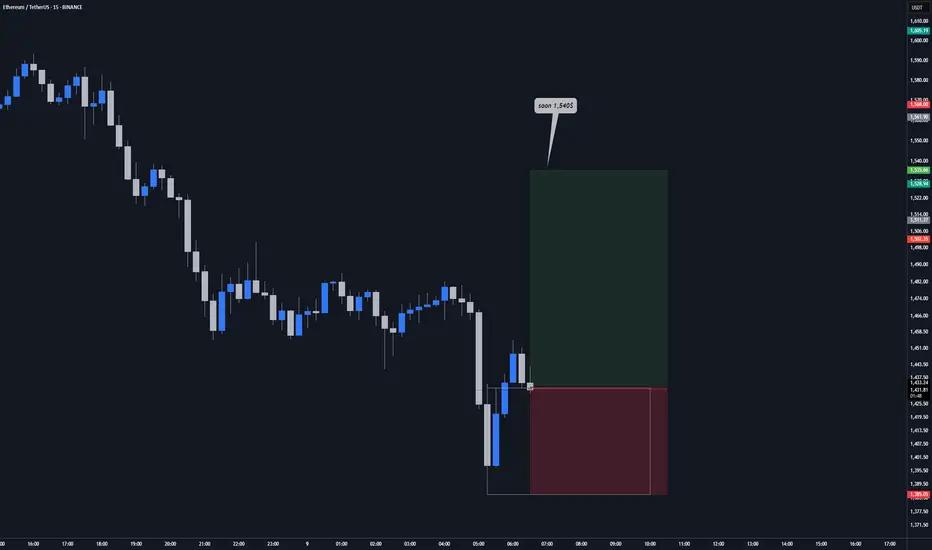
ETHUSDT Long SetupWe’ve been in a clear bearish trend, with multiple (BOS) to the downside. However, a recent liquidity sweep of the previous low, followed by a (CHoCH) to the upside, suggests a potential bullish reversal is in play.
Before the CHoCH occurred, price swept a key liquidity zone below the most recent swing low, inducing sellers and triggering stop-losses.
There are two key supply zones overhead:
$1,425 Recently mitigated during a retracement.
$1,600 Still unmitigated could act as resistance.
TP is above all of them but possible with momentum.

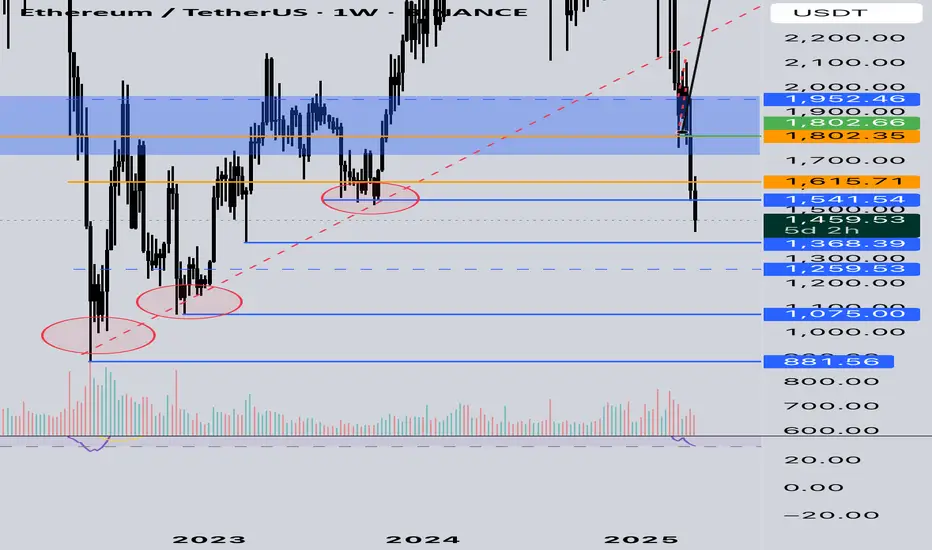
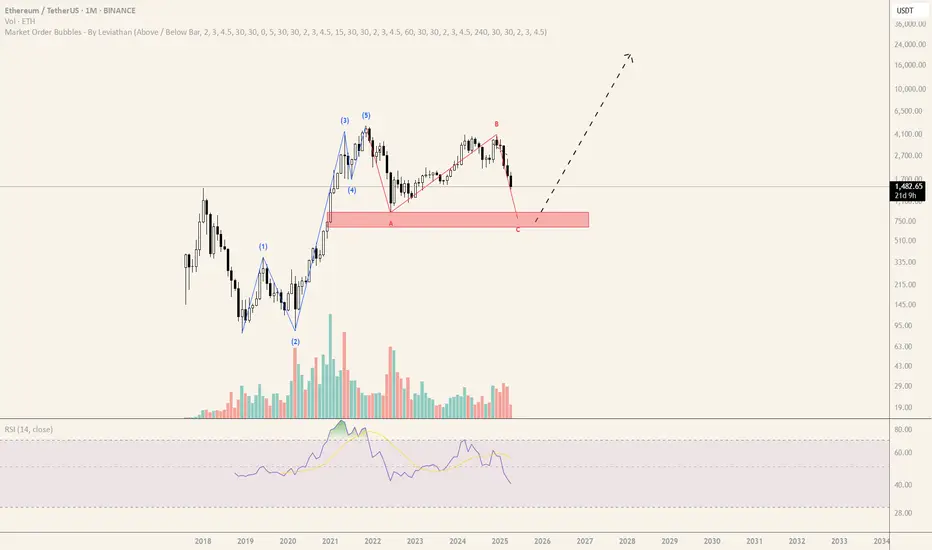
Ethereum (ETH) Forecast with NEoWave1M Cash Data Chart
Based on the price size of wave-B, it appears that a flat pattern with a regular wave-B is forming. In this pattern, wave -C typically retraces the entirety of wave -B, though a flat with a C-failure may occur at times.
Our primary scenario suggests that wave -C could conclude within the 1000–1200 range, indicating a flat with a C -failure. However, if the price breaks strongly through the 1000–1200 range and consolidates below this level, wave-C might extend to the 700–807 range.

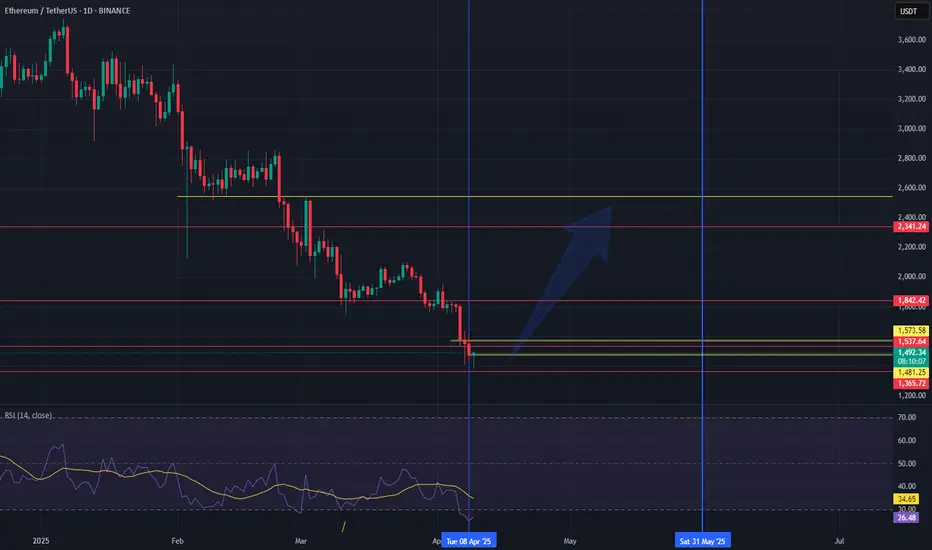
ETH looks intresting in 4HAlthough there are many bad news around tariffs, I think market have already priced it all, so we can have a bounce as a retracement.
As ETH has fallen to 1400 level from 3300 ( more than 58%), it completed 5 wave an bearish impulse( Wave A from ABC retracement), now I believe it can go for a B wave, reaching 2100$ as a solid and fair price for Etherium.
Support: 1090$-1200$-1370$
Resistances: 1760$-1980$-2100$-2620$

Etherum Is landed on the support. I already Posted for bitcoinHello trader's
Here is your some view on etherum after heavy fall that was predicted
by me before it started check my 5 month ago post .
And Now I posted for bitcoin 1month earlier.

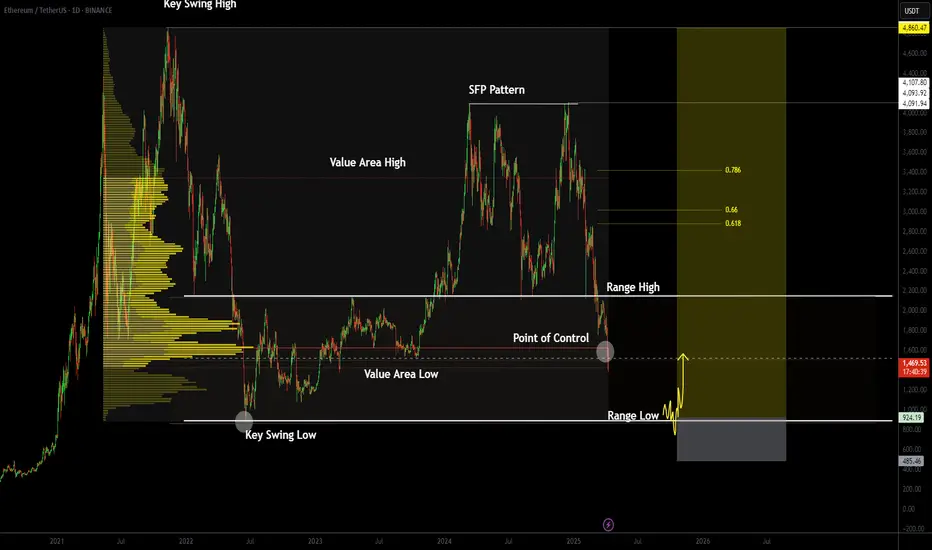
Bearish Trend Continues as Range Rotation DevelopsGood evening traders,
In today’s analysis we’re focusing on Ethereum, which remains firmly in a strong bearish trend with no current signs of reversal. Price has recently broken back into its previous trading range, confirming a bearish retest at the range high before accelerating downward toward the range midpoint.
Ethereum is now showing signs of minor consolidation on lower timeframes near the midpoint, suggesting that the market has accepted price back within the old range. This acceptance increases the probability of a full range rotation toward the channel low, which is situated around the $800 support level.
At that level, if price action confirms support and presents a valid shift in market structure, it could offer a high-probability long setup with defined risk. This would potentially trigger a full range rotation back toward the highs, continuing a larger high-timeframe sideways structure. Until then, risk management remains key, as the current trend still favors the downside.
ETH (D1) : BUY AND HOLD NOWI recommend for long ETH in D1 timeframe
- Reason : Have got a good demand zone
- Entry : 1350-1450
- Target : 1800-2000
Major lesson to be learned After btc broke this major trendline… this was a big big signal for the weakness btc is showing now. I hope we will see some relieve after this huge correction. Then I am out. Let’s settle the market and find our entry’s