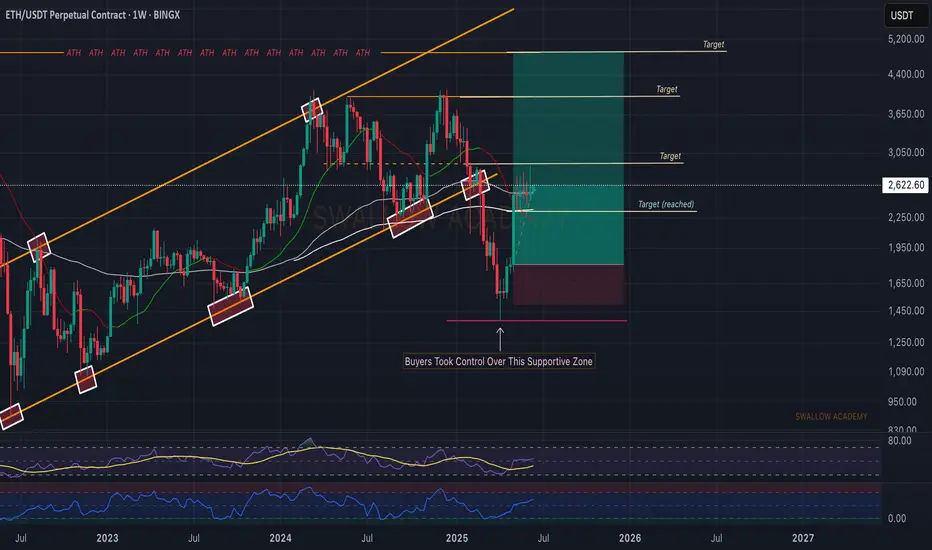
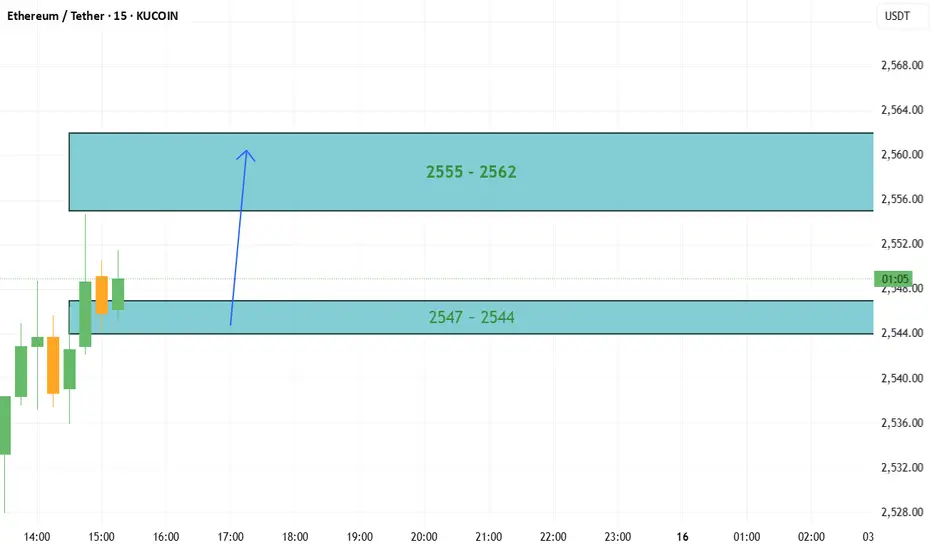
Ethereum (ETH): Buyers Are Back | Waiting For Next Target NowETH is back with strong buyside dominance after the choppy rollercoaster movement. Since our entry we have filled so far our first target area, where we took some profits and moved SL to entry so now we are waiting for the next target to be hit to take more profits and move SL once again closer.
Swallow Academy
ETHUST.P trade ideas
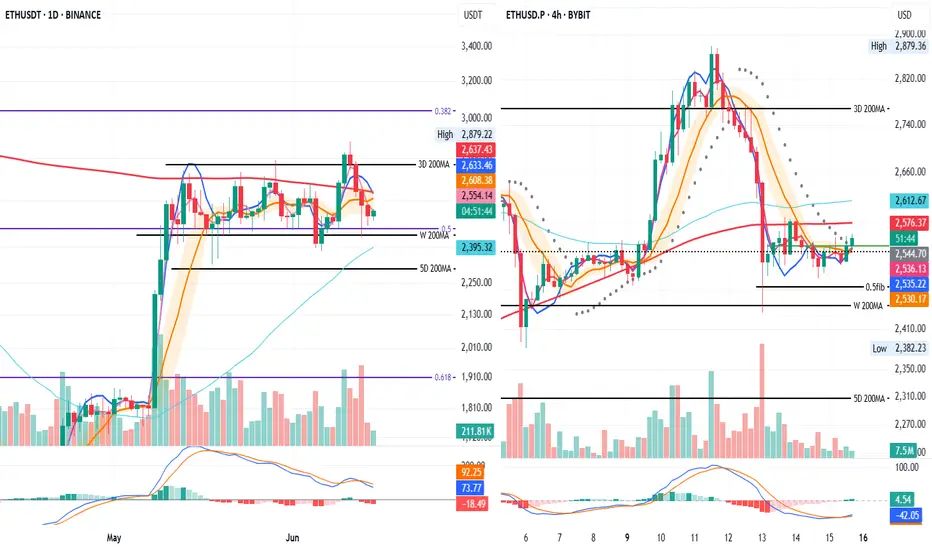
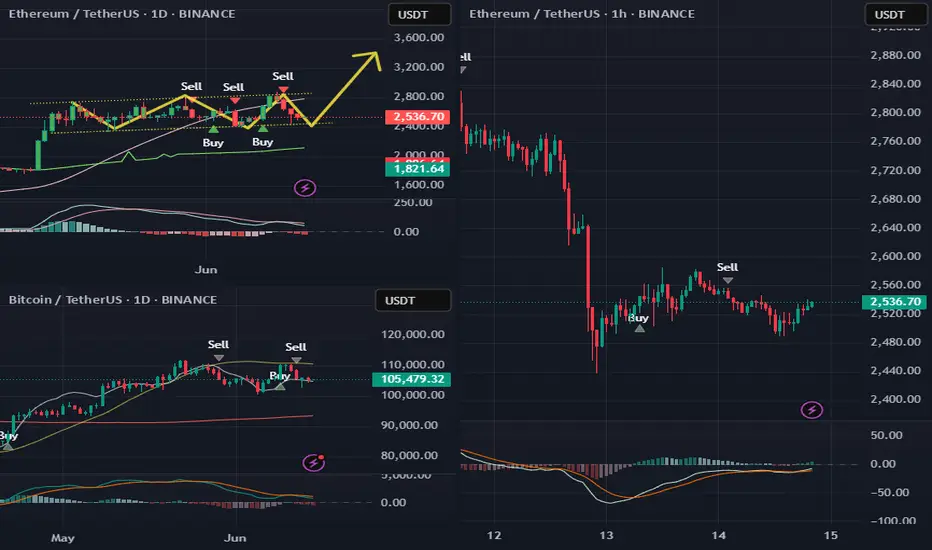
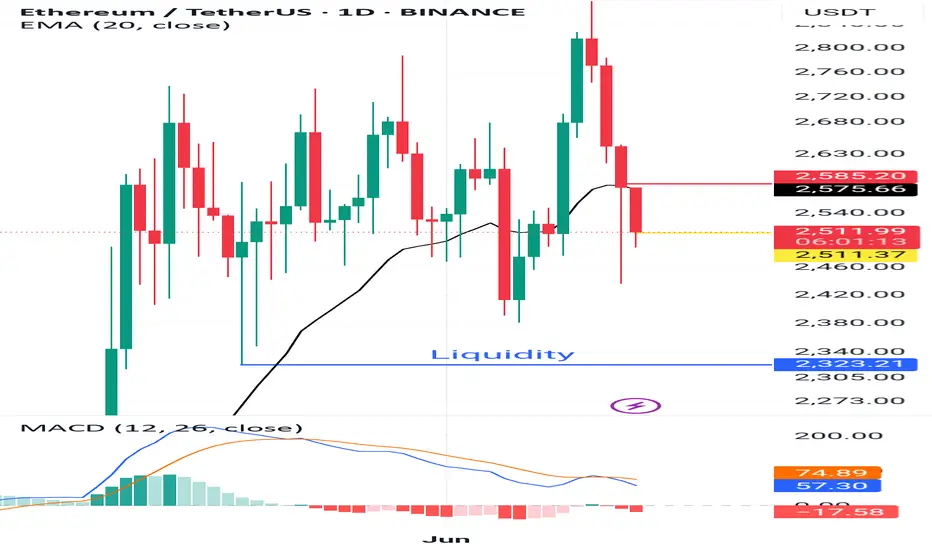
Daily vs 4H: Mixed Signals, Clear BounceOn both the 1D and 4H timeframes, price is still below the 200MA.
On the daily chart, it's also trading under the BB center line, the SMA, and the MLR.
However, on the 4H chart, price is now above the BB center line, SMA, and MLR — and it’s not far from triggering a long entry signal.
On the daily, we’ve seen a bounce from strong support: the 0.5 Fib level and the 200-week MA.
On the 4H, price looks ready to close above the last daily close — a promising sign.
Always take profits and manage risk.
Interaction is welcome.
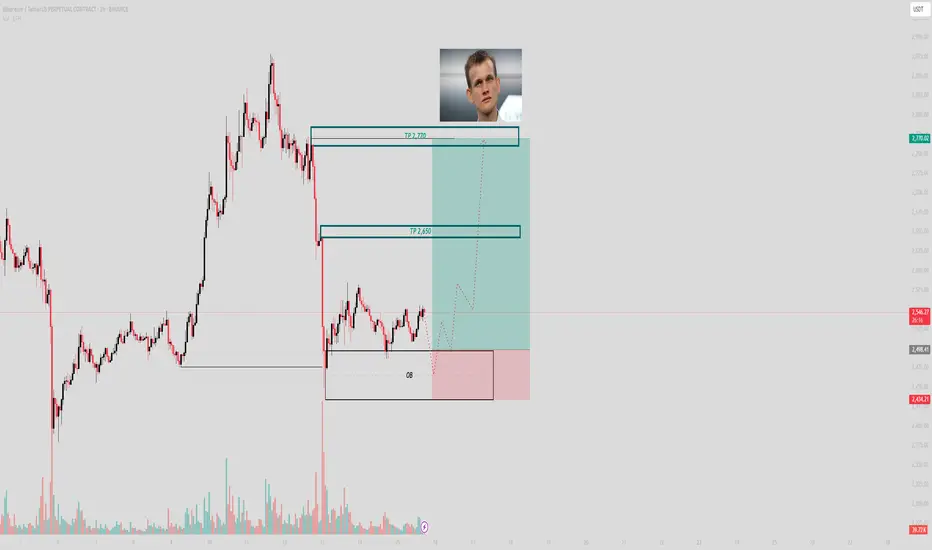
Vitalik didn’t draw this box. I did — and I’m trading itPrice delivered the sweep. Now it’s coiling inside my range, hovering just above the 1H OB like it’s waiting for permission. I don’t need permission. I need structure — and I’ve got it.
The logic:
ETH dropped into a clear demand zone — not a guess, a confirmed 1H Order Block. Since then, it’s printed compression just above the OB. Every wick into the range was absorbed — no expansion, just preparation.
Above us? Two objectives:
TP1: 2650 — inefficiency fill and previous high-volume rejection
TP2: 2770 — full reprice and external liquidity sweep
If price dips into the OB again? That’s not invalidation — that’s refinement.
Execution:
Entry: 2480–2500 (or on OB retest)
SL: Below 2434
TP1: 2650
TP2: 2770
You don’t chase this. You wait for it — then load it without hesitation.
Final thought:
“Smart Money doesn’t buy the candle. It buys the context.”
ETHUSED TREND WEAKER Price has been ranging between approximately 2500 and 2900 and the major trend is strongly bearish.Price recently attempted to break above previous highs but got rejected. Price is at a critical support level in a larger range structure. A break below 2500 could lead to a deep correction correction
ETHUSDT Perpetual – Breakout Trade SetupThis setup represents a clean long position entry on ETHUSDT.P with clear invalidation and target levels.
Trade Details:
Position: Long
Entry Price: $2,540.75
Stop Loss: $2,430.58
Take Profit: $2,705.33
Risk-to-Reward (RRR): ~1.45
Timeframe: Not specified (likely 1H or 4H)
Setup Rationale:
Price is attempting a recovery from a local support zone, aiming for continuation toward $2,700 resistance area.
Trade assumes strength in bullish follow-through if $2,540 is held.
Tight stop loss below the key liquidity area ($2,430s) protects from downside volatility.
Conclusion:
This is a classic trend-continuation breakout trade, entering slightly above consolidation with a moderate risk-reward ratio. Close monitoring of price action around the entry zone is important for managing exposure if the breakout fails.

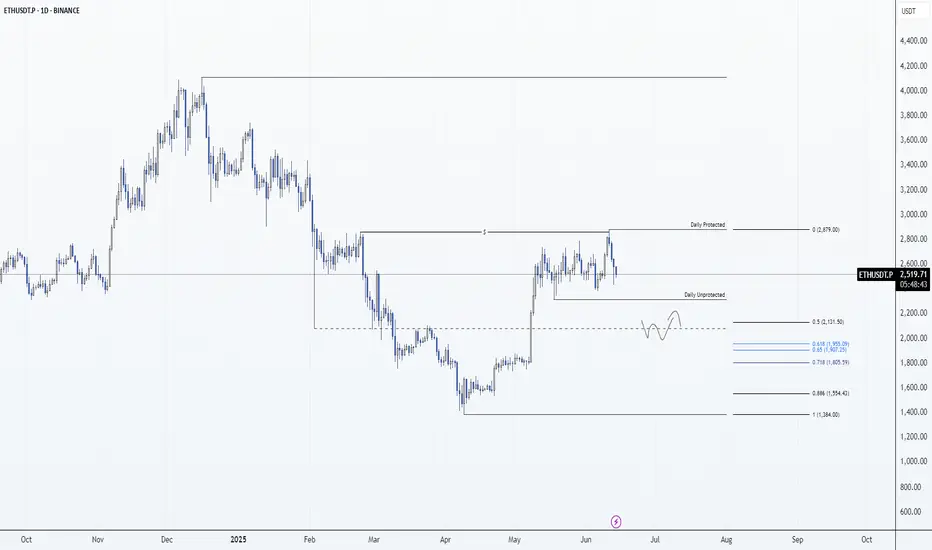
Ethereum. Daily Timeframe. Seller initiativeHey traders and investors!
📍 Context
• Market phase: Sideways range
• Current control: Seller initiative
📊 Key Price Action:
The price broke above the upper boundary of the range (2738) with a buyer KC candle, touching the 50% retracement level (2874) of the last weekly seller initiative (1).
However, the seller absorbed the buyer’s candle and pushed the price back inside the range (2), forming an IKC candle (3) — the highest volume candle within the seller’s initiative.
This sequence presents three bearish signals that support a potential continuation to the downside.
🎯 Trade Idea
Likely scenario: price tests the lower boundary of the range at 3,323.
🔸 In the meantime, it’s reasonable to look for short setups on lower timeframes within the current seller initiative.
🔸 If price reaches 3,323 and valid buyer patterns appear, this zone may offer a good opportunity for long entries.
This analysis is based on the Initiative Analysis concept (IA).
Wishing you profitable trades!
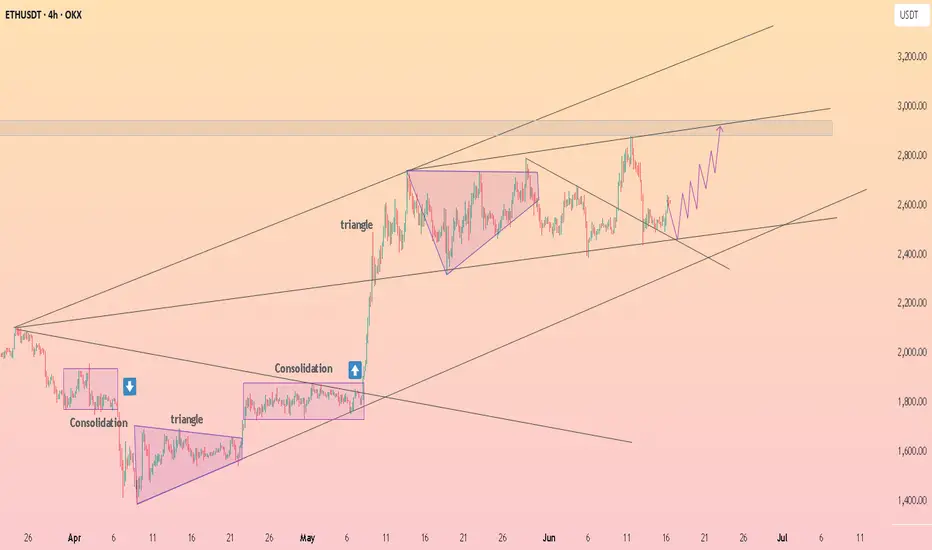
HolderStat┆ETHUSD continues to accumulateOKX:ETHUSDT is catching bids at the 2.50 k rail after triangle retest, converting shakeout into upside continuation. Staying above 2.40 k keeps bias north; clearing 2.75 k releases the 3 k target rocket 🚀
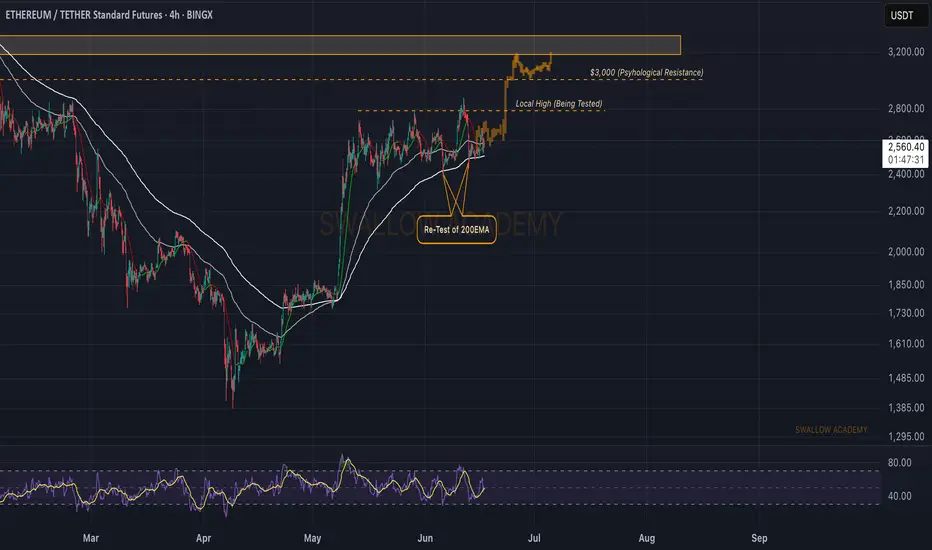
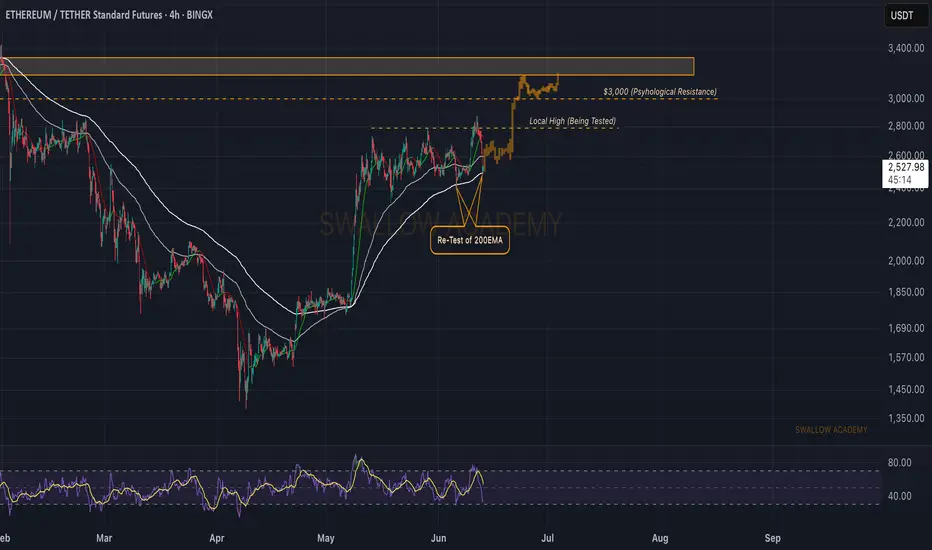
Ethereum (ETH): Stonger Than Bitcoin For SureEthereum is doing much better compared to Bitcoin, that's for sure, but it does not mean that ETH is not struggling.
We see the pressure that sellers are putting on, trying to regain the control over the 200EMA, which is a crucial area for us right now.
So while we keep our target at $3000 (first target), we also keep close attention to that moving average, where if we lose dominance, we might be heading to lows here...
Swallow Academy
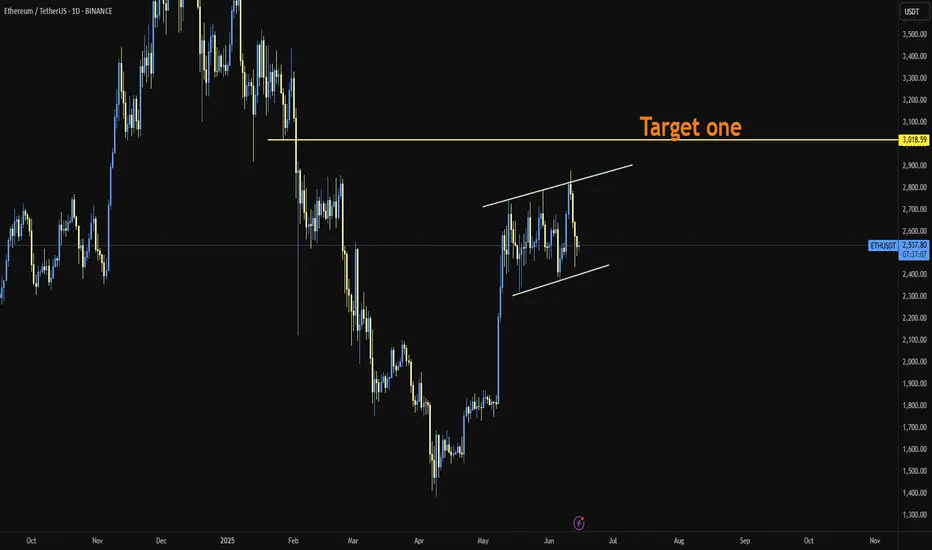
ETH/USDTWe have talked about Ethereum many times and said that the main goal of Ethereum is 3000. Ethereum has had an upward movement and is now in a channel. The last movement it had led to a failure and it went back inside. I think Ethereum is bullish. Comment your opinion.
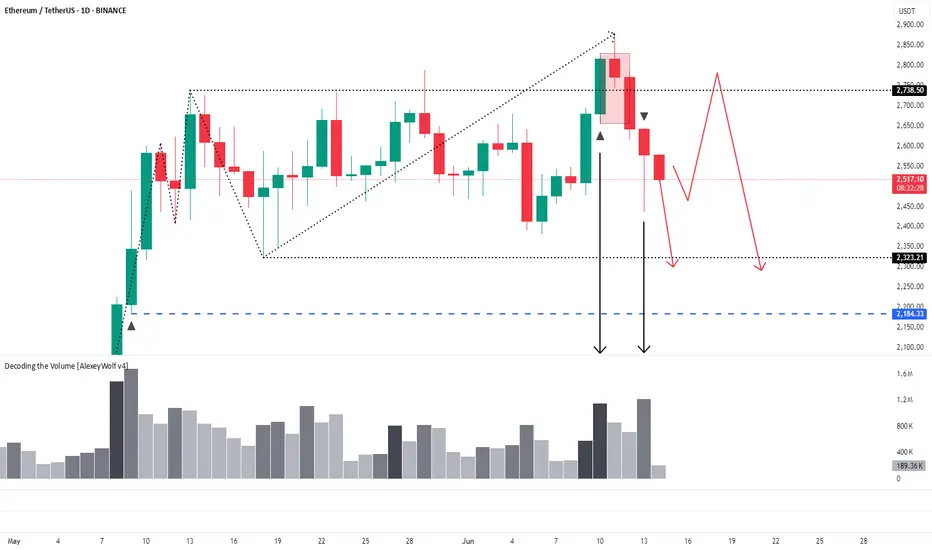
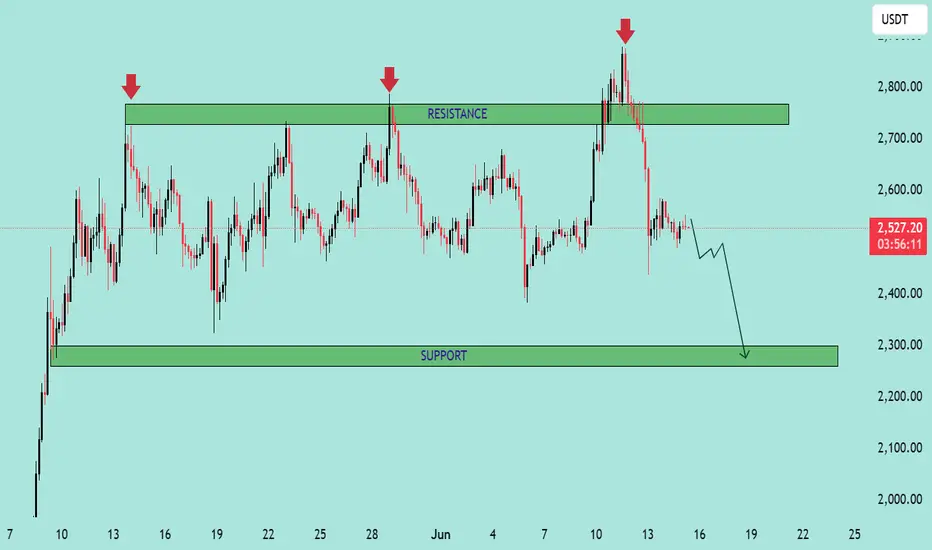
ETH/USDT – Bearish Reversal from Resistance Zone ETH/USDT – Bearish Reversal from Resistance Zone 📉
The chart above clearly illustrates a strong bearish setup on the ETH/USDT pair. Here's a professional breakdown:
📊 Technical Overview:
Resistance Zone (~2750–2850 USDT):
Marked by three distinct rejections (highlighted by red arrows).
Every attempt to break above this zone has resulted in a sharp price rejection, indicating strong selling pressure.
Current Price: 2529.69 USDT
Price has already broken below the immediate support formed after the last rejection.
The pair is now trending lower with bearish momentum.
Support Zone (~2250–2350 USDT):
This is the next major demand zone where previous accumulation took place.
The projection arrow indicates the likely path toward this area.
🔍 Price Action Insights:
Repeated failure to break resistance confirms a triple top pattern, a classic bearish reversal signal.
The recent sharp drop from the top is accompanied by strong bearish candles, showing momentum.
Minor consolidation might occur before continuation downward, as suggested by the zigzag arrow.
📉 Conclusion:
If bearish momentum sustains, ETH/USDT is likely to drop toward the 2,300 USDT support zone. A break below could open the door for even lower levels, while any bounce would need to reclaim the 2,700 USDT level to shift sentiment.
📌 Traders should watch for lower highs and bearish confirmations before entering short positions.
Ethereum (ETH): Back at 200EMA | Buyers Trying To Gain Control A strong selloff happened recently, which led the price to the 200EMA line, where, similar to last time we touched that area, we are seeing some kind of bullish overtake happening.
Now, as markets are very unpredictable currently, we are looking for a full buyside takeover to happen near the current zone, which would then mean that our game plan will remain the same: movement to $3000.
Now, if sellers continue to show dominance, we might be seeing a very nasty drop from here so keep your eyes wide open at the 200EMA line.
Swallow Academy
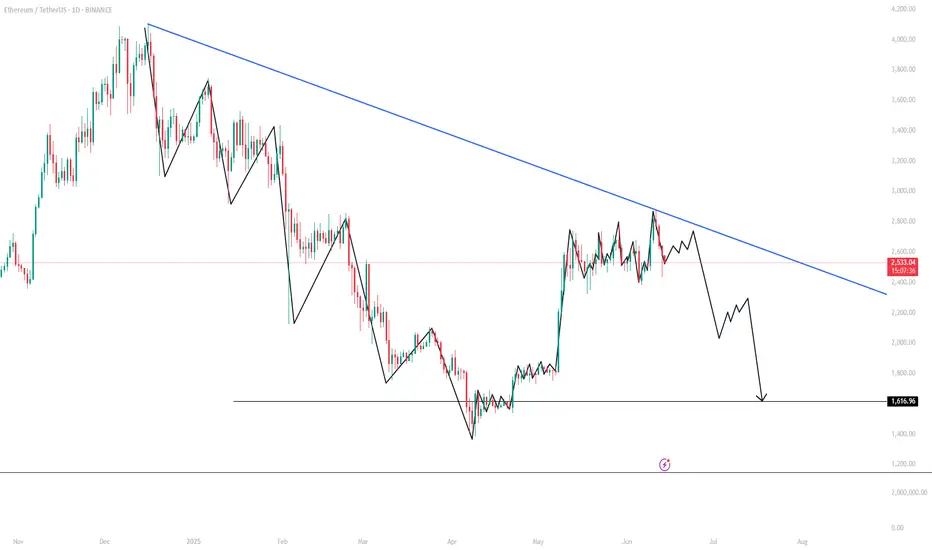
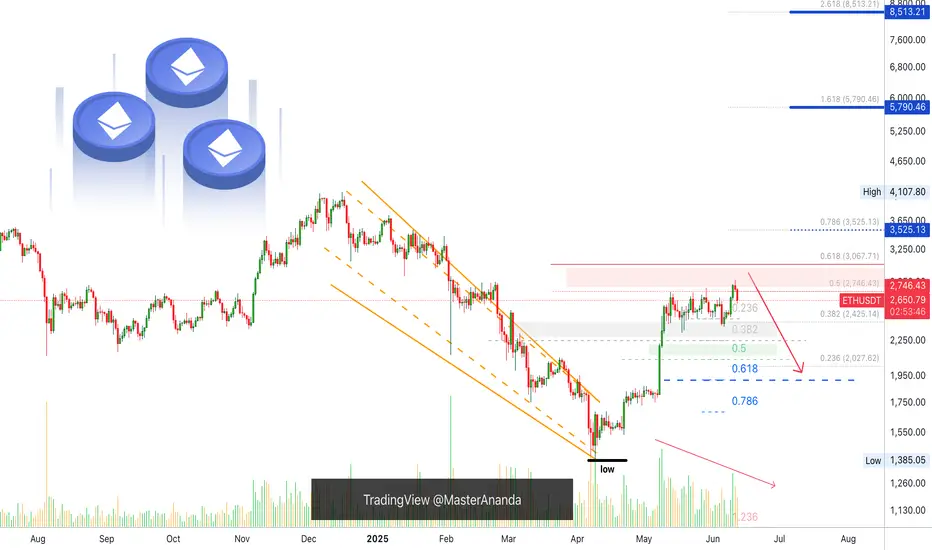
Ethereum Set To Continue Lower, How Long?The drop is now confirmed and yet, it is still early...
Good afternoon my fellow traders, all is good when we consider the chart, Ethereum's price and the bigger picture, nothing changes. But we are witnessing a retrace. This retrace will end in a higher low and I am thinking of time now, duration.
Initially I was thinking about the Fed meeting and this event being the catalyst for change, but the Cryptocurrency market is following its own cycle and for it to be super bullish later this year, all bearish action, all weak hands, needs to be removed now, today.
So the bearish action can fluctuate between just a few days, 3-5 days, to 1-2 weeks. That's my analysis based on past history, chart data and experience.
The retrace might not last that long though, market conditions continue to improve and Ethereum might not produce a lower low compared to Bitcoin. Bitcoin is trading pretty high and a correction can develop any day. Since Ethereum is already low compared to its ATH, there is less room for prices to move lower, makes sense?
The downside is always limited, SHORTing is riskier than going LONG. It is wise to wait for a new entry before buying more. Experienced traders are recommended to SHORT. This chart setup will change in a matter of days, and then the market will turn bullish again, long-term.
Thank you for reading.
Namaste.
eth in 45minas you can see we have a bullish trend and strong support for eth.the price will go up and push for orders in higher price.follow me for more....
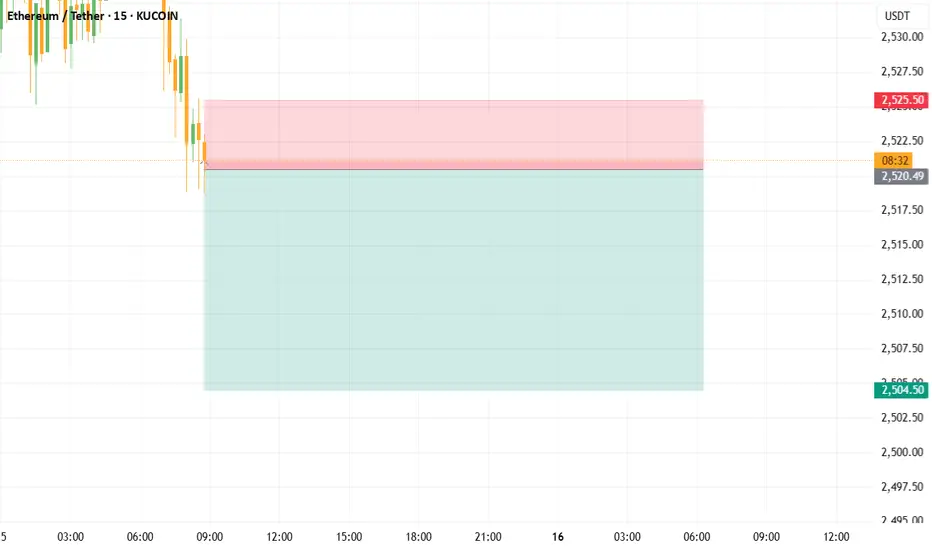
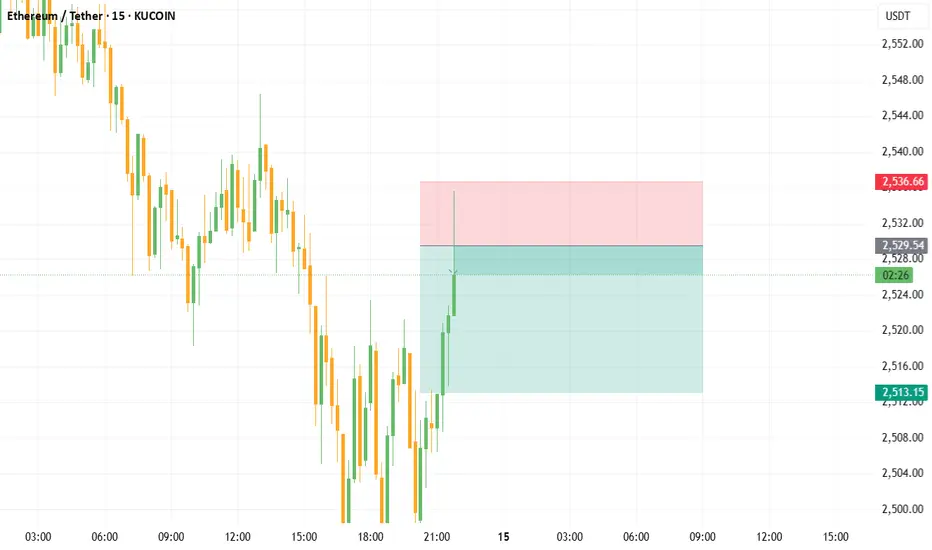
ETH/USDT Scalping Signal of the DayDirection: Empty
Entry Range: 2523 ~ 2528
Take Profit Target: 2508, 2501
ETH: Daily Timeframe 14/06/25Same idea as BTC — healthy corrective leg needed
Spot buyer at $2,100 and below
Will focus on accumulating other strong alts only when ETH is in my region of interest
No interest in predicting alt bottoms might bottom until BTC and ETH hit my buy zones
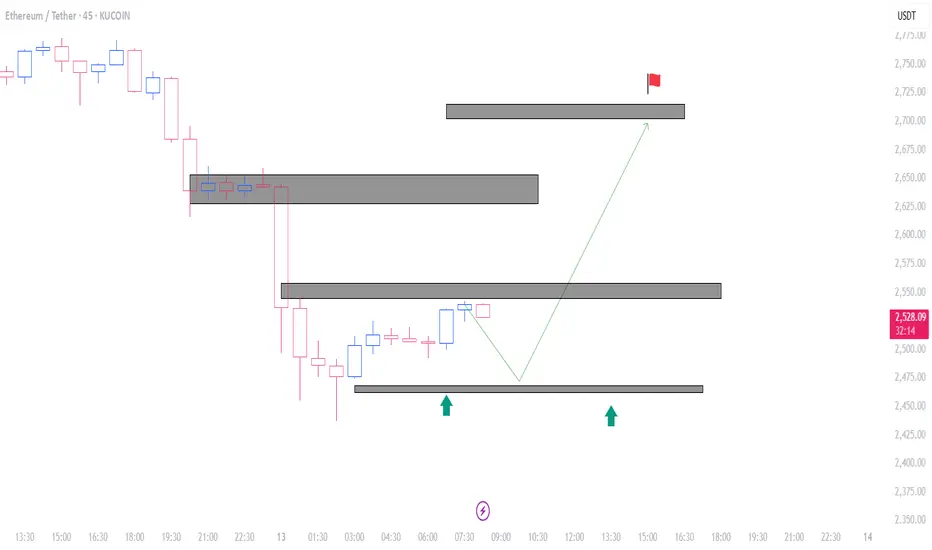
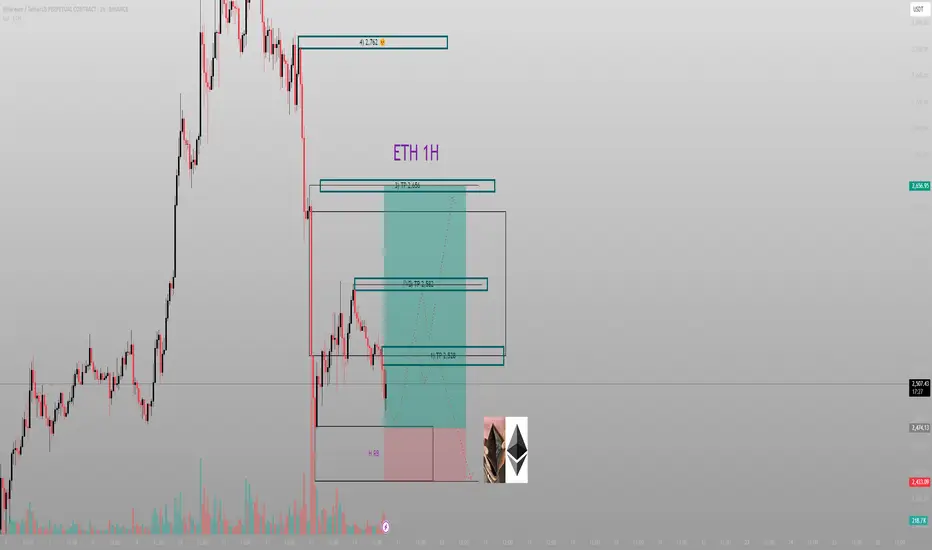
Every breakdown is just a setup — if you know where the reaccumuPrice collapsed. But I didn’t flinch. Because beneath that move sits something most won’t look for: High-Volume Rebalancing (H RB), paired with a clean FVG structure that tells me exactly where Smart Money wants to reload.
The structure:
The breakdown into ~2483 wasn’t just a move — it was intentional. That candle didn’t just fall, it delivered into the H RB zone and paused. Below that? Nothing but inefficient space and a tightly engineered low.
Above? Three clear target zones:
TP1: 2528
TP2 : 2582
TP3: 2656
Final objective: 2762 — the origin of the final collapse
Every leg above is engineered to grab liquidity, rebalance inefficiency, and then clear out the next range. It’s a chain of fulfillment.
The trade:
Entry: 2483–2500 zone
SL: Below the H RB zone (~2470)
TP1: 2528
TP2: 2582
TP3: 2656
Optional extension: 2762
We aren’t buying because it’s “down.” We’re executing because it’s deliberate.
Final thought:
“Collapse isn’t the end. It’s the invitation.”
Let the Market Teach You PatienceEvery red candle has a reason. Every drawdown has a lesson.
In this journey, it's not just about profits, it's about who you become.
As traders, we don’t just manage risk, we grow through it. Let patience, discipline, and humility shape you in silence, just like the markets do.
This is the mindset behind the candles.
#PEACE
ETHEREUM ETHUSDT is on a demand floor ,awaiting buy liquidity ,it could seek liquidity before going long.
if buyers fail to hold strong on demand floor ,it will retest the descending trendline at 1300$ level.

ETH-----Sell around 2525, target 2475 areaTechnical analysis of ETH contract on June 14:
Today, the large-cycle daily level closed with a small negative line yesterday, the K-line pattern continued to fall, the price was below the moving average, and the attached indicator was dead cross. The decline in the big trend is still very obvious, but we still have to pay attention to the stimulus brought by the news data. The low support is still around the 2300 area; the short-cycle hourly chart yesterday's European session rose and corrected the US session. The price began to retreat under pressure in the Asian morning today. The current K-line pattern is continuous and the price is below the moving average. The attached indicator is dead cross, so it is likely to continue to fluctuate downward during the day.
ETH short-term contract trading strategy:
The current price is 2525, directly short, stop loss in the 2565 area, and the target is the 2475 area;
