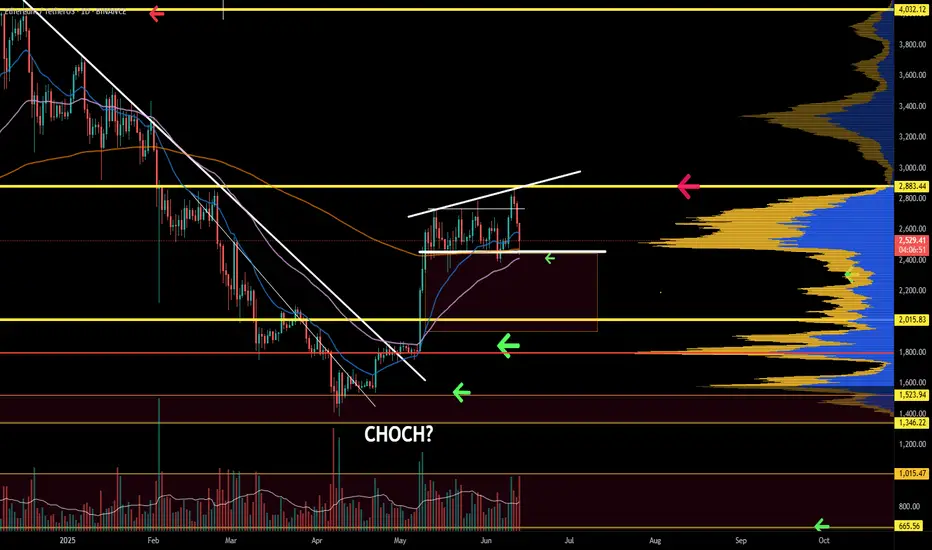
Ethereum Weekly: Bullish & Bearish ExplainedEthereum has been sideways five weeks straight. Market conditions here are bullish and bearish short-term. Let me explain.
The market has bearish potential because of resistance. Ethereum has been facing resistance and fails to move forward for more than one month, but the bias isn't bearish, this is just a potential based on short-term price action.
The market has bullish potential because of a strong recovery after the 7-April low; because it trades above the August 2024 low and because there is very little retrace since the 5-May break of resistance in the form of EMA34 and MA200.
Ethereum is bullish because it trades above MA200 and remains above this level.
We are seeing bullish consolidation. There was an advance recently and after this advance the market went sideways. This means bullish.
While there can be a retrace short-term, market conditions remain bullish for this pair; ETHUSDT.
The bulls have the upper-hand and the majority of signals are bullish. Ethereum will continue to grow.
There is no scenario where Ethereum moves and closes weekly below its 3-Feb and 24-Feb lows ($2,075). It is simply consolidating before additional growth. It is going to go up, sooner rather than later.
Thanks a lot for your continued support.
Namaste.
ETHUST.P trade ideas
Bitcoin's Price Action Reveals A Bearish Ethereum—Back To BasicsBitcoin is bearish, top confirmed; we know Ethereum and Bitcoin move together in the exact same way. This means that Ethereum will also move lower.
Here we have a higher high but lacking strength, volume is dropping. There will be a continuation of the retrace.
Consider waiting (SHORT) until after the FED decision result. The market can remain slightly bearish until after the event. The drop will open the doors for new entry prices. Market conditions can always change.
We are live with a 20X SHORT on Bitcoin, Ethereum will do the same. Just a small drop (can be a strong drop) ending in a higher low followed by a new wave of growth. Not all charts/pairs/projects are the same. Some will move down while others move up. Sell at resistance, buy at support.
Namaste.

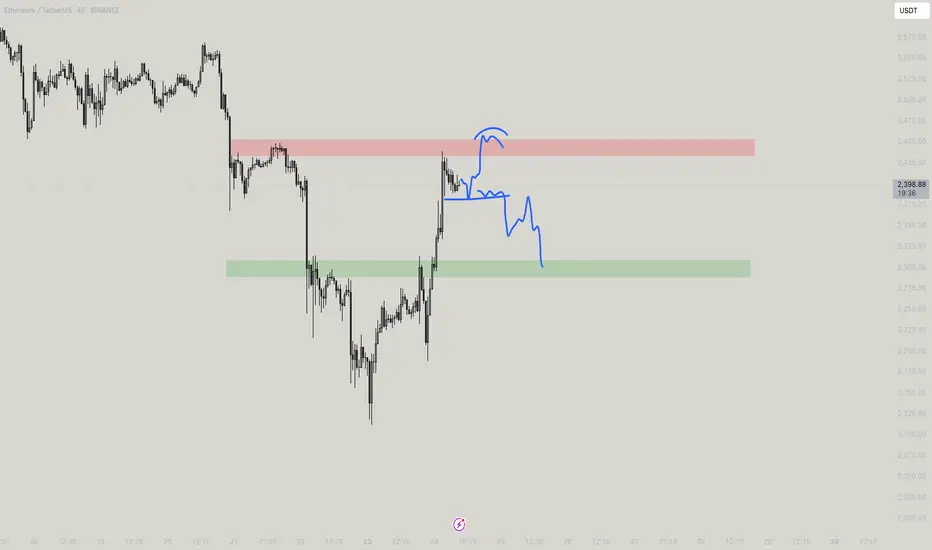
Ethereum (ETH) is still looking bullish"Spring" breakout, retest of the range low. Textbook price action on ETH!
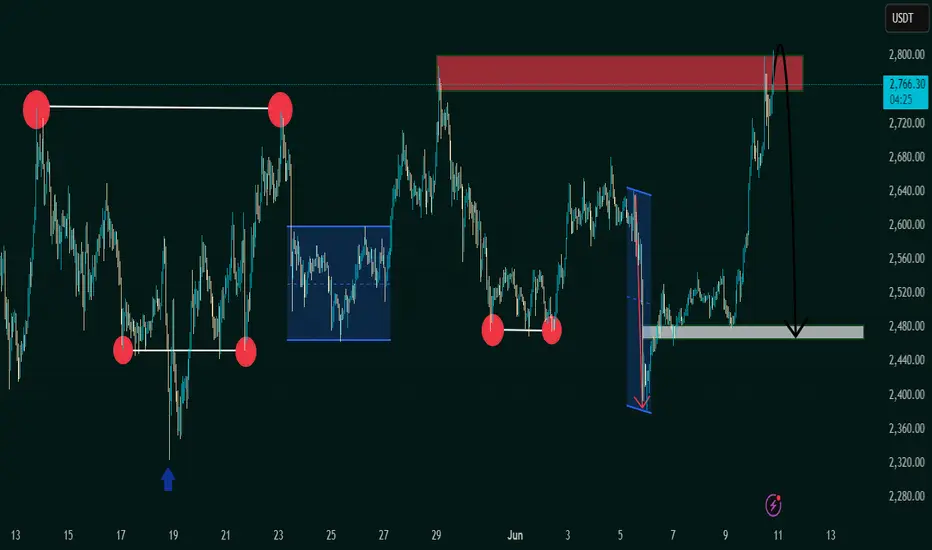
"Bearish Reversal Opportunity Following Supply Zone Rejection"1. Double Top Formation (Resistance Level Identified)
The chart displays a clear double top structure at the 2,760–2,800 USDT level.
This level has acted as a strong supply zone (highlighted in red), where price previously reversed, indicating heavy selling interest.
Current price action has retested this resistance zone and shown signs of rejection.
2. Liquidity Sweeps & False Breakouts
On the left side of the chart, an aggressive downward wick (marked with a blue arrow) suggests a liquidity sweep below a key low before strong bullish momentum returned.
This type of price action indicates smart money involvement, designed to remove weak hands before pushing price higher.
3. Accumulation Phases (Sideways Consolidation)
Multiple accumulation ranges are highlighted with blue rectangles.
These ranges show horizontal consolidation, where price builds up energy before breakout.
The most recent breakout led to a vertical rally toward the resistance zone, signaling an end of the accumulation and a start of distribution.
4. Double Bottom Support Structure
Identified near the 2,480 level, marked by red circles.
This level has historically acted as demand/support, evidenced by multiple bounces from this price zone.
Now highlighted with a grey zone, it is projected to act as the next key support area.
5. Bearish Projection
A large black arrow suggests a forecasted bearish move from the current high (~2,800) back to the support zone (~2,480).
This aligns with the idea of a mean reversion or pullback after a strong bullish impulse.
---
Conclusion & Trade Idea:
🔻 Bias: Bearish (Short-term)
The chart presents a classic reversal pattern with a double top at a well-defined supply zone.
Entry could be considered after confirmation of rejection from this level.
🧠 Trade Plan Suggestion:
Entry: Short near 2,780–2,800 after bearish confirmation (e.g., bearish engulfing candle or break of structure).
Target: 2,480 (support zone).
Stop Loss: Above 2,820 (recent high).
Risk-Reward: Approximately 1:2.5 or better depending on execution.
ETH rang is being respected. ETH is holding strong within range. As long as the price stays in range, a bullish bias is supported. If the price breaks below, there is a volume gap sub 2k. Be ready with the plan.
Full TA: Link in the bio
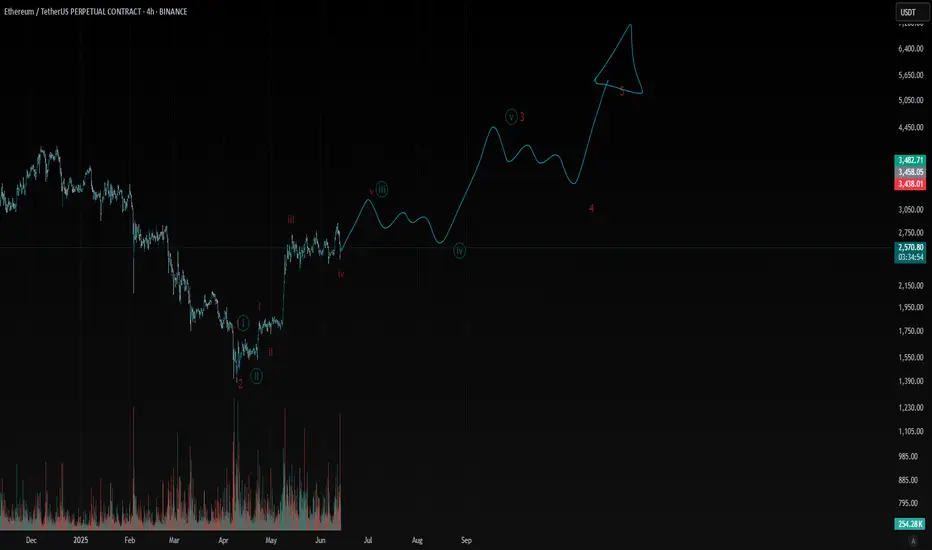
ETH: Next ATH on the Horizon? My Elliott Wave Analysis Says YESMy latest Elliott Wave count on TradingView points to a significant bullish impulse for ETH, suggesting we're gearing up for a fresh All-Time High! The wave structure looks clean, indicating strong momentum ahead.
Check out my chart and let me know your thoughts on this potential move!
#ETH #ElliottWave #TradingView #ATH #Crypto #MarketAnalysis #Bullish
HolderStat┆ETHUSD above the consolidation zoneCRYPTOCAP:ETH
→ Basing above 2 400 while probing triangle apex
↳ Crack 2 550–2 600 for runway to 2 850–3 150
⇢ Trend guard sits at 2 650 → 2 500
⤴ Close < 2 650 drops Ether back into old range
ETH - Another Take - When in Doubt, Zoom OutETH on the multi day time frame appears to have been respecting this ascending series of support / resistances since its inception.
If this resistance holds, this is a major breakdown of ETH’s last support - assuming the chart does work best on these ascending channels (certainly has historically).
Due to this I am shorting ETH at 2550 appx - and my targets are marked on the chart (3 purple levels).
I don’t see why any formation on the chart should be dismissed if it has a strong interaction historically.
Let’s see what happens.
Happy trading
Ethereum VS $2800The 20MA on monthly timeframe for Ethereum is still working as a strong resistance, and Ethereum is running out of time to break it.
Maximum June or July..
This isn’t a breakout. It’s a setup.ETH has been coiling under this level for weeks. While most watch for breakout confirmation — I’ve already mapped the reaccumulation narrative.
The structure:
Price delivered cleanly off a Daily OB and is now grinding through prior inefficiencies. Multiple D FVGs stack just beneath the current zone — not noise, not gaps — these are algorithmic footprints.
Below price? A refined Daily Order Block at 2558, paired with stacked inefficiencies all the way to 2392. That’s the reload zone if price wants to run it deeper.
But the key here is this: price is compressing under draw-level FVGs. Every candle is building imbalance. Every wick is a test. This isn't weakness — it's staging.
Scenario 1:
Minor pullback into local D FVG cluster
Hold above 2580–2600
Reprice into 3030 FVG
Final objective: 3434 sweep and delivery into premium inefficiency (3650+)
Scenario 2:
Sweep below 2580 into full OB at 2558
Sharp rejection
Acceleration through D FVGs above
Mindset:
You don’t chase moves. You wait where Smart Money builds. This isn’t about predicting pumps — it’s about positioning before they become obvious.
“Structure doesn’t lie. Price just tells you who’s in control.”
ETH long chanceHello everyone...
Welcome to my channel!
If you liked the analysis below, hit the rocket button.
Let's dive into the Ethereum analysis on the 4-hour time frame.
What are we waiting for right now?
We are waiting for the 2874 level to break with good volume, so we can enter a long position with proper risk management. It is worth noting that there is a chance of a fake-out, so either use a large stop-loss below the 2310 level, or a smaller stop-loss with a small risk-to-reward ratio. If you're using a smaller stop, make sure to lock in profits sooner.
The green boxes you see in the image indicate the strong presence of buying makers who have established solid support in these areas. If the buyers fail at the 2700 area, we may need to focus more on the bearish scenario.
Hitting the rocket and sharing your comments motivates me.
Stay profitable!
"ETH Bullish Heist: MA Breakout Confirmed! Next Stop 3600?"🔷🔹 "THE ETH HEIST: MASTERPLAN TO LOOT 3600!" 🚨💰 (Breakout + Pullback Strategy)
🌟 Yo, Fellow Market Robbers! 🌟 (Hola! Bonjour! Salaam!)
Listen up, Money Makers & Thieves! 🏴☠️💸
Based on the 🔥Thief Trading Style🔥, we’re about to pull off the ultimate ETH/USDT heist—Ethereum vs Tether is our target!
🔪 THE TRADE SETUP (LONG HEIST)
🎯 Entry Signal:
"The heist begins at MA Breakout (2900)! Wait for confirmation, then strike like a pro thief!"
Option 1: Buy Stop above MA (2900) for breakout momentum.
Option 2: Buy Limit on pullbacks (15-30min TF) for sneaky low-risk entries.
📌 ALERT! Set a breakout alarm—don’t miss the robbery!
🛑 Stop Loss (Thief’s Escape Route):
"Yo! If you’re entering on breakout, DO NOT set SL before it triggers! Place it at the nearest swing low (12H TF)—or risk getting caught by the bears! 🐻🔪"
🎯 Profit Target: 3600 (OR Escape Early!)
Scalpers: Only long scalps allowed! Use trailing SL to lock profits.
Swing Thieves: Ride the wave but exit before the cops (bears) arrive!
⚡ WHY THIS HEIST WILL WORK:
Bullish momentum + MA Breakout = Easy Loot!
Overbought? Trap? Reversal? Nah—we escape before the danger zone! (Yellow ATR = High Risk)
📢 THIEF’S WARNING:
🚨 News Alerts = Market Chaos!
Avoid new trades during high-impact news.
Trailing SL = Your Best Friend.
💥 BOOST THIS HEIST!
👉 Hit 👍 LIKE & 🔔 FOLLOW to strengthen our robbery squad! More heists = More profits! 🚀💰
Stay tuned, thieves… Next heist coming soon! 🏴☠️🔥

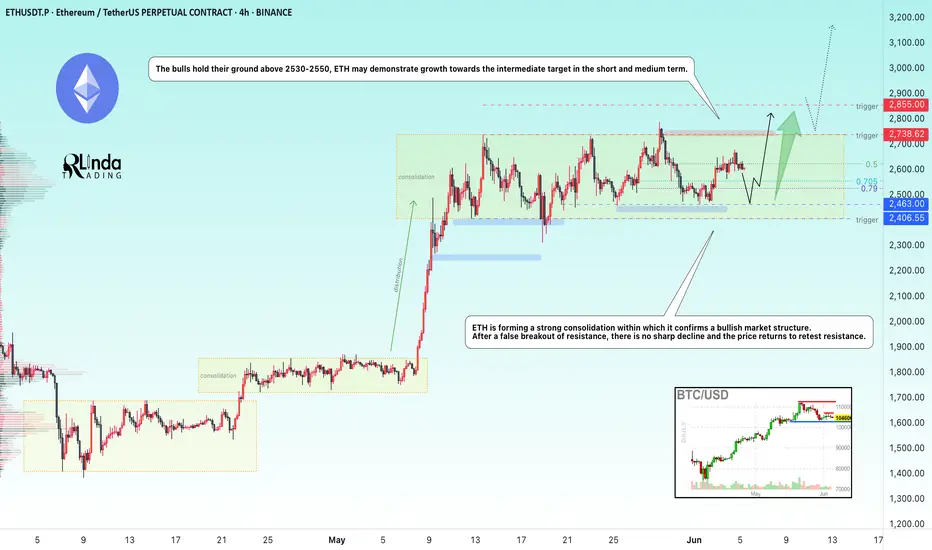
ETHEREUM → Consolidation amid a bull marketBINANCE:ETHUSD is consolidating in the range of 2400-2750, and locally, the coin looks quite promising even against the backdrop of Bitcoin forming a correction...
ETH is forming a strong consolidation within which it confirms a bullish market structure. After a false breakout of resistance, there is no sharp decline and the price returns to retest resistance.
If the bulls hold their defense above 2530-2550, then in the short and medium term, ETH may demonstrate growth towards the intermediate target.
Resistance levels: 2738, 2855
Support levels: 2525, 2470, 2400
A retest of support at 2525 - 2470 is possible, and if the price holds above this support zone, ETH may try to surprise us. There are good chances for growth.
Best regards, R. Linda!
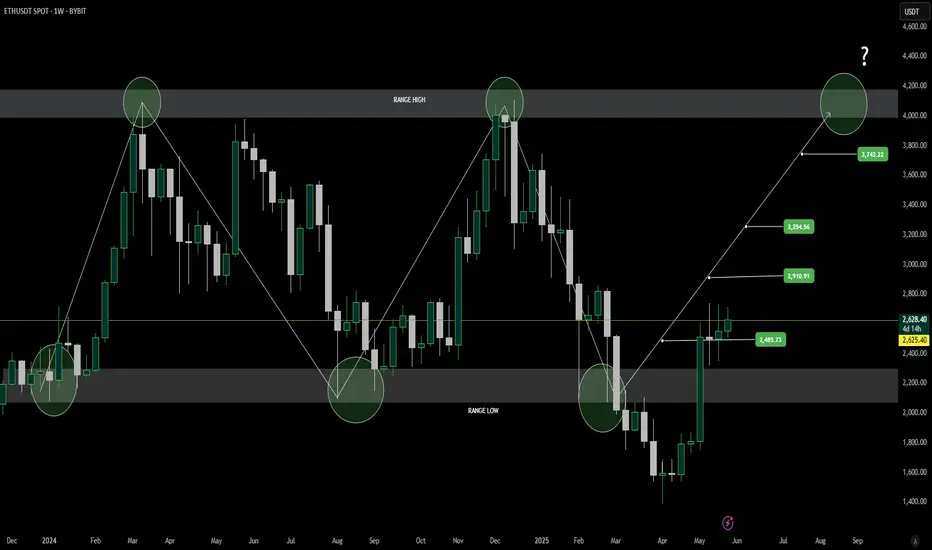
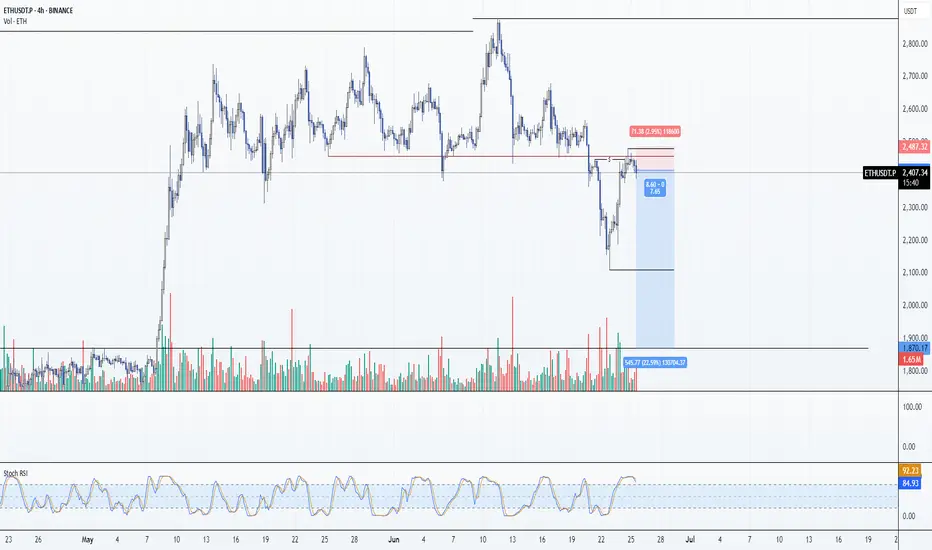
Ethereum (ETH) Weekly Outlook: Momentum Builds After Range BreakEthereum’s weekly chart continues to follow a well-defined trading range, oscillating between its historical range lows and highs. Recently, ETH closed decisively above the $2,200 level, marking a key structural break and reinforcing bullish sentiment. This move has already led to the first upside target at $2,484 being successfully hit.
Historically, Ethereum has shown a cyclical range-bound pattern — bouncing from the range low and encountering resistance at the top. With the lower boundary now acting as support and the first resistance target cleared, ETH may be entering a momentum phase with eyes on higher resistance levels.
The next major targets to watch are $2,910, $3,254, and $3,743, with $4,200 remaining the critical breakout level. A close above this zone could trigger a strong bullish continuation, potentially entering a new price discovery phase. However, failure to push past these upper resistance levels could see Ethereum revert to its range-based behavior.
The recent price structure, combined with strengthening weekly closes, provides confidence for bulls — but confirmation at each stage remains vital. Traders should monitor volume surges, price reactions at resistance, and macroeconomic catalysts that could affect sentiment.
As always, disciplined risk management is essential as Ethereum navigates these key technical zones. With a breakout above $2,200 confirmed and the first target reached, the market may be gearing up for its next move — and it's one worth watching closely.
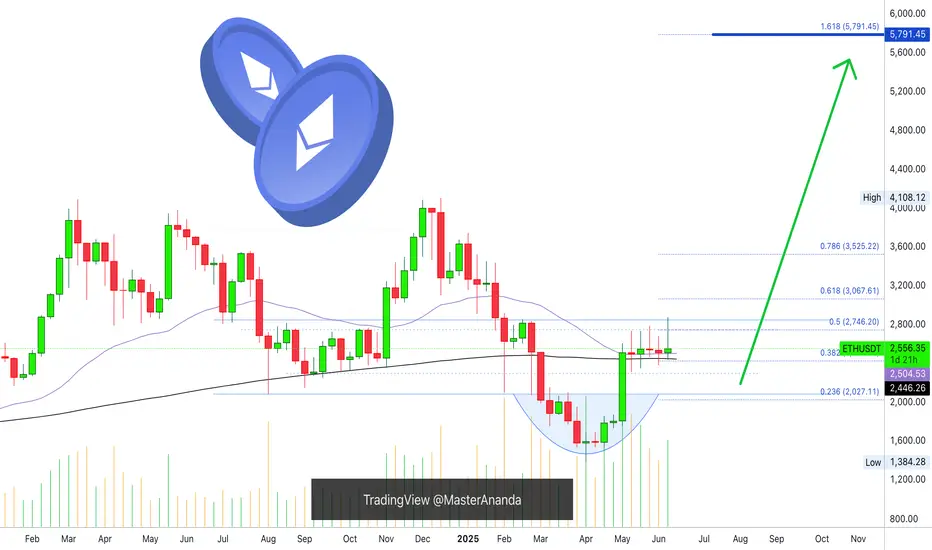
ETH GOING TO $4K 1.618 incoming
Looks like we are heading to the right direction after CPI reports 2.4% =0.024 Dovish
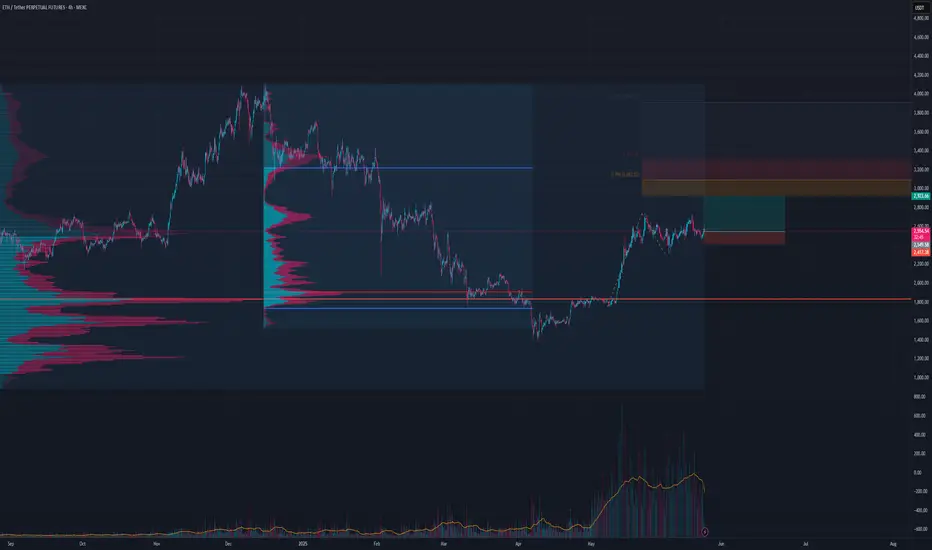
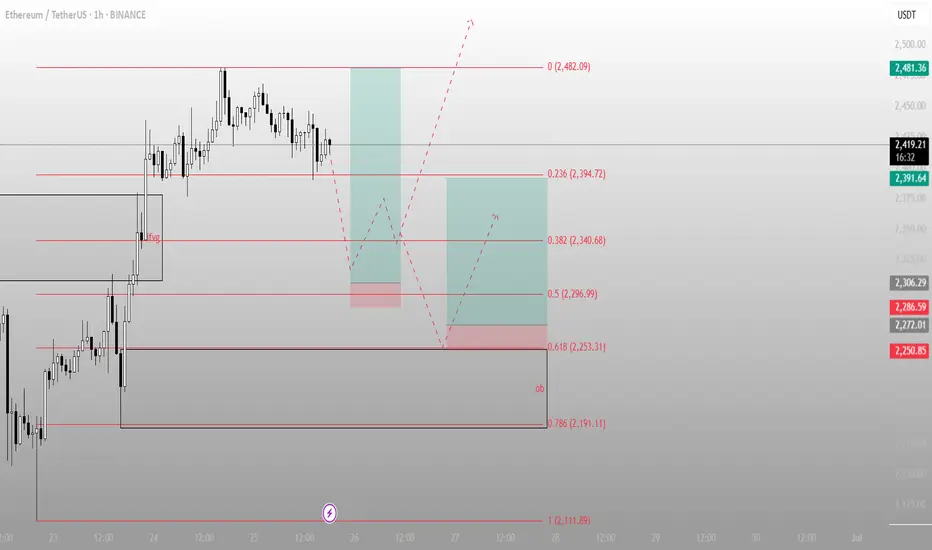
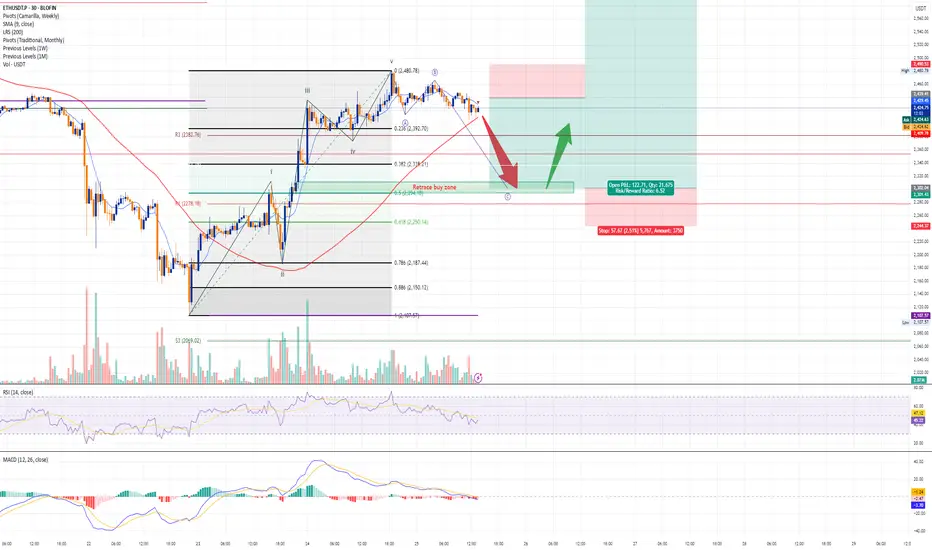
Everyone sees consolidation. I see positioningETH is holding just above a key fib cluster, showing signs of controlled distribution, not weakness. Smart Money doesn’t chase — they build positions while the crowd second-guesses.
The Structure:
Current Price: ~2,419
Local High (Premium): 2,482.09
Fib Retracements:
0.236 → 2,394.72 (mild correction)
0.382 → 2,340.68 (initial re-entry zone)
0.5 → 2,296.99 (ideal discount)
0.618 → 2,253.31 (deep entry, high confluence)
0.786 → 2,191.11 (structure last line)
Key Zones:
FVG already filled during the move up — imbalance mitigated
Order block (OB) at 2,191.11: high-probability reaction zone
Strategy Outlook:
Scenario A (Shallow pullback):
ETH tests 2,394 → 2,340, then continues the push to 2,482
→ Aggressive buyers step in early
Scenario B (Deeper sweep):
A drop to 2,296 → 2,253 opens the door for reaccumulation
→ Classic Smart Money trap before the next rally
Invalidation:
A break below 2,191 (and OB failure) kills this bullish narrative
Execution Logic:
Accumulation Zones:
Light: 2,340–2,296
Strong: 2,253–2,191 (discount reload)
Target:
2,482
Extension optional if momentum builds above recent highs
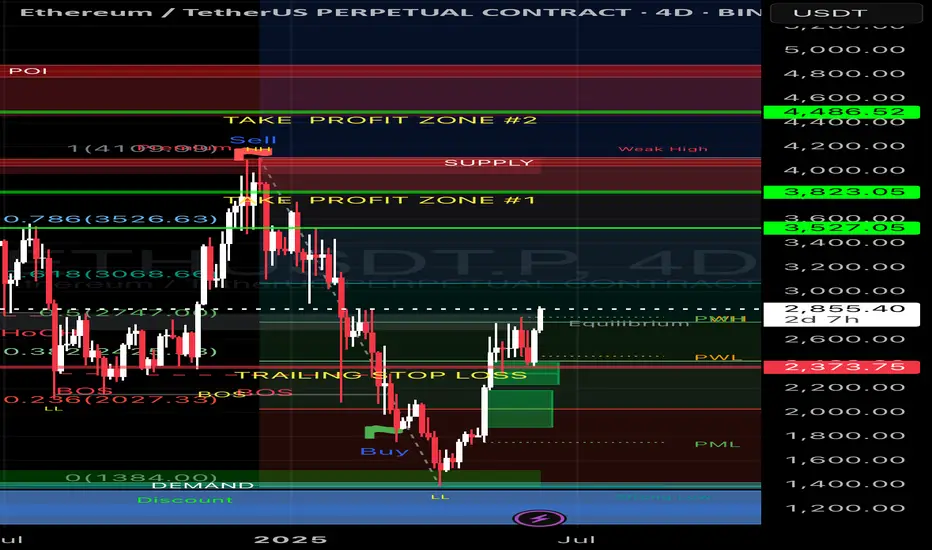
Ethereum's Rally Looks Like a Trap. Here's Why.In this analysis, you will find a clear scenario for a potential short setup with precise conditions for confirmation and invalidation. No fluff or guesswork—only institutional analysis of capital footprints and pure price action. I will provide updates for every stage of price interaction with the POI in near real-time, so you can make timely trading decisions, not just observe events after the fact.
Context
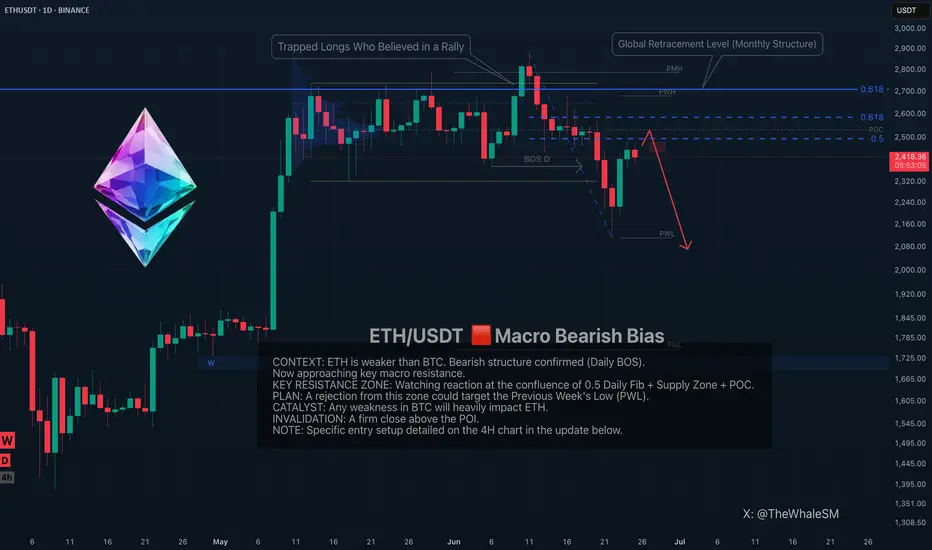
Ethereum's recent sell-off was only stopped from falling into the abyss by Bitcoin's reversal and the trapped shorts that needed to be shaken out. The instrument looks very weak for any sustained growth. The bearish structure was confirmed by a daily Break of Structure (BOS) to the downside and the beginning of a higher-timeframe order flow from the global 61.8% monthly retracement level.
The Resistance Zone to Watch
I expect a little more upside under Bitcoin's influence, after which Ethereum will face the key resistance zone. This area is a confluence of:
The 0.5 Fibonacci retracement level.
The key supply zone that aligns with the range's Point of Control (POC).
A reversal from this zone could lead to a decline to take out the Previous Week's Low (PWL) . The catalyst could be any weakness in Bitcoin, as ETH is clearly weaker (it fell out of its global range, while BTC held its).
I assume ETH won't pass this resistance because many retail traders are trapped in losing long positions above $2700, and there are no significant institutional POIs higher up to justify a price return.
The specific entry conditions are detailed on the 4h timeframe in the Note below.
~~~~~~~~~~~~~~~~~~~~~~~~~~~~~~~~~~~~~~~~~~~~~~~~~~~~~~~~~~~~~~~~~
If you found this analysis helpful, support it with a Boost! 🚀
Have a question or your own view on this idea? Share it in the comments. 💬
► Follow me on TradingView to get real-time updates on THIS idea (entry, targets & live trade management) and not to miss my next detailed breakdown.
► For DAILY watchlists & more assets, find me on X! The direct link is located right under my profile name above ↗️
~~~~~~~~~~~~~~~~~~~~~~~~~~~~~~~~~~~~~~~~~~~~~~~~~~~~~~~~~~~~~~~~~
ETH: Short 25/06/25Trade Direction:
ETH: Short
Position Strategy:
- Risk approx 0.5%
Reason for Entry:
- Daily FVG
- Big resistance level
- Critical level of resistance, until flipped bias on eth must remain bearish intraday
- H4 Liquidity Swept
ETH Retracement 50% FibHi there, I think there will be a retrace at ETH to 50% fib. My new buy zone will be 2300 and I am short at the moment to 2300. Hope this helps you out. Do your research and this is no financial advice, just an idea. Oh and by the way, I got my SL just above the current high (~2490).
Let me know what your thoughts are in the comment below!
ETH/USDT | ICT Price Delivery Model: AMD📍 ETH/USDT – Daily Timeframe | ICT Smart Money Framework
This analysis outlines a clean execution of the ICT Price Delivery Model:
🔹 Accumulation Phase:
Price consolidates in a defined range, building liquidity above and below the zone.
🔹 Manipulation Phase:
Liquidity sweep to the downside taps into the Balanced Price Range (BPR) — engineered to trap late sellers.
🔹 Repricing Phase:
Price reacts sharply from the Daily Fair Value Gap (D FVG), confirming bullish intent.
🔹 Distribution Objective:
Smart Money likely targeting external liquidity resting above the $3,400 level.
Key ICT Concepts Applied:
✔ Break of Structure (BOS)
✔ Market Structure Shift (MSS)
✔ Fair Value Gap (FVG)
✔ Balanced Price Range (BPR)
✔ External Liquidity ($$$)
📈 Directional Bias: Bullish
🎯 Primary Target: $3,400 (Distribution Zone)
🕒 Chart Type: Daily (1D)
📉 Invalidation: Break and close below BPR without mitigation
📊 Shared by SeenForex – Precision Analysis through ICT Methodology

ETH - When $3,000??The one who frontrun ETH at the bottom are the real boss, looks good from 2460 for longs, and slit for buys at the range if something outlasts
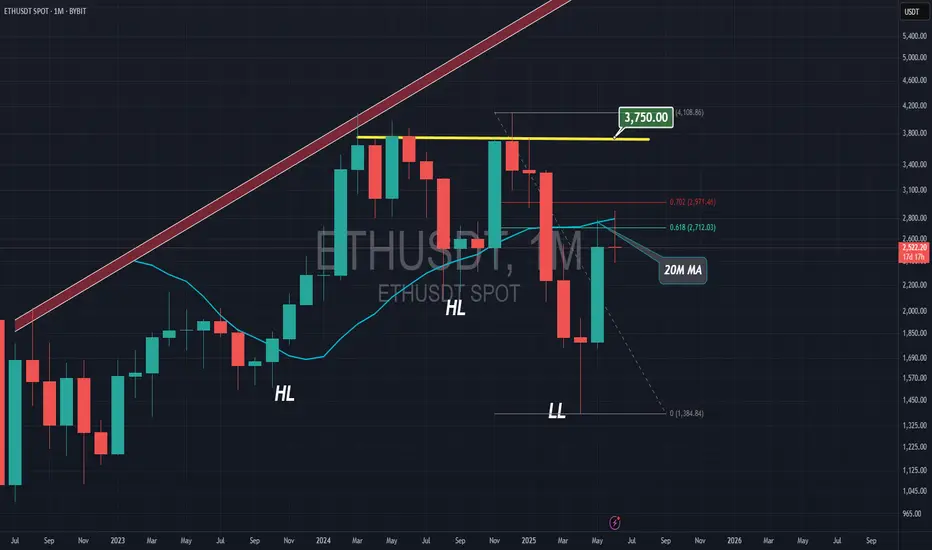
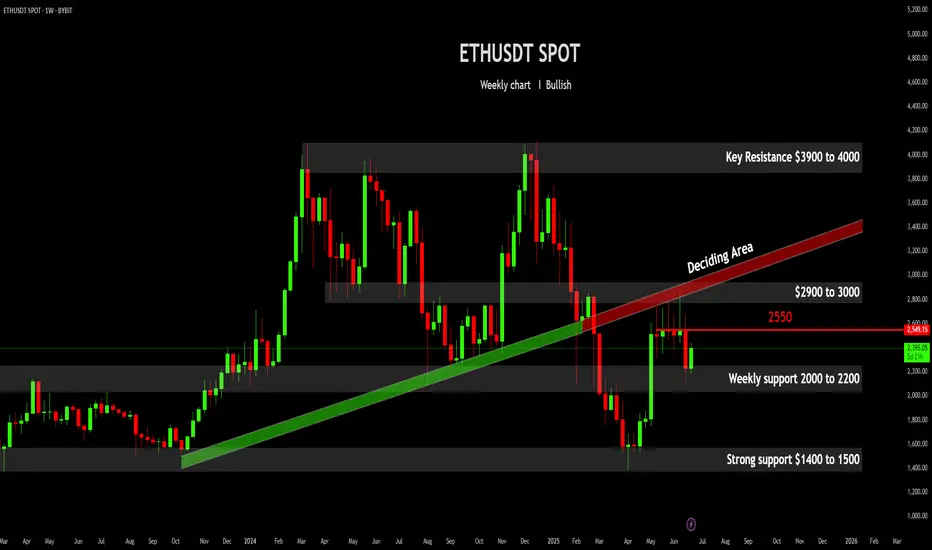
ETHUSDT Weekly: $2550 - The Bullish Pivot Point• Current Price Consolidation and Immediate Range : The ETHUSDT price is currently consolidating within a critical immediate range, bounded by the 2000−2200 weekly support below and the 2900−3000 overhead resistance area. This 2000−3000 zone defines the current primary trading boundaries on the weekly timeframe.
• Key Bullish Catalyst at $2550 : For the bullish sentiment to gain significant momentum and indicate a potential continuation of the recent upward movement, a decisive weekly close above the $2550 level is paramount. This price point acts as an immediate pivot; successfully clearing and holding above it would suggest a re-energized buying interest targeting the upper bound of the current range.
• Significance of the "Deciding Area" : The 2900−3000 region, labeled as a "Deciding Area," represents a crucial resistance confluence. This zone previously served as significant support and the long-term green ascending trendline, which was subsequently broken. A successful retest and breakout above this area would indicate a potential shift in market structure from bearish to bullish, opening the path towards the higher Key Resistance at 3900−4000.
• Critical Support and Downside Risk : Maintaining the 2000−2200 weekly support is essential for bulls. A sustained weekly closure below this level would invalidate the current bullish outlook and likely lead to a retest of the strong demand zone around 1400−1500, signaling a deeper retracement or a renewed bearish trend.
Disclaimer:
The information provided in this chart is for educational and informational purposes only and should not be considered as investment advice. Trading and investing involve substantial risk and are not suitable for every investor. You should carefully consider your financial situation and consult with a financial advisor before making any investment decisions. The creator of this chart does not guarantee any specific outcome or profit and is not responsible for any losses incurred as a result of using this information. Past performance is not indicative of future results. Use this information at your own risk. This chart has been created for my own improvement in Trading and Investment Analysis. Please do your own analysis before any investments.
ETH Long TradeLooks bullish here for continuation
Futures are higher on holiday
Order flow neutral to bullish