ETH UPDATE 🛡️ Ethereum Holds the Line — Critical Support Zone Tested Again
Because Ethereum has plummeted over 14% since Wednesday, traders and long-term holders are worried. Bullish investors expected ETH to break over $3,000 and confirm a wider cryptocurrency rise days earlier.
However, global turmoil has slowed markets. Israel's assaults on Iran and retaliations shook global markets on Thursday, causing crypto asset volatility and risk-off.
Historical trends between August 2021 and early 2024 suggest that keeping $2,500 has led to rallies reaching $4,000. Rekt believes Ethereum must maintain consistency around this zone to prevent a deeper retreat and maintain bullish momentum.
ETH has held $2,500 over five weeks, proving its stability despite numerous testing. In the weeks ahead, altcoins and the crypto market will depend on whether Ethereum can maintain this footing again.
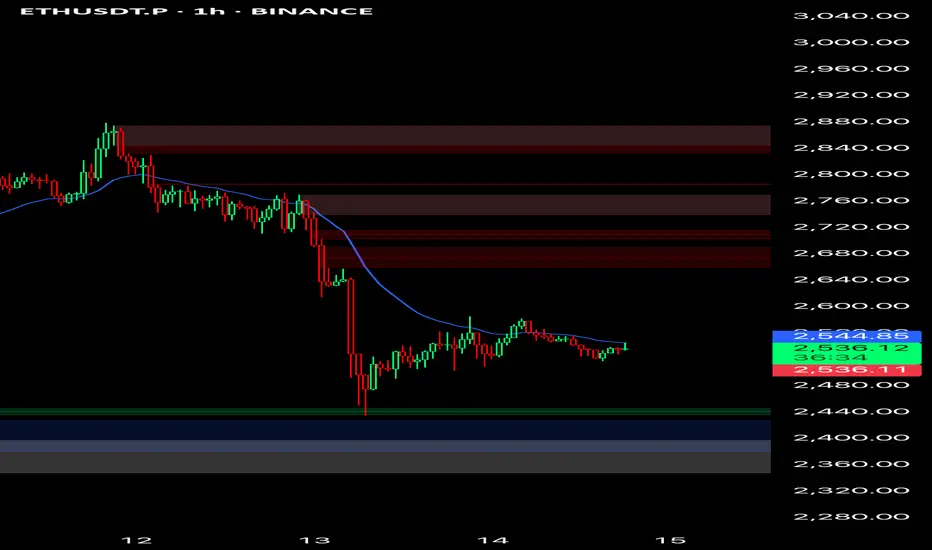
Ethereum fell sharply from $2,830 this week to $2,556. On the daily chart, ETH has been rangebound between $2,500 and $2,830 for weeks. Ethereum has held above the 50-day and 100-day moving averages, which are rising, despite international threats.
The red 200-day moving average at $2,642 has provided resistance. A retracement followed ETH's short break above this level, which it failed to keep. Recent volumes have increased due to heightened attention and emotive price responses in the Israel-Iran conflict.
The $2,500–$2,520 support zone is important. This region has been a floor before and might rocket bulls if they recover control. A clear fall below $2,500 might turn sentiment negative and lead to $2,300.
ETHUST.P trade ideas
ETH/USDT Technical Overview – June 14, 2025📝 ETH/USDT Technical Overview – June 14, 2025
Timeframe: 1D (Daily)
Exchange: Bybit Spot
Current Price: $2,538.97
Daily Change: -1.55%
🔍 Market Structure Overview:
Primary Trend: Still bearish on the macro (lower highs from November to April).
Change of Character (CHoCH): Detected around mid-April → first signal of bullish intent.
Short-term Trend: Bullish structure formed from April to early June (marked "UP TREND").
Recent Break: Price has broken the bullish trendline and is currently pulling back.
🧠 Smart Money Concepts:
Fair Value Gap (FVG):
Noted below the current price zone – acting as a potential draw for liquidity. Price may fill this imbalance before deciding on further direction.
CHoCH Confirmation:
The change in character initiated a shift, but without a BOS (Break of Structure) above $3,034, macro bearish bias remains intact.
🛠️ Key Levels:
Type Price ($) Notes
Resistance 3,034.26 Key swing high, trendline confluence
Support 2,397.35 Minor support
Support 2,313.92 Local liquidity zone
Support 2,200–2,104 Strong demand zone + FVG area
Support 1,537.55 Major historical support
🔮 Potential Scenarios:
📉 Bearish Scenario:
Continuation of rejection from downtrend resistance.
Pullback into the FVG around $2,200–$2,100.
Potential bullish reaction from there.
If broken, next major support lies around $1,537.55.
📈 Bullish Scenario:
Support holds at $2,313–$2,200, bounce begins.
Break and close above $2,800–$3,034 would confirm a macro trend shift.
⚠️ Bias Today:
Neutral to Bearish
Until we see a strong bullish reaction from the FVG or a reclaim of the trendline, pressure remains to the downside.

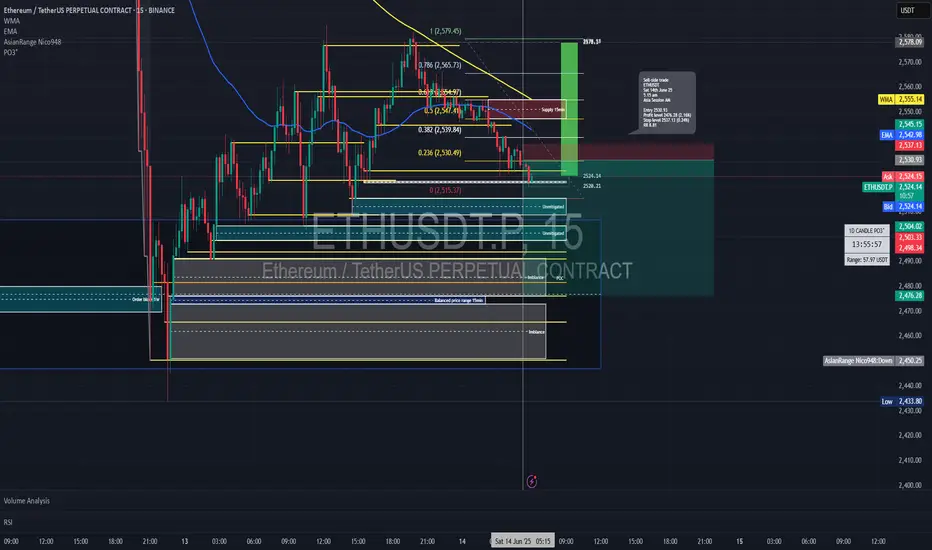
Short trade Sell-side trade
ETHUSDT
Sat 14th June 25
5.15 am
Asia Session AM
Entry 15min TF
Entry 2530.93
Profit level 2476.28 (2.16%)
Stop level 2537.13 (0.24%)
RR 8.81
Sell-side trade idea narrative based on the ICT seek and destroy indicator, taking session liquidity into account for directional bias, along with unmitigated price zones and imbalanced price ranges for confluence.
ETH - AnalysisEvery time Ethereum has broken through $2,800,
it triggered a massive move.
Over the past two years, this level has acted as key support or resistance 7 times.
Once we break through and get a clean, sustained close above, the next major rally is likely to follow.
Keep a close eye on this price level — it will be the turning point.
LFG

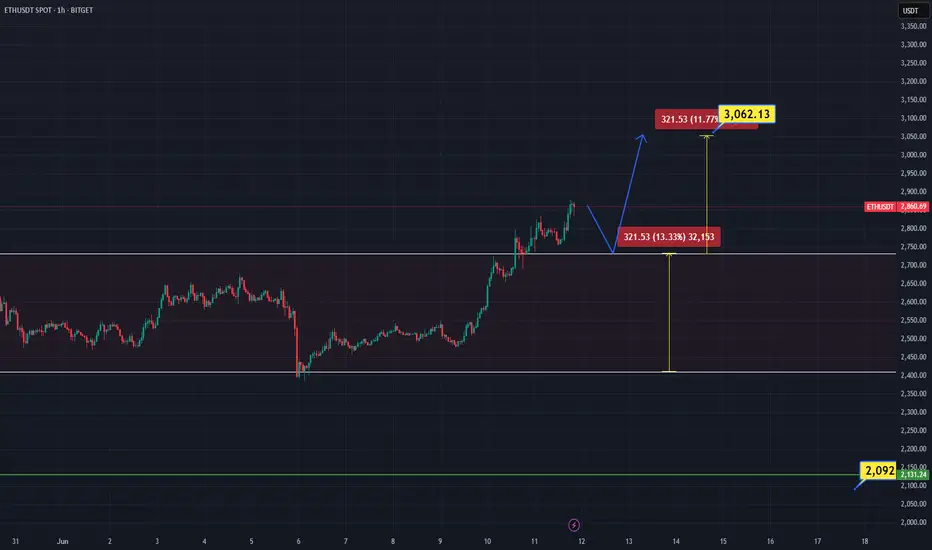
Eth longSimple idea here, if BTC gets stuck between the weekly range, then maybe ETH gets some traction.
There hasn't been a meaningful pullback since the last move up so we may see that move down soon or we follow BTC and move straight up fairly quickly after a shallow move down to sweep the lows
That whats I'm illustrating here, small sweep of the recent lows and then a move up to previous highs
Ethereum (ETH/USDT) Breakout Watch ! Hello traders here is KingPro's analysis on Ethereum
📈ETH is at the critical resistance level strong closing above it could tiger a bullish move.
Current Price: $2,628
EMA 70 Support: Price is holding above the 70-period EMA ($2,577), showing bullish structure.
Support Zone: The area around $2,320–$2,400 is acting as a strong historical support, confirmed multiple times.
Supply Zone: Consolidation occurred near $2,570–$2,620, but price has broken above it — indicating accumulation.
Critical Resistance Area: Around $2,780–$2,800. This is a key level — a breakout above could lead to strong bullish continuation.
Next Target: $2,782.93 – price may retest this resistance as indicated by the projection arrow.
📊 Trade Idea:
If ETH sustains above $2,620 and breaks the short-term channel resistance, a move toward $2,782+ is likely.
🔒 Risk: A breakdown below the EMA or the supply zone (~$2,570) could invalidate the setup.

ETH 3D – Between Panic and Balance
When panic hits, zoom out and try to find balance.
ETHUSDT on the 3D timeframe just had its strongest rejection from the 200MA in this rejection series that started on May 13—exactly one month ago.
Price is now once again retesting the 0.5 Fib, continuing the same retesting pattern that began on May 13.
Touching the 200MA often triggers profit-taking from traders.
On the macro side, recent events are causing panic and prompting sell-offs.
Now let’s see if hitting the 0.5 Fib will bring buyers back in.
Looking at the volume bars from the past month, buying volume is increasing while selling volume is declining . This could suggest that in this choppy range, sellers are stepping back while buyers are starting to build strength.
MLR = SMA = BB center, confirming the current sideways environment.
The 50MA hasn’t even started to flatten—it’s still pointing down.
Always take profits and manage risk.
Interaction is welcome.

ETHUSDTIt will go to 2000 FVG after consolidating I might go back to 3000.
It probably will not come to 1600. More likely Go to 3000.
ETH - ReTestETH - Break out + ReTest
ETH broken out and Re Testing the previous resistance. Hopefully resistance becomes support!
Up only from here!
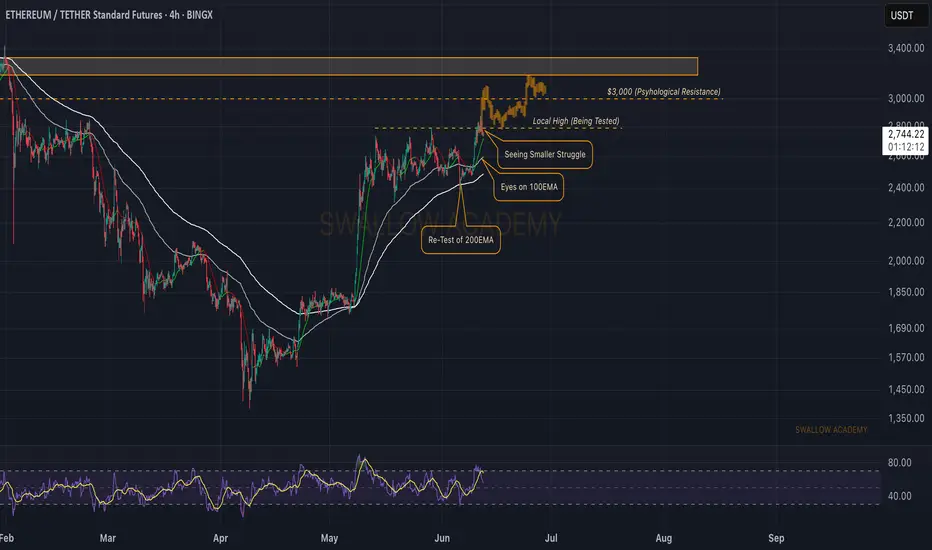
Ethereum (ETH): Important Zone | $3000 IncomingThere are lots of uncertainties near the current area where both buyers and sellers are fighting over dominance near the current zone, as this will determine if we will bounce from here towards our upper targets (above $3000) or if we will retest the first 100 EMA before seeing another bullish movement.
The key zone is the $3000 area, which we have marked as psychological resistance. One way or another, we should reach this zone!
Swallow Academy
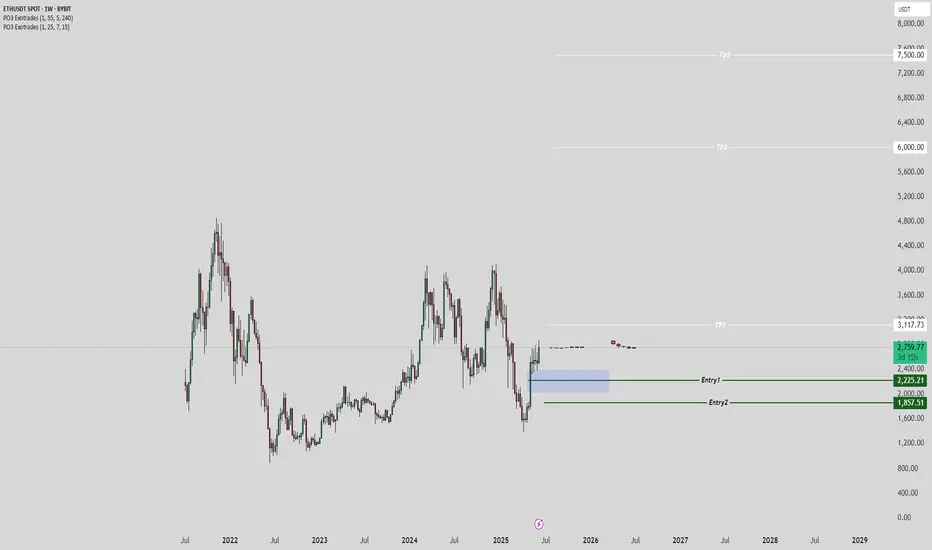
Ethereum's Road to $7500 – Strategic Entries & Profit Optimizati🔵 Entry Zone: My first position is placed at $2225.5, aligning with a strong support level, while a secondary entry at $1857.5 serves as an additional safeguard against unexpected market swings—lowering my average purchase price and protecting capital.
💰 Profit-Taking Strategy: For low-risk traders, securing a 40% profit from the first entry is a prudent move to lock in gains early. However, my long-term target remains ambitious.
🚀 Main Target: Based on valuation models and fundamental news, Ethereum’s upside potential points toward $7500. However, I personally plan to secure 90% of my holdings at $6000, ensuring strong profit realization while leaving room for further upside.
This setup balances risk management, smart positioning, and strategic profit optimization. Let’s see how ETH’s trajectory unfolds!
Entry1: 2225.5
Entry 2: 1857.5
If your second entry is successful, you are required to withdraw 50 to 70 percent of your capital to maintain your capital. I will definitely update this setup.
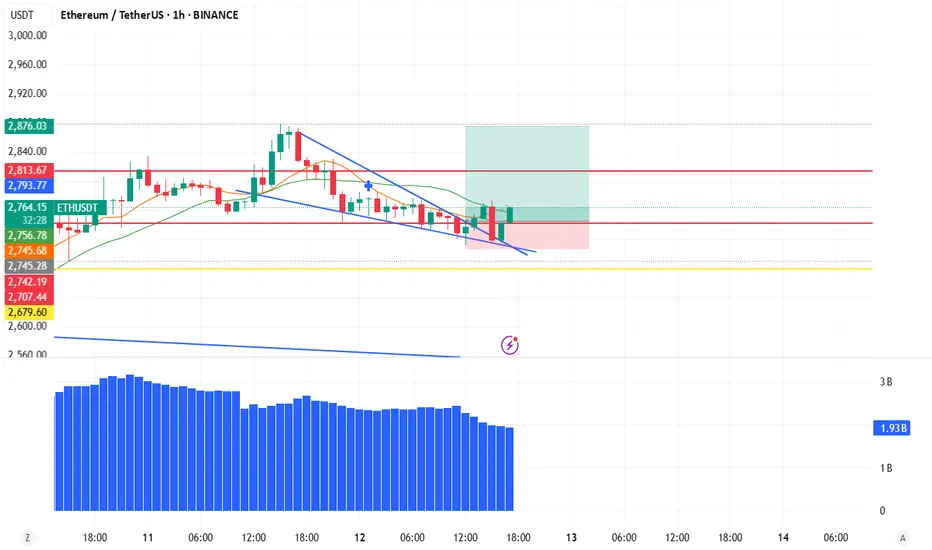
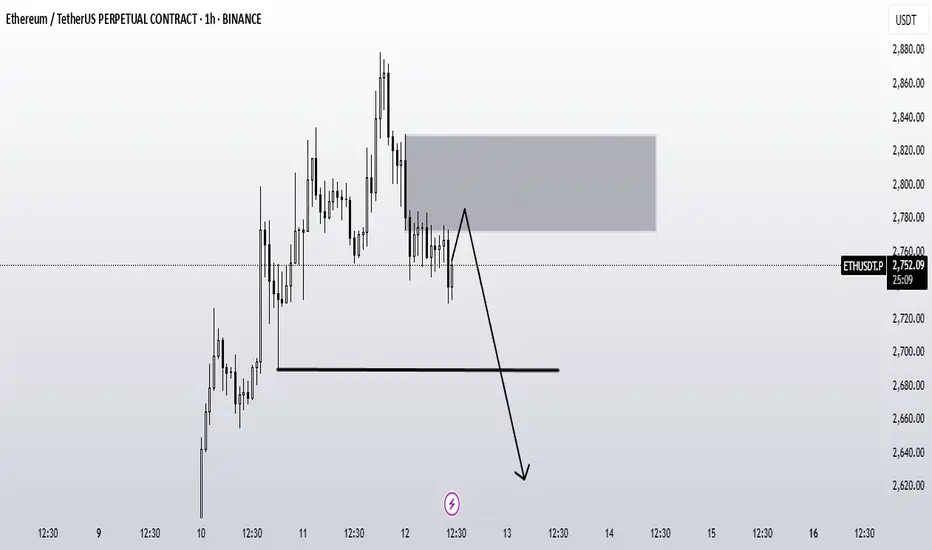
ETHUSDT.P H1 : Short-Term CorrectionBy analyzing the 1-hour timeframe, we can see that the price may drop from the 2780–2820 zone down to 2600
ETH 4HETH managed to pass the box it was moving horizontally upwards and is expected to rise as much as the box size. I expect it to move as I indicated with the arrow sign on the chart.
Posible short scalp im seeing on eth Previous High SSL been taken im seeing simple standard deviation on 1HTF
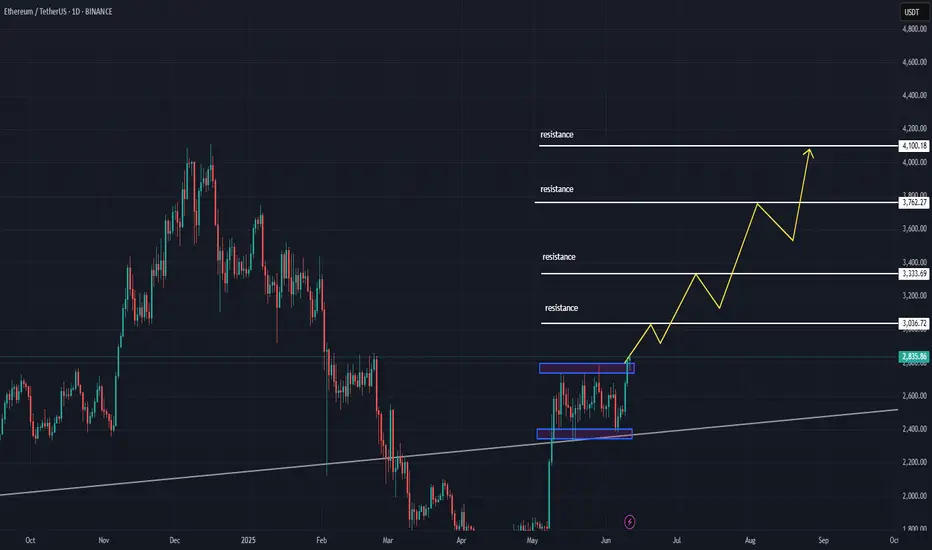
ETH Bullish Setup: Pullback to 200_SMA(D) May Launch Next Rally Ethereum ( BINANCE:ETHUSDT ) seems to have finally managed to break the Resistance lines and the 200_SMA(Daily) in the fifth attack . However, the number of Resistance lines inside the Heavy Resistance zone($2,929_$2,652) is high, and Ethereum will find it difficult to break through them.
In terms of Elliott Wave theory , it seems that Ethereum is completing microwave 4 , and we should wait for this wave to complete. Microwave 4 could act as a pullback to the resistance lines and 200_SMA(Daily) .
I expect Ethereum to start rising from the Support zone($2,745_$2,650) again and rise to at least the Potential Reversal Zone(PRZ) .
Note: If Ethereum touches $2,537 , we can expect further declines.
Please respect each other's ideas and express them politely if you agree or disagree.
Ethereum Analyze (ETHUSDT), 1-hour time frame.
Be sure to follow the updated ideas.
Do not forget to put a Stop loss for your positions (For every position you want to open).
Please follow your strategy and updates; this is just my Idea, and I will gladly see your ideas in this post.
Please do not forget the ✅' like '✅ button 🙏😊 & Share it with your friends; thanks, and Trade safe.

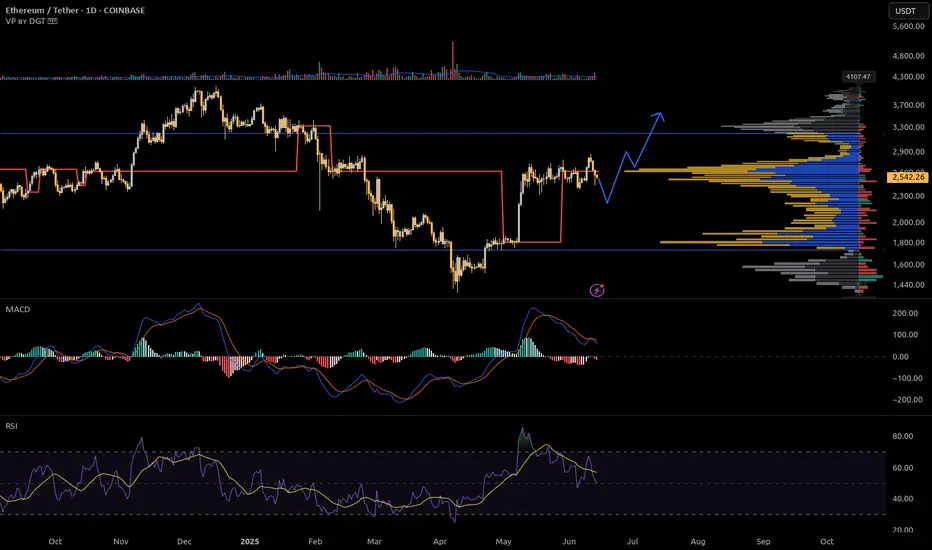
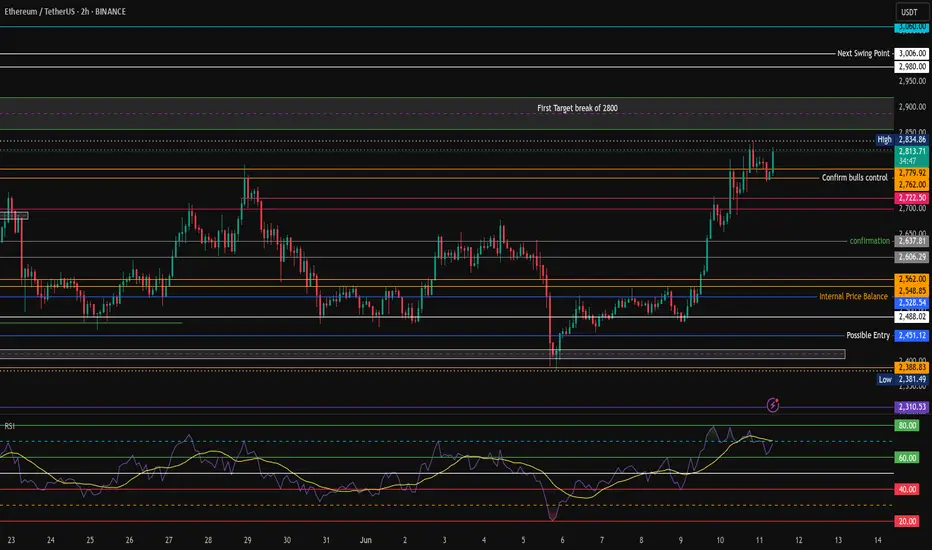
ETHUSD – Strong Bullish Signals on Daily ChartETHUSD – Strong Bullish Signals on Daily Chart
Ethereum is showing renewed bullish momentum on the daily chart after rebounding strongly from the $2,700 support zone and breaking into the key resistance area at $2,835–$2,845. This breakout confirms buyer strength and opens the door for a continued move higher.
The MACD has made a bullish crossover, signaling a shift in momentum.
RSI is climbing above 55, indicating increasing buying pressure with room to run before overbought territory.
A golden cross has formed on the daily chart (50-day MA crossing above 200-day MA), supporting the bullish outlook.
Volume is picking up on green candles, suggesting strength behind the move.
Key Levels:
Support: $2,700
A daily close above $2,845 with strong volume would confirm bullish continuation and open the path toward $2,920, then $3,030 and beyond.
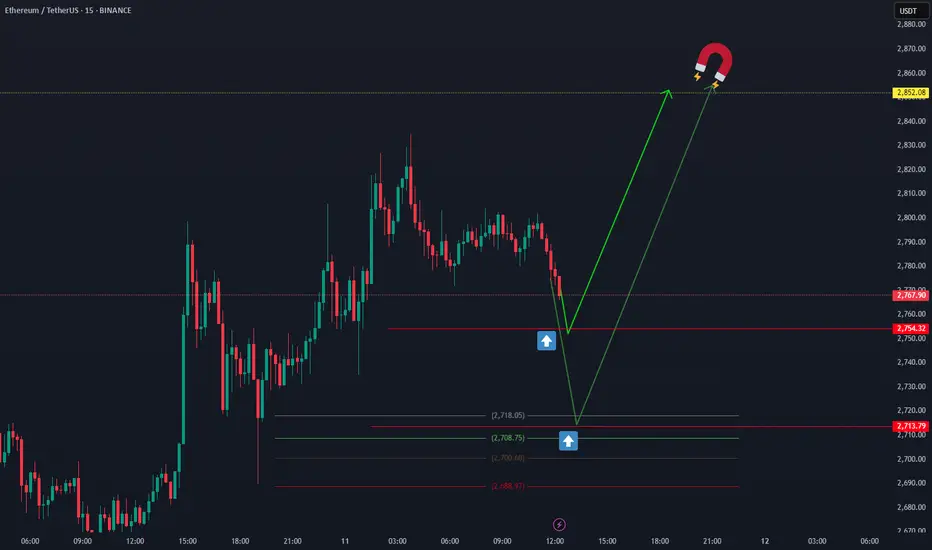
ETHUSDTEthereum could move from these two price areas to 2852.08,
It seems like a definite move at that price. BINANCE:ETHUSDT
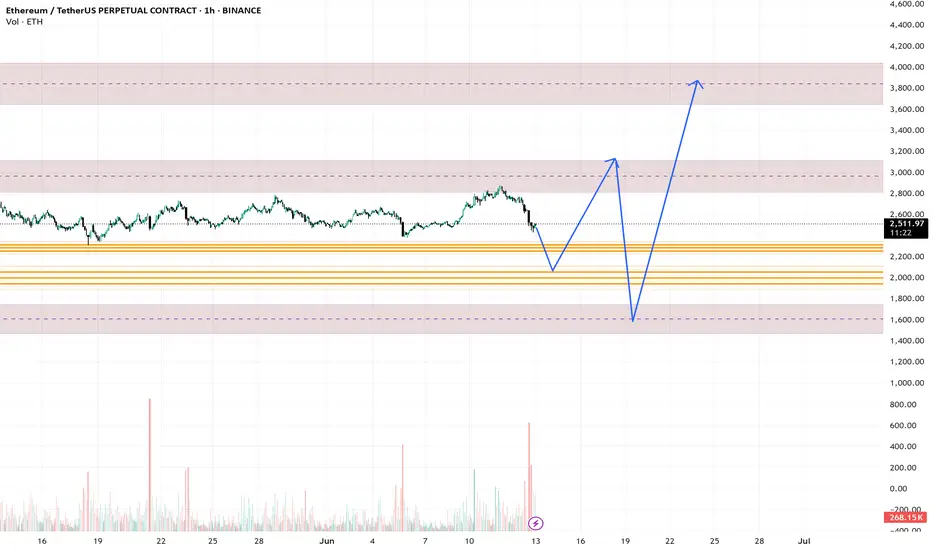
Bad Time Over for ETH? Second Wave Toward $4,000 Incoming!!🟢 Bad Time Over for ETH? Second Wave Toward $4,000 Incoming
MARKETSCOM:ETHEREUM ( CRYPTOCAP:ETH ) appears to be leaving its consolidation phase behind, and all signs point to a fresh bullish wave. After outperforming Bitcoin in recent days, CRYPTOCAP:ETH has now broken out of a key structure — signaling the potential start of a major uptrend.
We’re also witnessing rising CRYPTOCAP:ETH inflows, suggesting growing investor confidence. This kind of accumulation behavior has historically led to significant rallies. Previously, ETH consolidated between $1700–$1800 before a strong move up. More recently, it ranged between $2400–$2700, and now that it’s broken out, we’re anticipating another powerful leg — possibly the second wave of this trend.
If the current momentum continues, a move toward $4000 looks likely, and with enough strength, even a new all-time high isn’t off the table.
BINANCE:ETHUSDT Currently trading at $2795
Buy level : Above $2750
Stop loss : Below $2305
Target : $4000
Max leverage 3x
Always keep stop loss
Follow Our Tradingview Account for More Technical Analysis Updates, | Like, Share and Comment Your thoughts

ETHUSD FAV CRYPTOChart is More Detail in description. Road to ATH.
Crypto Adoption being done Globally
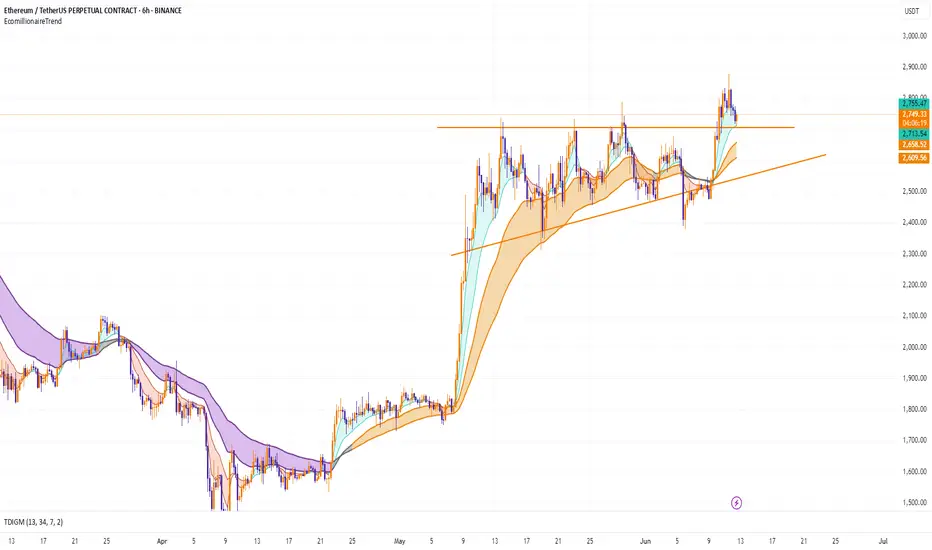
HolderStat┆ETHUSD move in accumulation zoneHolding CRYPTOCAP:ETH in the range of 2,520 - 2,750 formed an accumulation zone. Breakout of this range gives an opportunity for growth of 3,000+

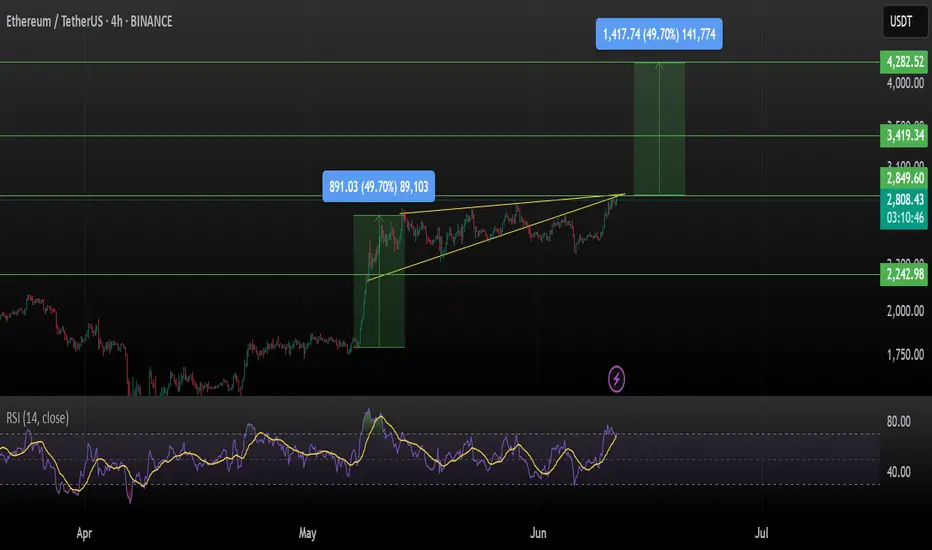
Ethereum (ETH/USDT) – Ascending Triangle Breakout Incoming?ETH is pressing against the upper resistance of a long-forming ascending triangle on the 4H chart — historically a bullish continuation pattern.
Previous Move:
Last breakout saw a +49.7% move, and the structure suggests we could see a similar surge again!
Key Levels:
Support: $2,242.98
Breakout Zone: $2,850
Resistance/Target 1: $3,419
Major Target 2: $4,282 (+49.7%)
RSI: 70.5 — strong momentum, near overbought but in breakout territory.
Volume seems to be increasing near resistance, a breakout could be imminent.
Potential Upside: +49.7% if triangle breaks cleanly.
Bias: Bullish
Timeframe: 4H
Watch for: Rejection at $2,850 or breakout retest for entry confirmation.
This is not financial advice, please do your research before investing, as we are not responsible for any of your losses or profits.
Please like, share, and comment on this idea if you liked it.
#ETH #Ethereum #ETHUSDT
$ETHUSDT finally ready to break out of weekly range and rally!!!BINANCE:ETHUSDT seems to be ready to break out of its range that has lasted for over a month. So if it properly breaks out from this range and retests the resistance zone which tends to turn to support zone afterwards, it will likely head to the next resistance zone around $4000.
Kindly support this post to help reach other people and do comment your thoughts about the setup.
