ETHUST trade ideas
$ETH Breakout Holding Support, Targeting $4KBITSTAMP:ETHUSD has broken out of its long-term downtrend and is now holding above key support at $2,440–$2,500.
Once strong resistance, this zone has flipped to support after a clean breakout and retest.
#Ethereum could rally toward $4,000 if this level holds a potential 66% upside.
Bullish structure, but always manage your risk.
DYRO, NFA

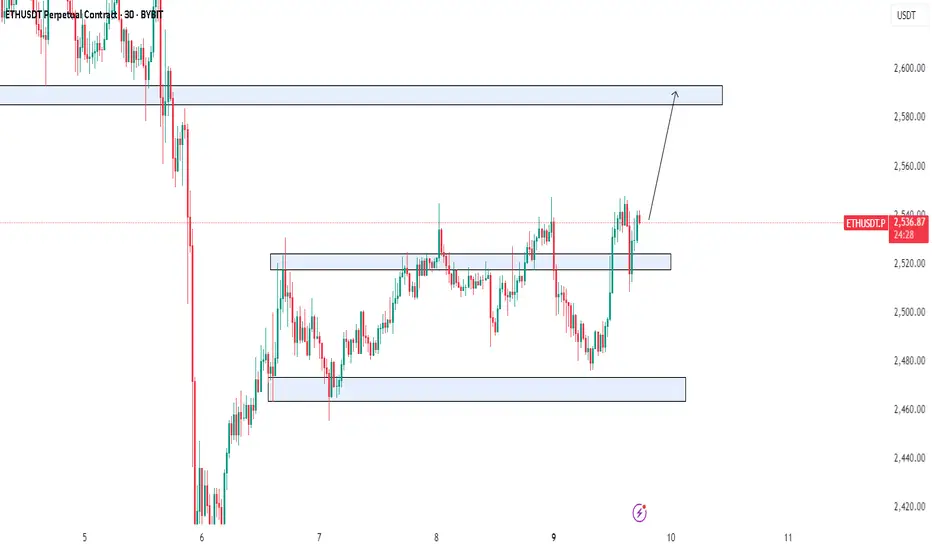
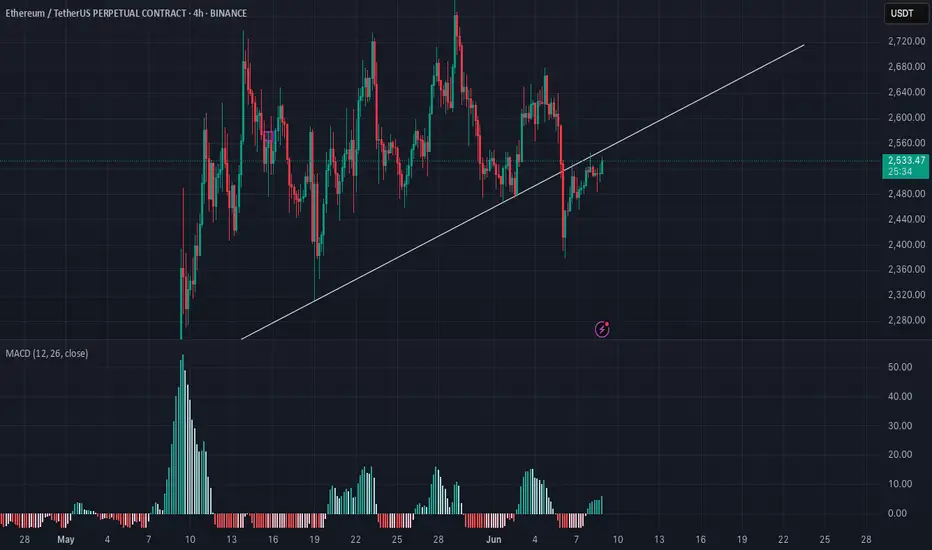
ETH/USDT possible breakout and buy continuationThe price hasn't made any new lows and is showing strong signs of buy trend continuation....since it already made a break and return to the zone its a possibility of a nice late trade.
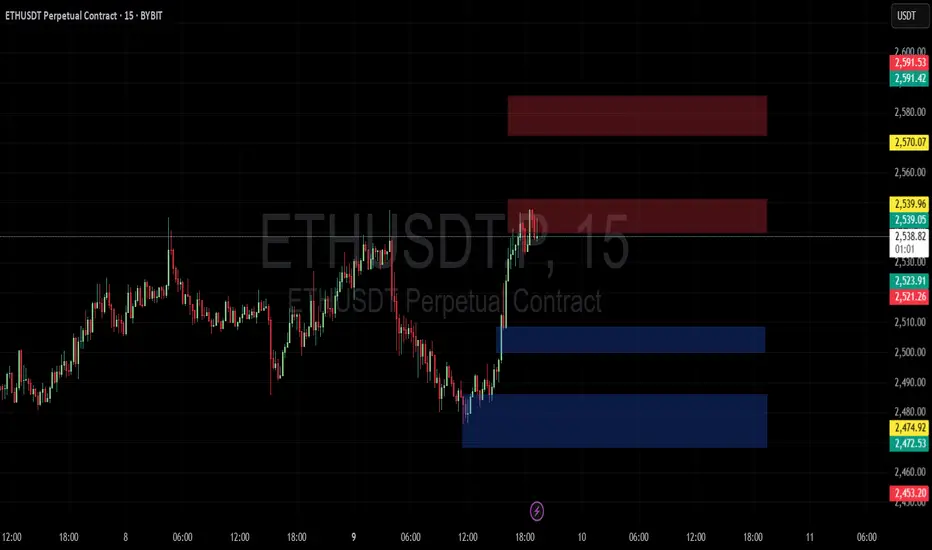
ETH play the boxes (Analyst Crypto Tantrik)📈 Your Strategy Guide: Trade with Confidence! 📉
Ready to elevate your trading? Here's a quick guide to understanding my strategy, designed to help you spot key entry and exit points.
🔵 Blue Zone: Your Bullish Base
* Bullish from blue zone: When the price is in the blue zone, it signals a strong potential for upward movement. Look for buying opportunities here!
* Bearish if breaks out blue zone: If the price falls *below* the blue zone, it indicates a weakening trend. This is your cue to consider bearish positions or exit long trades.
🔴 Red Zone: Your Bearish Barrier
* Bearish from red zone: When the price enters the red zone, it suggests a high probability of downward movement. Prepare for potential selling opportunities.
* Bullish if breaks out red zone: If the price surges *above* the red zone, it's a powerful sign of bullish momentum. This could be an excellent time to enter long positions.
🚀 Key Takeaway: The blue and red zones act as critical support and resistance levels. Understanding how the price interacts with them is key to making informed trading decisions.
Stay disciplined, follow your plan, and happy trading!
HolderStat┆ETHUSD retests 2300 pivotCRYPTOCAP:ETH dips to the 2 300 pivot where Ethereum bulls last ignited upside. Price still hugs an up-sloping guide; reclaiming 2 600 would re-target 2 800-2 900, though the 3 100 sell zone remains the big hurdle overhead.

ETH USDT LONG TRADE SETUPETH/USDT is currently holding at a strong support zone, with a high probability of an upward price move. Additionally, the 200 EMA is providing strong support during the retest.
This is a textbook example of price action on ETH!After trading back above it, the price retreated to the lower band of the range. This is exactly the price action we want to see in order to confirm that the break below the range was a fakeout. This suggests that we will most likely see a real breakout above the range at some point, with much upside potential.
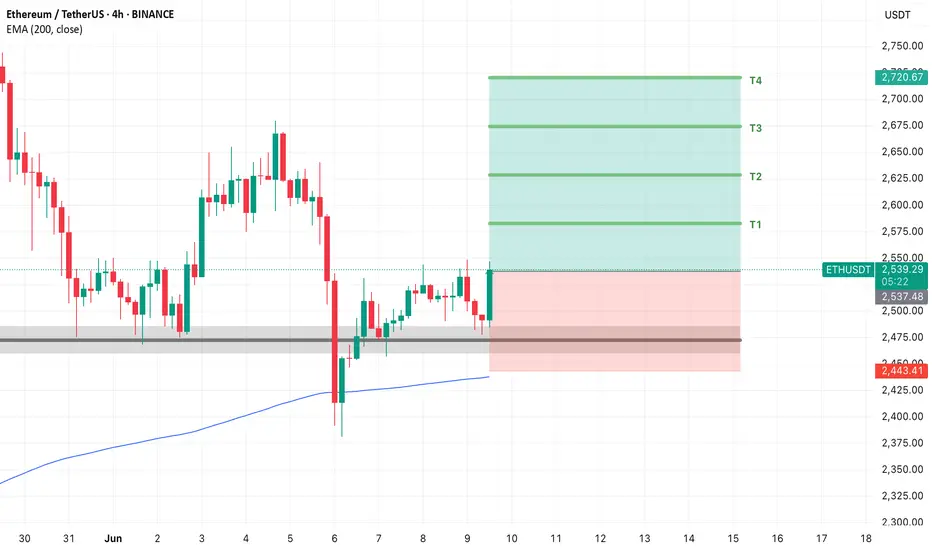
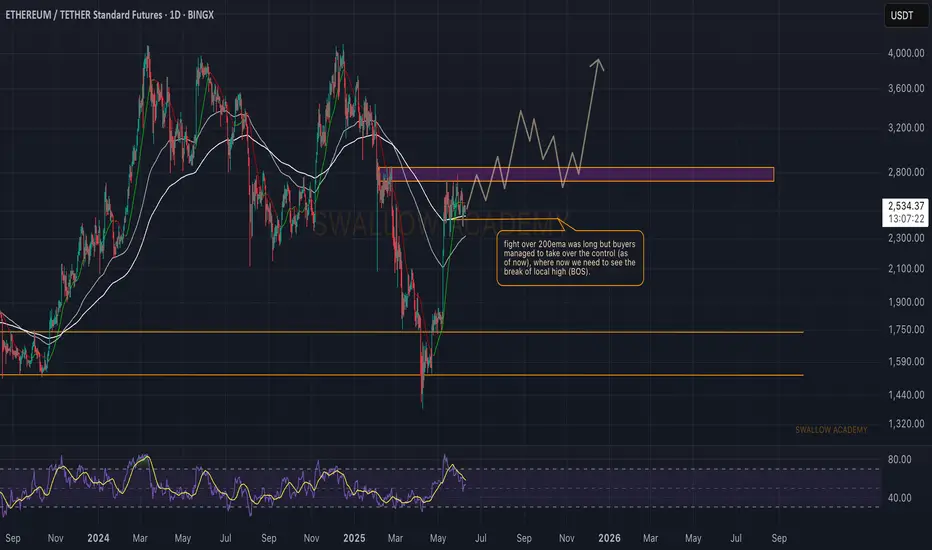
Ethereum (ETH): Fight Over 200EMA | RSI Stable | Bullish AFEthereum is back at 200 EMA, where buyers are not giving the area away so easily, yet sellers still show the pressure. What we noticed was that RSI stabilized here, giving us an opportunity for a proper breakout to happen, which would lead us to our upper targets being reached on a bigger timeframe.
Swallow Academy
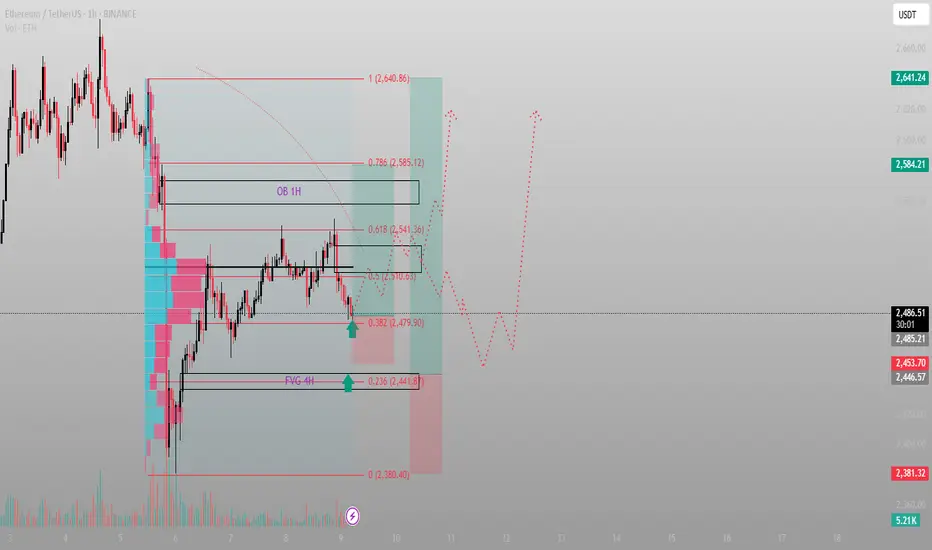
It tapped the level I was watching. Now it’s time to act, not reBINANCE:ETHUSDT just kissed the 0.382 fib at 2479 — and that’s not coincidence. That’s engineered precision. Anyone still waiting for confirmation is late. The confirmation already happened.
Here’s the structure:
4H FVG sits just below, untouched. It’s a magnet — but we may front-run it.
Price reacted from the 0.382, aligning with volume and previous inefficiency.
The 1H OB above (2541–2585) is the first real test. Break it, and we’re looking for 2640+.
This isn’t trend-following. This is manipulation-following. Watch where price shouldn’t go — and then track where it chooses to go.
What I’m watching:
Long is active from the 2479–2441 zone
TP1: 2510 (half-level reclaim)
TP2: 2541–2585 OB sweep
Final target: 2640.86 (EQ of full move)
Invalidation: clean break below 2440 FVG
A level doesn’t need your belief to hold. It needs liquidity.
More setups — real Smart Money reads, not noise — are posted in the profile.
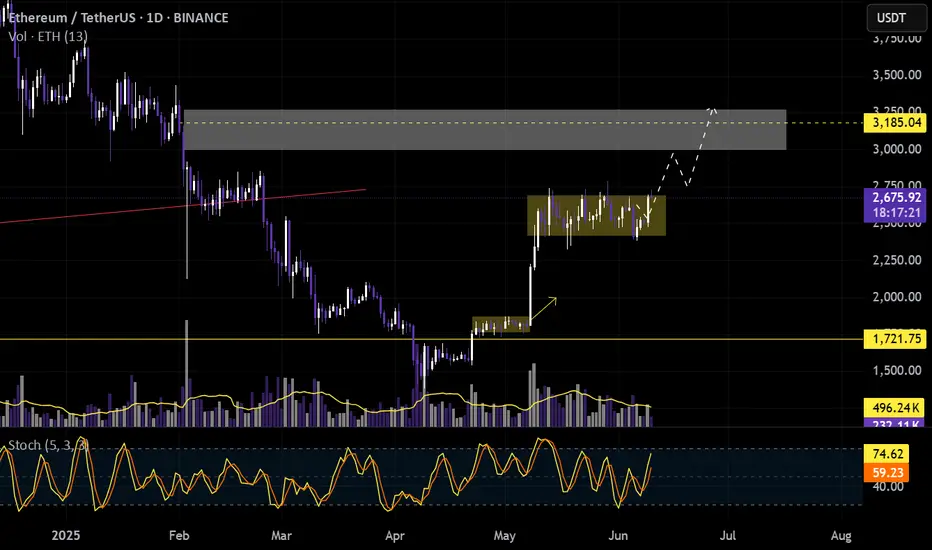
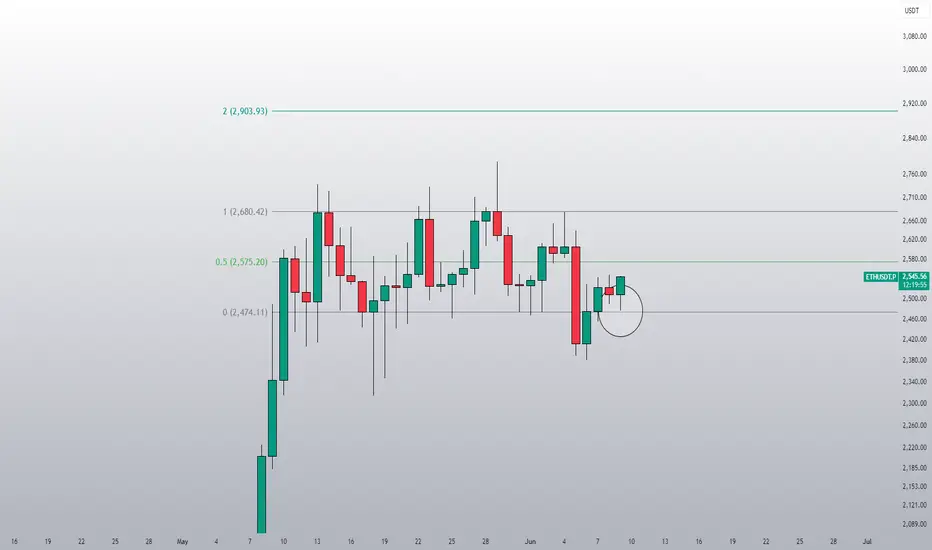
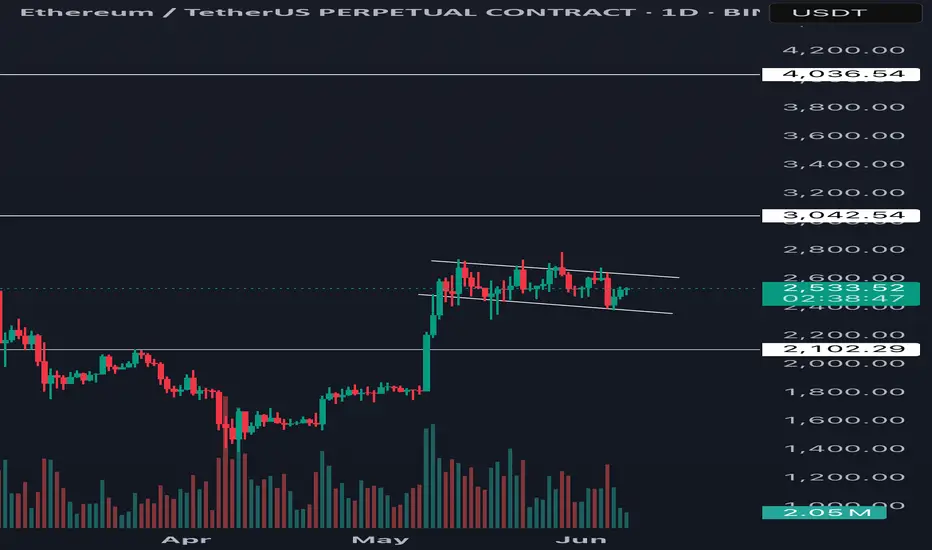
ETH on its way to 3000It’s clear we’re currently trading within a range between 2k and 4k on Ethereum.
Although we deviated below 2k, price reclaimed the range with strength, which is very bullish. Over the past few weeks we’ve been consolidating in what appears to be a bull flag, and I’ve been buying anywhere between mid to lower range.
A breakout seems likely soon, with a potential test of the 3000 resistance level
Long and confident
ETH is testing its resistance ETH may reject from its resistance line as ETH is showing weakness at around $2550 mark level, lets see and if it does it may go down to $2200 level. #ETH #BTC #crypto
ETH Monthly Masterplan – From Frogs to the Moon 🐸 1. Miracle’s Take – The Legendary Leap Begins!
“Yo yo yo! Miracle here – and ETH just jumped outta the swamps straight into the order block jungle! 🐸💥”
We kissed the Order Block Buy zone like it’s the holy ground of memes 📿
3 Buy Levels hit – frogs were loading while normies were panicking 🤡
Price now chilling near the FOMO Zone – and trust me, most are buying now that it's too late
First target: 4,100 💸
Second target: 5,700+ – That’s where meme dreams start getting real!
Ultimate dream: 6,100+ – That’s a 250% leap... Frogs do fly 😤
💣 But yo, don’t ignore that massive Sell Order Block between 4.1K and 5K.
"Miracle Rule: You don't chase green candles – you trap 'em in green nets." 🎣
🟥 If we fall? Warning zone at 1.9K and hell no below 1.3K – STOP LOSS city 🚨
🐸 “ETH isn’t just a coin. It’s the ticket to meme kingdom.”
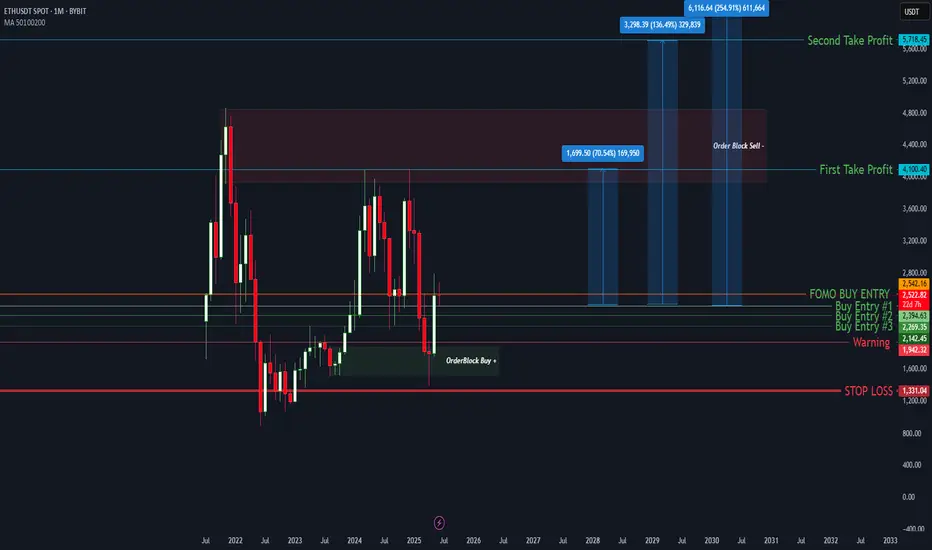
🔍 2. Clean Technical Breakdown – Analyst Mode
ETHUSD Monthly shows a textbook rebound from a long-term demand zone (“Order Block Buy”)
Three strong entry levels respected:
$2,142
$2,269
$2,394
Current price is retesting FOMO zone, last seen as local resistance
First Take Profit: $4,100
Second Take Profit: $5,718
Final fib extension target: $6,116 (254% from lows)
“Price must break and close above $2,750 with volume for confirmation.”
A monthly close below $1,942 is a strong warning
Final invalidation at $1,331, where structure is broken
“Respect the order blocks. Trade the levels.”
🎭 Which side are YOU on this time?
📈 Logical Analysis OR 🐸 Meme Mastery?
💬 Type #TeamMiracle or #TeamAnalyst and let the ETH prophecy unfold!
🎬 @TradeWithMky – where altcoins speak louder than Bitcoin!
#ETHtoMoon #EthereumMonthly #TradeWithMky #AltcoinSeason #MemeAnalysis
ETH/USDT – Short-Term Bearish SetupETH/USDT – Short-Term Bearish Setup
Ethereum is losing momentum near resistance and showing signs of weakness.
I’m entering a short position, targeting $2,481 in the near term.
🔻 Clean structure, strong rejection – watching for continuation.
📉 Follow for more high-conviction setups and sharp entries!
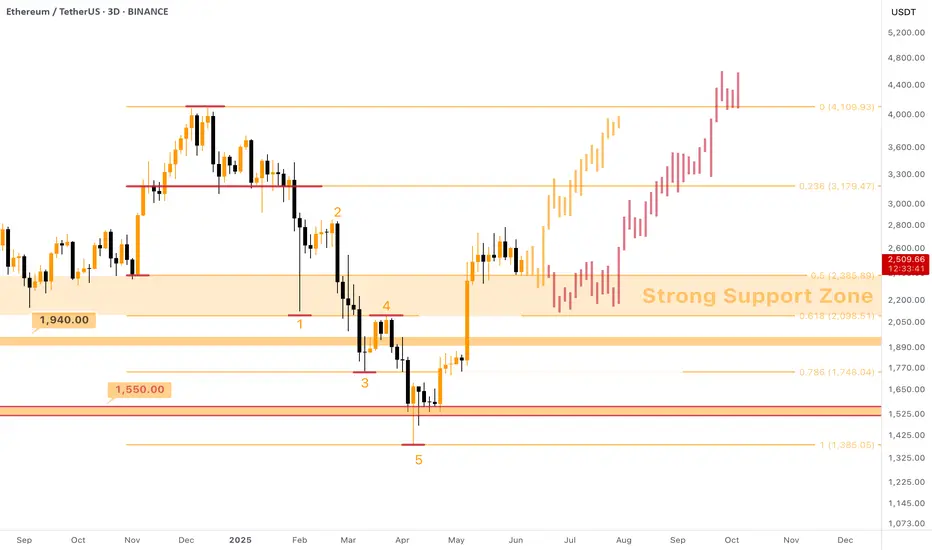
$ETH - New ATH This Year! But it takes time (as usual)I tend to believe the patience pays off
A sharp growth of almost X2 earlier this year granted #Ethereum an opportunity to take hold above major support levels and CRYPTOCAP:ETH gladly took this chance. Now the price is staying above the $2100 - $2400 support zone.
If you are looking for a safe way to X2 your capital this year, you should definitely consider buying Ethereum in this price range.
In fact, there are two possible options of further price movements:
Orange path (~33%) : light touch of the support zone, followed by a sharp pump upwards towards the $3200 resistance by the month of August 2025. Then some consolidation there and continuation with the coming of Autumn (traditionally bullish season for crypto) .
Red path (~66%) : a full-fledged dive in the support zone, down to $2150 (shadows can even reach $1950ish zone) . It will take more time, but allow people to build more proper positions, if they have not done so already. This dive can also help in gathering liquidity (from liquidating early LONGs with high leverage, everything with lev. higher than x6 will be washed down) that will later be used for pushing the price higher .
As you could understand, I'd prefer the second option , but those who know Ethereum erratic behaviour they just... know. I will start accumulating CRYPTOCAP:ETH once it reaches $2450 and will continue doing it down to $2100 using x5 leverage (if such price will ever be achieved) .
Target is $4500 - $5000. Being realistic here.
ETH PLAYGiven the statue of the market, its fair play for any side at this point of the game.
If ETH breaks down, we could see a major sell off for ALTS - itll be hell.
If it flys up, itll be short lived so take profits imho.
Maybe into BTC?
God Bless.
Long trade
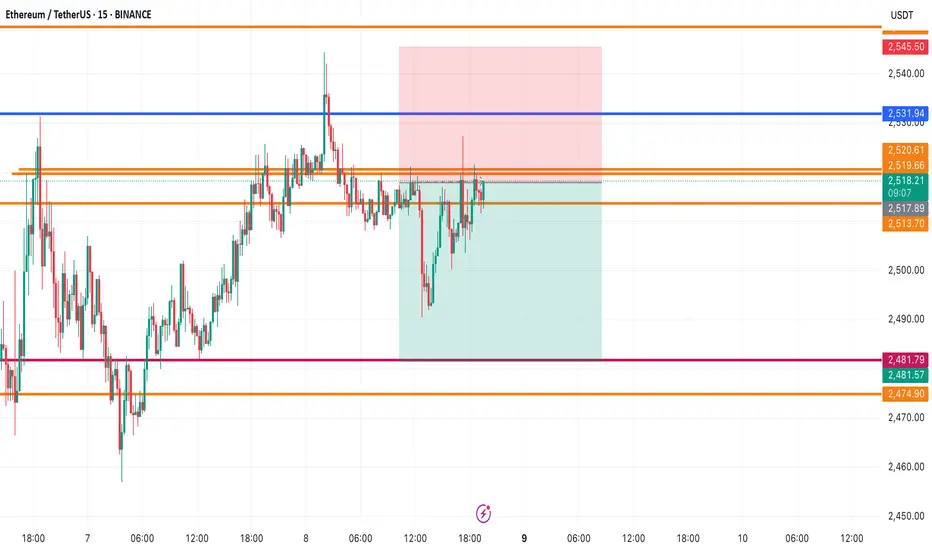
📘 Trade Journal Entry — ETHUSDT (Buyside Trade)
🗓 Date: Saturday, 7th June 2025
⏰ Time: 4:00 PM (NY Time)
📍 Session: NY Session PM
📈 Timeframe: 1-Hour
🎯 Result: ✅ Target hit successfully
🔹 Trade Details:
Entry Price: 2,518.91
Take Profit: 2,561.82 (+1.70%)
Stop Loss: 2,513.19 (−0.23%)
Risk-Reward Ratio: 7.5
🔹 Technical Context:
Entered a strong bullish continuation pattern on the 1Hr timeframe.
Confirmed by confluence of higher lows and demand zone support.

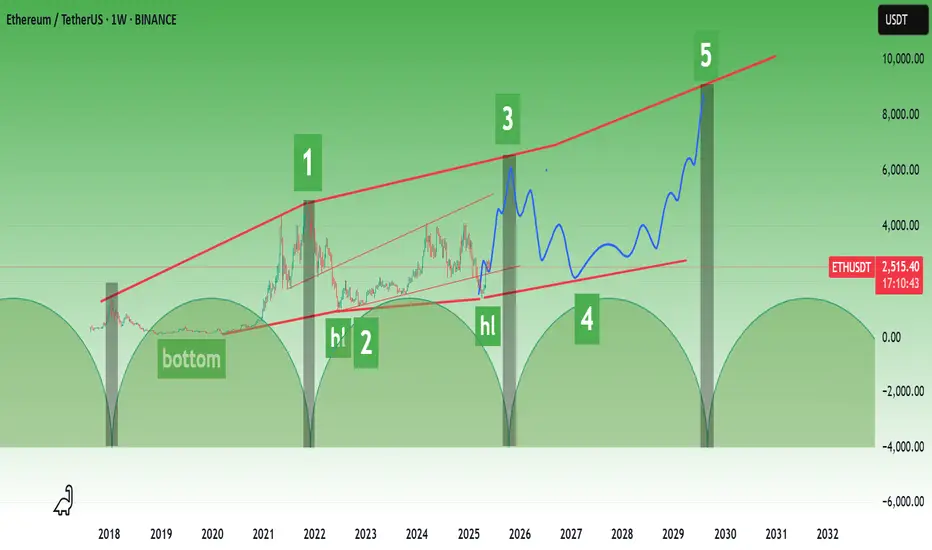
ETHEREUM ROADMAPI tried to predict based on previous time periods and elliot waves.
Please note that my analysis is not short-term. Of course, there may be short-term correction waves in Ethereum.
* The purpose of my graphic drawings is purely educational.
* What i write here is not an investment advice. Please do your own research before investing in any asset.
* Never take my personal opinions as investment advice, you may lose your money.
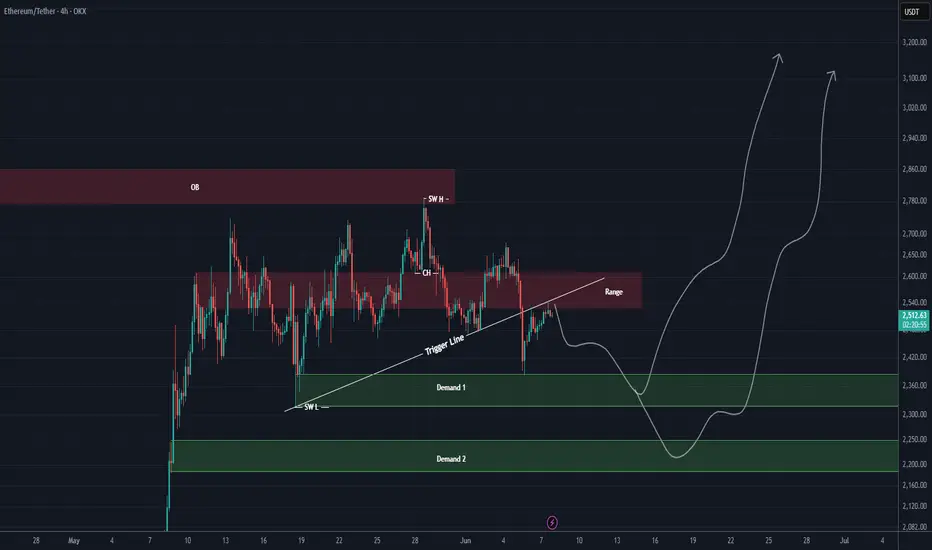
ETH New Update (4H)After being rejected from the higher levels and losing the trigger line, Ethereum now appears to have pulled back into the range zone and the trigger line.
It is expected that the price will be rejected once again from the red zone to the downside, and then turn bullish again from one of the two green zones and move upward.
This is our current outlook on Ethereum. The analysis will be updated accordingly.
Keep in mind that taking short positions in these zones is not low-risk either!
For risk management, please don't forget stop loss and capital management
Comment if you have any questions
Thank You
ETH ShortLiquidity taken above 2530 on 4hour timeframe, looking to take profits at 2379, and 2200 eventually.
Inferring from weekly chart, price would likely hit 2200 before making a move further up - ultimately reaching 4100 long term.
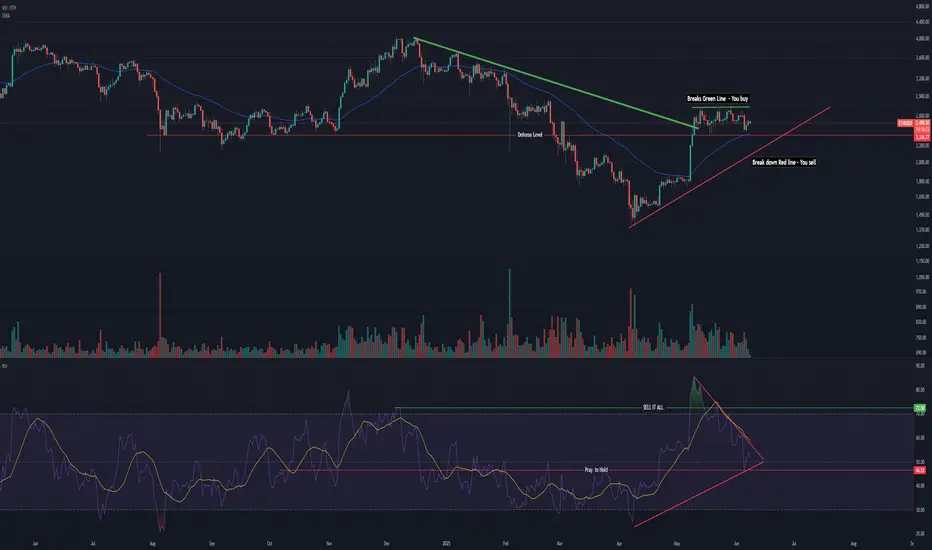
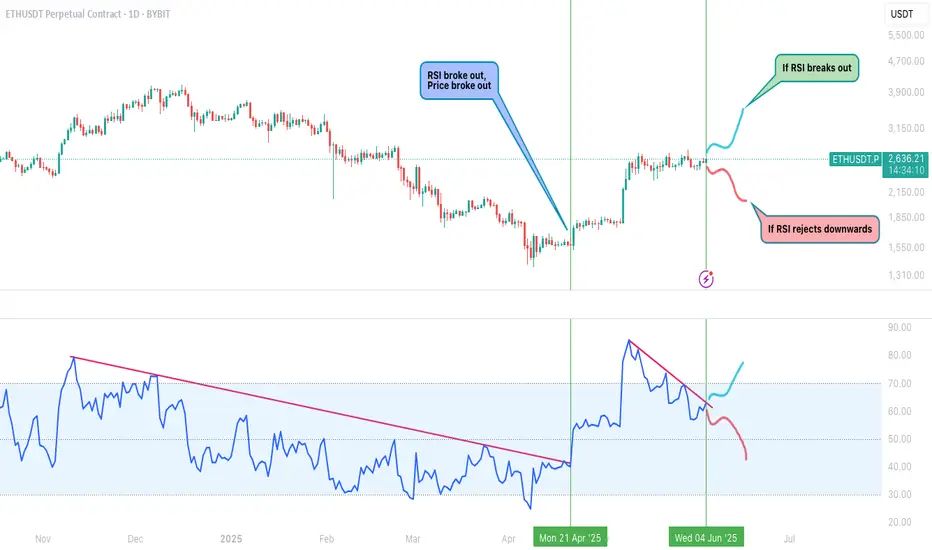
ETHEREUM RSI AT A CRITICAL DECISION POINTCRYPTOCAP:ETH bulls, keep your eyes on this,
We’ve seen this play before:
RSI breakout → Price breakout
That’s exactly what happened back in April — a clean move that led to a strong rally.
Now we’re approaching a similar RSI structure...
Two potential scenarios ahead:
If RSI breaks out upward again, expect ETH to revisit higher zones like $3,150+
If RSI rejects from the trendline, downside toward $1,850–$1,550 isn’t off the table
RSI is often the early signal — use it to anticipate the move before the price confirms.
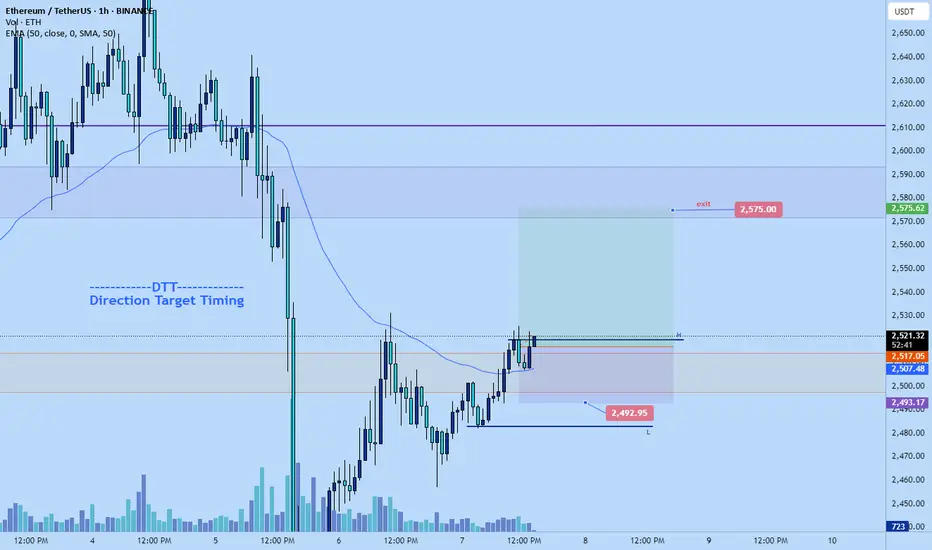
Eth long to $2575Eth long
tp: $2575
Stop: $2492.95 or lower
Roughly 2.5R .. Can use tighter stop if desire to get up RR to 3.
Anticipating smooth push to upside soon. More of a sclap
Time sensitive
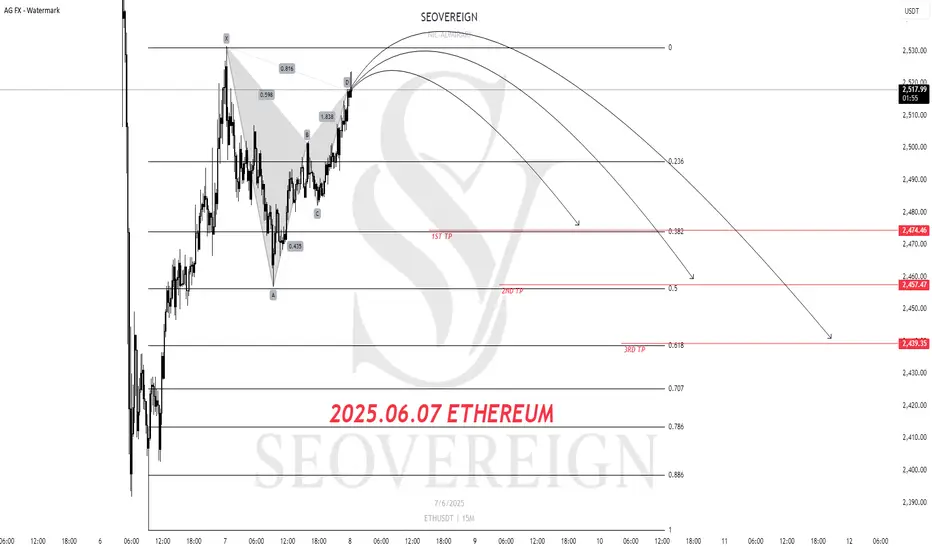
Ethereum Short Position Update – June 7, 2025We are the SeoVereign Trading Team.
With sharp insight and precise analysis, we regularly share trading ideas on Bitcoin and other major assets—always guided by structure, sentiment, and momentum.
🔔 Follow us to never miss a market update.
--------------------------------------------------------------------------------------------------------
Ethereum Short Position Share
Currently, Ethereum is approaching the completion zone of a Gartley pattern.
The Gartley pattern is one of the traditional corrective patterns and often acts as an important price reversal point.
In this pattern, the price is showing resistance near the high and signaling a reversal, indicating a high possibility of a shift into a short-term corrective phase.
Accordingly, a short position is considered with the first target set at $2,476.
This area corresponds to a previous support level and the pattern target, making it a technically significant selling target zone.
It is important to monitor market conditions and volume trends while managing risk simultaneously.