ETHUST trade ideas
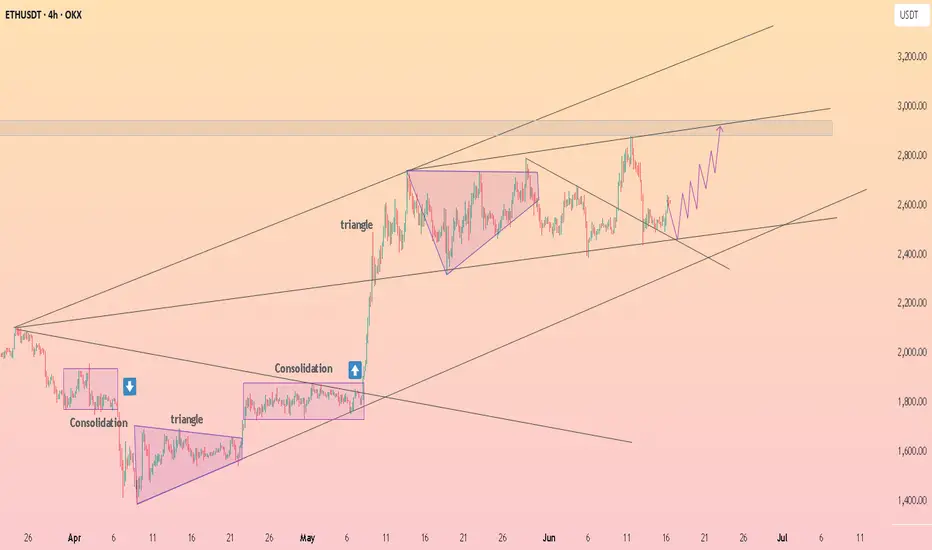
HolderStat┆ETHUSD continues to accumulateOKX:ETHUSDT is catching bids at the 2.50 k rail after triangle retest, converting shakeout into upside continuation. Staying above 2.40 k keeps bias north; clearing 2.75 k releases the 3 k target rocket 🚀
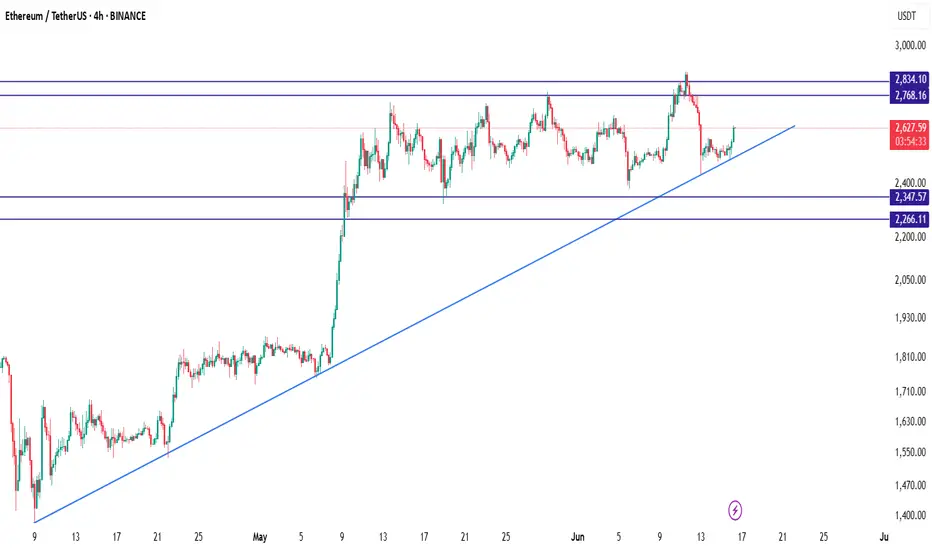
ETH/USDTEthereum (ETH/USDT) is currently maintaining its bullish momentum above a well-respected ascending trendline that has been active since early April. After a strong breakout above the 2347 level, the price entered a consolidation phase between 2600 and 2800, suggesting that the market is preparing for its next significant move. As of now, ETH is trading near 2627 and forming higher lows, which is a positive sign of buyer strength.
The key support zones are located at 2347 and 2266, while resistance levels to watch are 2768 and 2834. As long as the price holds above the ascending trendline, the bullish structure remains intact. A bounce from the current region, especially near the trendline, may present a favorable long opportunity. In such a scenario, a breakout above 2768 could open the path toward 2834 and potentially higher levels in the medium term.
A suitable long setup would involve entering around the 2620–2640 zone with a stop loss below 2347 to protect against trend invalidation. The first profit target can be set at 2768, and the second at 2834. However, traders should remain cautious: if ETH breaks below the trendline with strong bearish volume, the bullish outlook would weaken, and the price may revisit lower supports. Until then, the market structure favors buying the dips in alignment with the prevailing uptrend.
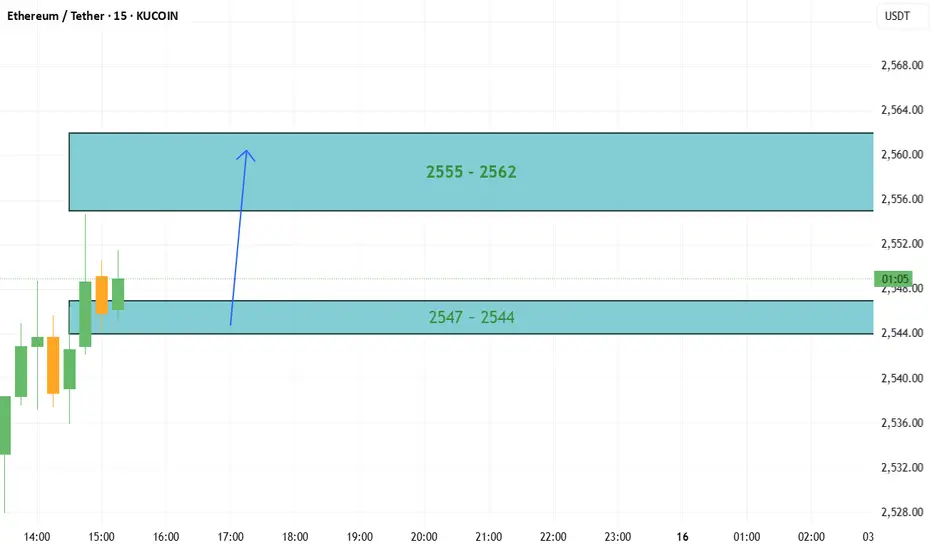
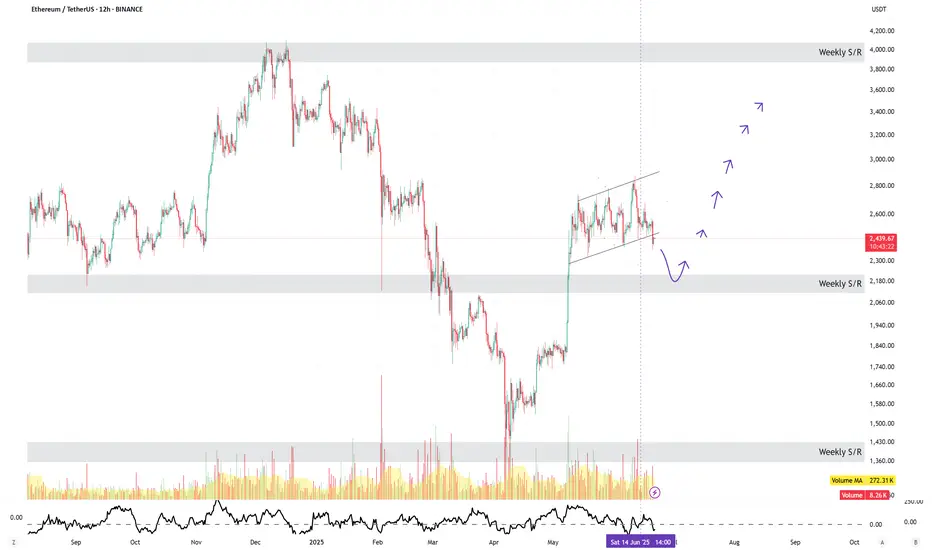
Update on ETHTP hit quicker than expected.
LTF intraday is currently short. Targetting the area where the HTF is more likely than not kicking in for the next leg towards the upside!
Not financial advice.
Onwards!
CRYPTO:ETHUSD
CRYPTO:BTCUSD

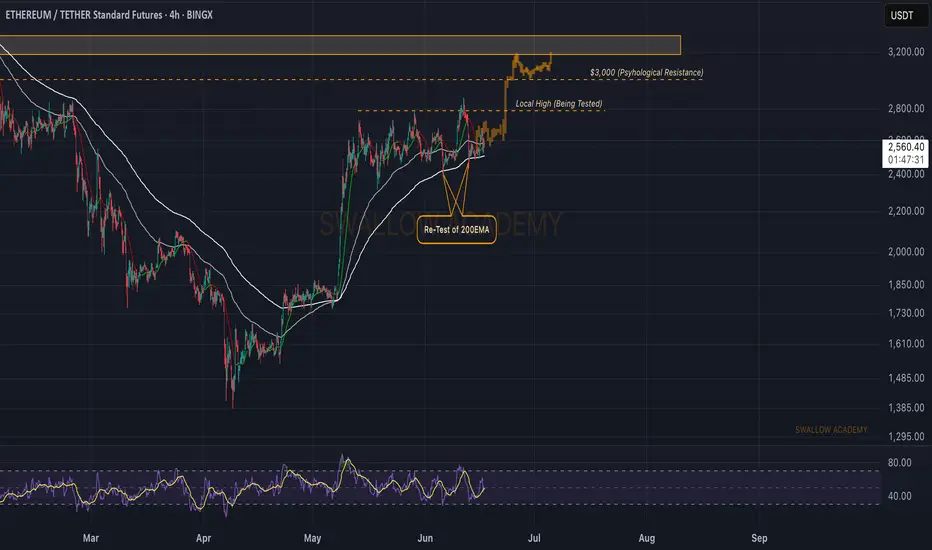
Ethereum (ETH): Stonger Than Bitcoin For SureEthereum is doing much better compared to Bitcoin, that's for sure, but it does not mean that ETH is not struggling.
We see the pressure that sellers are putting on, trying to regain the control over the 200EMA, which is a crucial area for us right now.
So while we keep our target at $3000 (first target), we also keep close attention to that moving average, where if we lose dominance, we might be heading to lows here...
Swallow Academy
ETH - Medium-Term Bulls Confirmed Control!Hello TradingView Family / Fellow Traders. This is Richard, also known as theSignalyst.
📈 As per our previous ETH analysis (shown on the chart), ETH rejected the green support zone and pushed higher, reaching our target near $2,750.
What’s next?
After breaking above the $2,750 structure marked in red, the bulls have confirmed medium-term control.
🏹 As long as the last major low at $2,700 holds, ETH is expected to remain bullish, with a potential move toward the $3,500 resistance zone.
📚 Always follow your trading plan regarding entry, risk management, and trade management.
Good luck!
All Strategies Are Good; If Managed Properly!
~Rich

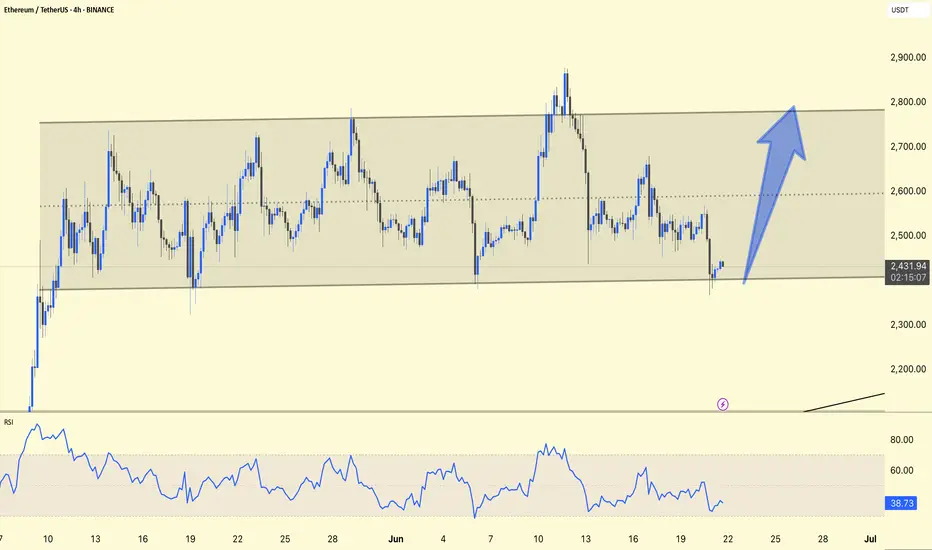
ETH/USDT 4H Technical Analysis UpdateChart Insights:
ETH is holding the lower trendline support (~$2,430), which indicates a potential reversal zone.
The RSI is hovering around 39, which indicates oversold territory, suggesting that buyers may step in soon.
Expected Move:
The chart predicts a strong move upwards towards the $2,800–2,900 zone (blue arrow), which aligns with the top range boundary.
Trade Plan:
Buy Zone: Near the lower trendline ($2,430–2,450)
Stop Loss: Just below the trendline ($2,400)
Target: Near the upper range boundary (~$2,800–2,900)
Stay alert!
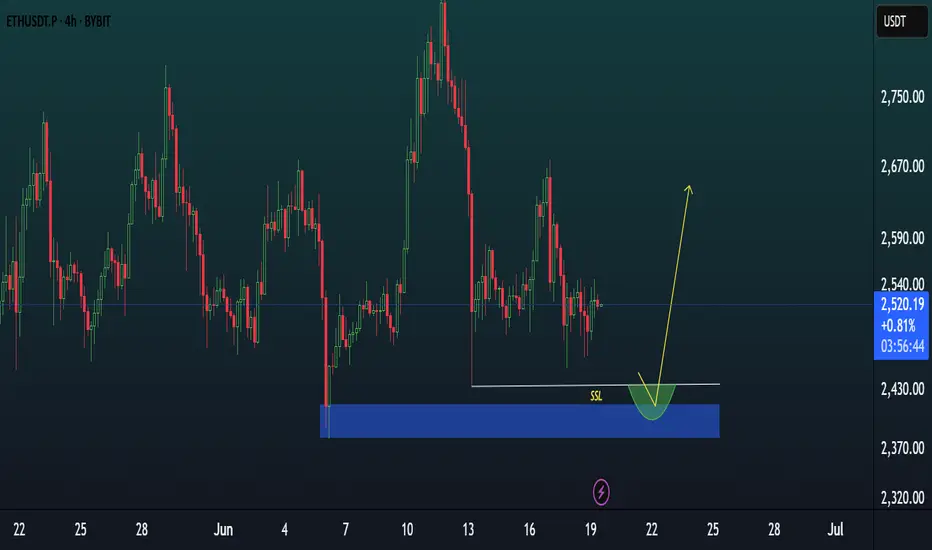
ETH NEXT BUYZONE.ETH has created a wick and below that is a huge liquidity cluster. I want price to fill that liquidity cluster and then upside.
Weekly trading plan for ETH In this idea I marked the important levels for this week and considered a few scenarios of price performance
Write a comment with your coins & hit the like button and I will make an analysis for you
The author's opinion may differ from yours,
Consider your risks.
Wish you successful trades ! mura

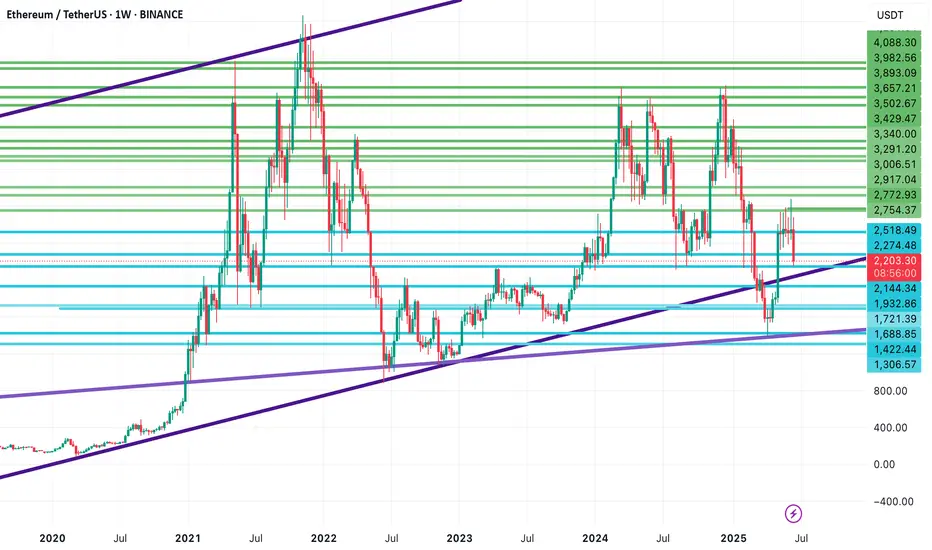
Ethereum at a Critical Support Zone Ethereum Weekly Analysis – Long-Term Perspective
Ethereum is currently experiencing significant bearish pressure and has dropped into a major support zone on the weekly chart. If this critical support breaks, the next key target would be around $2,055, where the price aligns with a long-term ascending trendline, acting as a possible reversal zone.
However, if ETH manages to defend this area and confirms bullish weekly candle closures, we may see a potential recovery toward:
$2,278 as the first resistance
Followed by $2,435 as the next upside target
📌 All support and resistance levels shown in the chart are key decision zones that traders can use for entries, exits, or managing positions.
🧠 Don’t forget to follow for consistent long-term insights and clean technical setups like this.
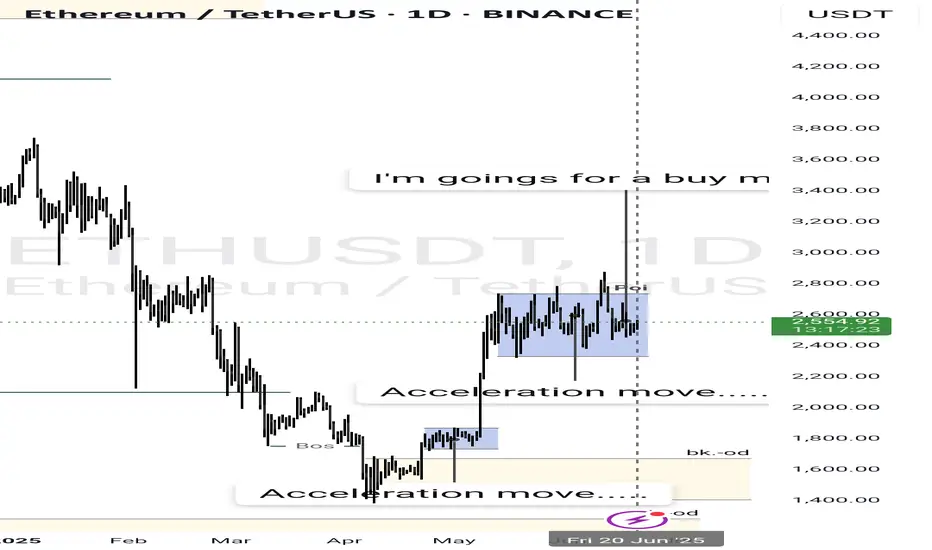
Waiting for a buy move in the btc Seeing all the acceleration move that is happening in the market
I believe is a buy
What do you think is the market movement......
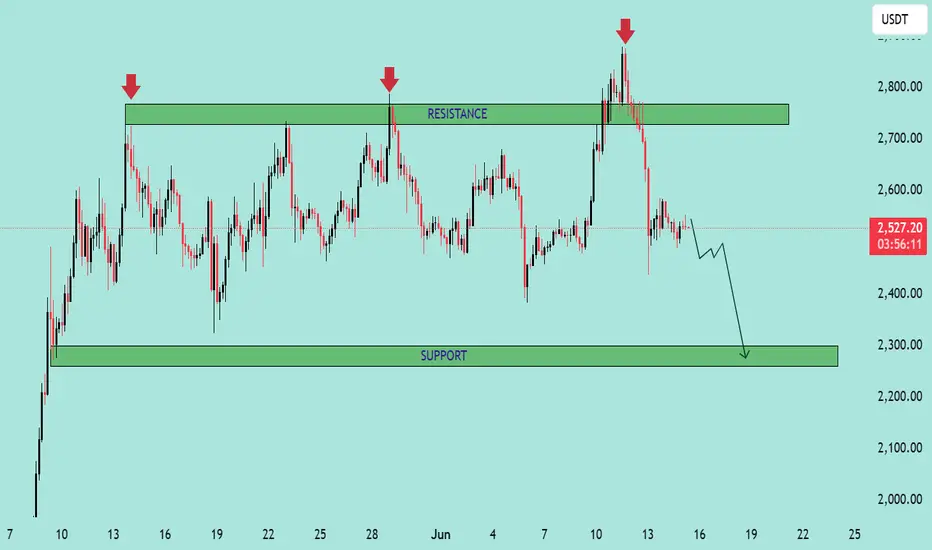
ETH/USDT – Bearish Reversal from Resistance Zone ETH/USDT – Bearish Reversal from Resistance Zone 📉
The chart above clearly illustrates a strong bearish setup on the ETH/USDT pair. Here's a professional breakdown:
📊 Technical Overview:
Resistance Zone (~2750–2850 USDT):
Marked by three distinct rejections (highlighted by red arrows).
Every attempt to break above this zone has resulted in a sharp price rejection, indicating strong selling pressure.
Current Price: 2529.69 USDT
Price has already broken below the immediate support formed after the last rejection.
The pair is now trending lower with bearish momentum.
Support Zone (~2250–2350 USDT):
This is the next major demand zone where previous accumulation took place.
The projection arrow indicates the likely path toward this area.
🔍 Price Action Insights:
Repeated failure to break resistance confirms a triple top pattern, a classic bearish reversal signal.
The recent sharp drop from the top is accompanied by strong bearish candles, showing momentum.
Minor consolidation might occur before continuation downward, as suggested by the zigzag arrow.
📉 Conclusion:
If bearish momentum sustains, ETH/USDT is likely to drop toward the 2,300 USDT support zone. A break below could open the door for even lower levels, while any bounce would need to reclaim the 2,700 USDT level to shift sentiment.
📌 Traders should watch for lower highs and bearish confirmations before entering short positions.
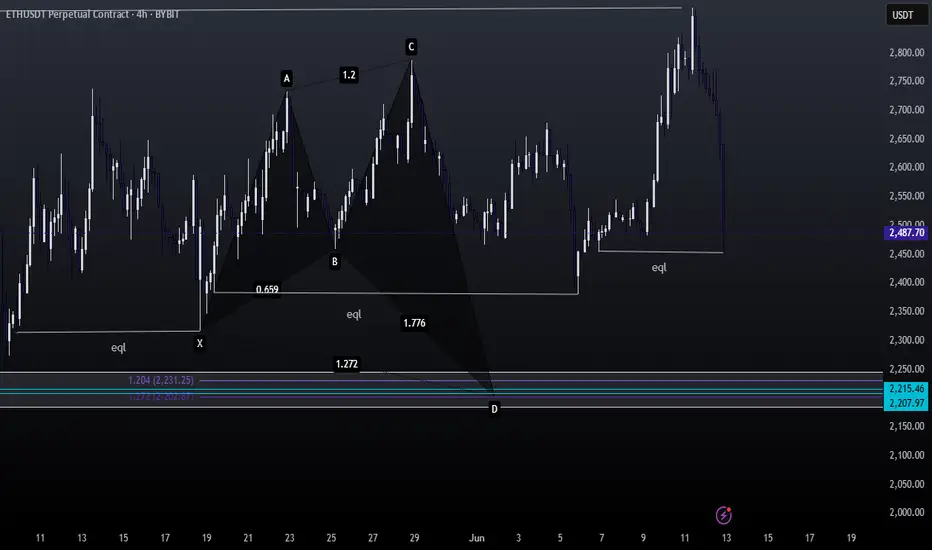
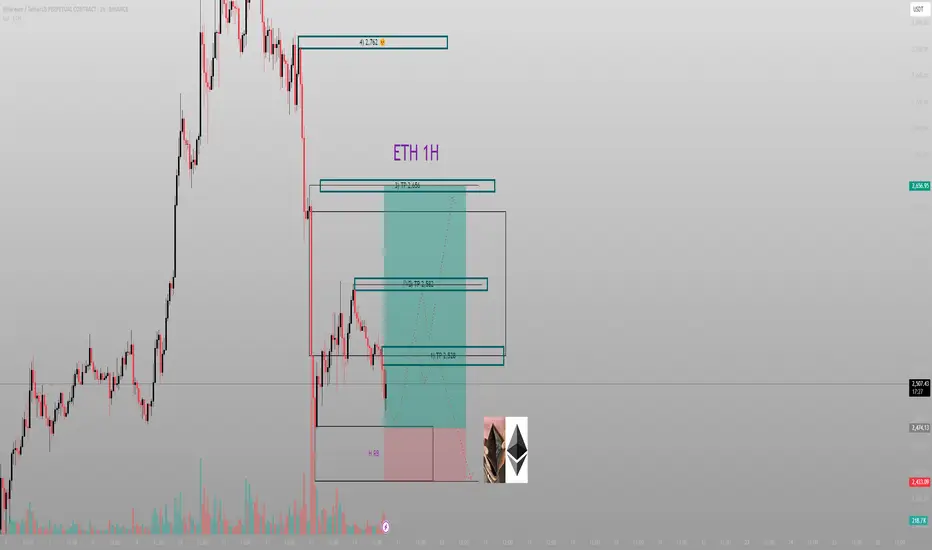
Every breakdown is just a setup — if you know where the reaccumuPrice collapsed. But I didn’t flinch. Because beneath that move sits something most won’t look for: High-Volume Rebalancing (H RB), paired with a clean FVG structure that tells me exactly where Smart Money wants to reload.
The structure:
The breakdown into ~2483 wasn’t just a move — it was intentional. That candle didn’t just fall, it delivered into the H RB zone and paused. Below that? Nothing but inefficient space and a tightly engineered low.
Above? Three clear target zones:
TP1: 2528
TP2 : 2582
TP3: 2656
Final objective: 2762 — the origin of the final collapse
Every leg above is engineered to grab liquidity, rebalance inefficiency, and then clear out the next range. It’s a chain of fulfillment.
The trade:
Entry: 2483–2500 zone
SL: Below the H RB zone (~2470)
TP1: 2528
TP2: 2582
TP3: 2656
Optional extension: 2762
We aren’t buying because it’s “down.” We’re executing because it’s deliberate.
Final thought:
“Collapse isn’t the end. It’s the invitation.”
Let the Market Teach You PatienceEvery red candle has a reason. Every drawdown has a lesson.
In this journey, it's not just about profits, it's about who you become.
As traders, we don’t just manage risk, we grow through it. Let patience, discipline, and humility shape you in silence, just like the markets do.
This is the mindset behind the candles.
#PEACE
ETH READY TO 3000$ ??? YES eth just about his support level eth can test from here 2450 than possible we can go 3k if iran or isreal war stop and at 18 june also here fomc meating where news about rate cut if not rate cut than possible market dump from here and btc or eth badly if rate cut done than also possible dump to liqudite longer for more deatile check bio
thanks for watching
ETH: Bullish Momentum Emerging on the Daily ChartETH: Bullish Momentum Emerging on the Daily Chart
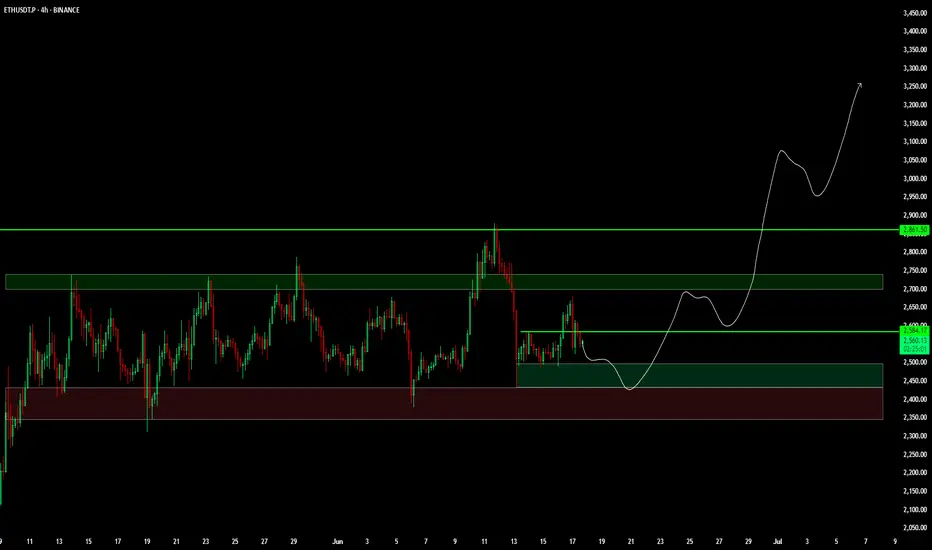
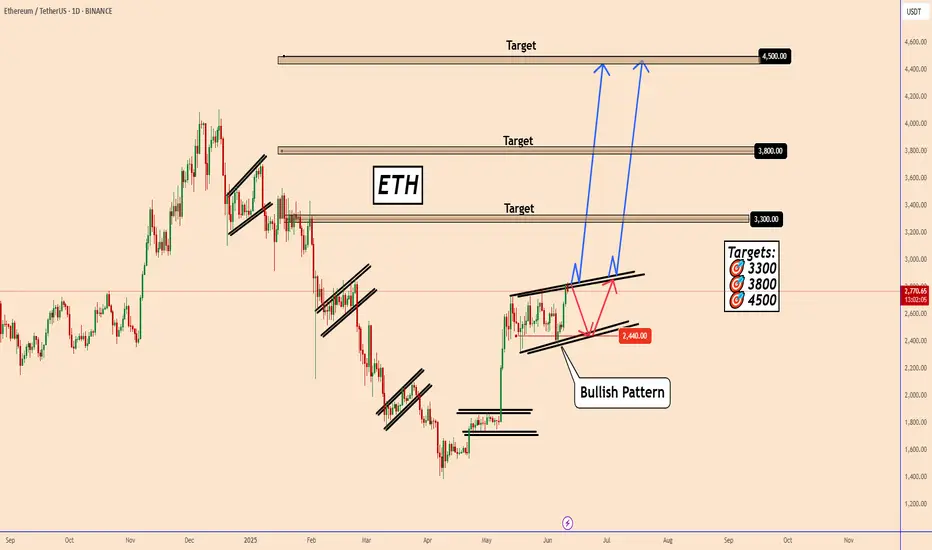
Since May 9, ETH has been consolidating for about a month, forming a bullish pattern. The price continues to fluctuate within the 2330 - 2800 range.
While the pattern appears bullish, it remains unclear whether it has fully completed. Without a decisive breakout accompanied by strong bullish volume, ETH could retreat to 2440, potentially forming a larger structure before resuming its upward move.
The broader outlook still suggests bullish momentum, but the market is not yet ready to initiate the next leg up.
Today's U.S.-China agreement and U.S. CPI data will be key events to watch.
Key Target Zones: 🎯 3300 🎯 3800 🎯
You may find more details in the chart!
Thank you and Good Luck!
❤️PS: Please support with a like or comment if you find this analysis useful for your trading day❤️
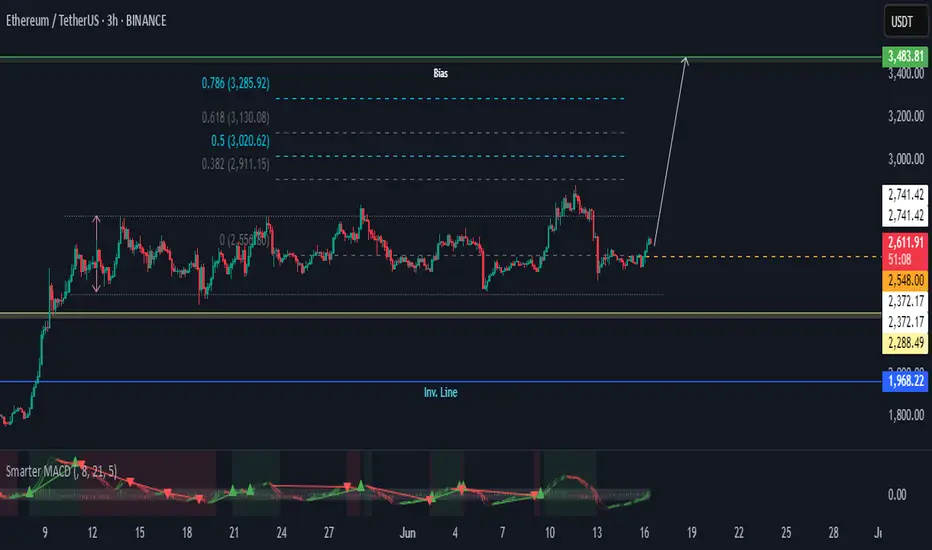
Ethereum TA: Bullish Momentum Signals Potential RallyHi there,
Ethereum shows bullish momentum with a positive MACD crossover while consolidating above key support levels, suggesting potential upward movement.
Ethereum’s price structure is strengthening, and if it clears the 2741.42 resistance, it could trigger a rally toward 3020.62–3285.92.
Happy trading
K.
Not trading advice.
ETH/USD Weekly | The Full Breakdown – Structure, Spring, and Set
This is my full Ethereum weekly chart analysis — not just what I think might happen, but a walk-through of everything I’ve mapped and labelled, based on how price has behaved since the 2021 top.
Every structure you see here is there for a reason — from the symmetrical triangle and wedge, to the Wyckoff schematics, Elliott wave flow, Spring, and more. What we’re seeing now, in my opinion, is the end of a three-year macro compression. The move that follows could define the rest of this cycle.
Let me take you through it.
After the all-time high in late 2021, Ethereum entered a structured, controlled decline. Not a crash — but a step-by-step transition through market phases. Price dropped and bottomed into a clear accumulation phase — that’s the first box on this chart, labelled as “Accumulation (cause)”. This is where smart money started taking positions, confirmed by the Spring down to 0 and the base of the move at point 2. From there, price consolidated, gained strength, and then jumped the creek — a clear breakout above the accumulation range, which gave us the confirmation for markup.
The markup phase took us from that Spring up into a five-wave impulsive move, peaking around the distribution zone. You can see it clearly — labelled Distribution, and boxed off between points A, B, C and the final wave 5. This rally failed to make new all-time highs, stalled, and was rejected cleanly. From there, we rolled over and started losing structure — and this is where it gets important.
Right after distribution, we got a breakdown I’ve labelled “Break The Ice”. This wasn’t just another dip. It was the moment we lost all structure from the markup — the line that had held the previous lows snapped, and volume stepped in. This is often the first real signal that we’ve entered the markdown phase. From a Wyckoff perspective, this breakdown is what separates Phase D from the start of a new accumulation cycle. It’s aggressive, deliberate, and clears out late longs — and that’s exactly what it did here.
Following that breakdown, we formed a new falling wedge — drawn from the top of the markdown all the way to the most recent lows. Price was making lower highs and lower lows, but with less aggression and momentum weakening. This wedge sits inside the larger symmetrical triangle, which has been developing ever since the 2021 top. The apex of this triangle, marked around $2,496, is where I believe everything will come to a head. Break that with conviction — and we could start a whole new macro leg.
But before we get there, something happened worth pointing out. That final breakdown inside the wedge? The one that dipped below and quickly reclaimed? That, for me, was the Spring. It’s labelled in yellow as “Spring” under point D. And it matches the Wyckoff schematic almost perfectly. Volume dried up on the move down. RSI and CCI both showed divergence. Then price bounced hard, reclaimed structure, and we’ve held ever since. This doesn’t look like continuation — it looks like a trap.
If that Spring holds, then we’re now in the Sign of Strength (SOS) phase. This is the moment where price reclaims its mid-structure levels, consolidates, and prepares for the breakout. We haven’t broken out yet — but the groundwork is in place.
My Elliott count also lines up. We had a 5-wave impulse from the Spring to the failed rally, followed by an ABC correction. What we may now be seeing is the completion of another Wave 2, setting up for a possible Wave 3 — the strongest wave of the cycle, if confirmed.
Now let’s talk entries. I’ve got my eye on the $2,130–$2,030 region. That’s where I’m placing my DCA bids. It’s the area just above the Spring reclaim zone, where price should react again if we retest. If we lose $1,690, I consider the Spring invalidated and will reassess. That’s my clean risk level.
Break and hold above $2,496, and the breakout is confirmed. That level is not just the wedge and triangle resistance — it’s also the psychological midpoint of this whole macro structure.
Everything’s mapped. Structure is clean. Volume is drying up. Momentum is shifting. And price is compressing right into the apex.
This isn’t a moment to chase. It’s a moment to plan.
If we break out, I’m ready to scale in. If we reject, I’ll be watching the DCA zone and the Spring level closely. Either way, I know what I’m looking for — and I know what invalidates the setup.
Let’s see what price does next.

ETHUSDT Daily: Navigating the "Deciding Area" Chart Overview:
The ETHUSDT Daily chart presents a compelling narrative of a significant uptrend, followed by a sharp correction, and now shows price approaching a critical inflection point. Key support and resistance zones, along with a crucial trendline, define the current market structure. The chart is labeled "Bullish," suggesting the analyst's long-term bias or expectation of a continuation of the prior uptrend.
1. The Prior Bullish Trend (Late 2023 - Early 2025):
Long-Term Uptrend Line (Green): From around September 2023 into early 2025, ETHUSDT exhibited a strong bullish trend, respecting a clear upward-sloping trendline (highlighted in green). Price consistently found support on this trendline, indicating robust buying pressure and a controlled ascent.
Key Resistance ($3900 to $4000): During this period, ETH encountered significant resistance around the $3900 to $4000 zone. This area represents a supply zone where sellers stepped in, preventing further upward movement on multiple attempts.
2. The Major Correction & Trendline Breakdown (Early 2025):
Sharp Downturn: In early 2025, ETHUSDT experienced a steep and aggressive correction. This bearish impulse led to a decisive breakdown below the long-term green uptrend line.
Shift in Momentum: The breach of this established trendline was a critical event, signaling a significant shift in short-to-medium term momentum from bullish to bearish.
3. Finding Support & Bounce Back:
Weekly Support ($2000 to $2200): After the breakdown, price found initial strong support in the $2000 to $2200 zone. This area had acted as a crucial pivot in previous price history, demonstrating its significance as a demand zone.
Strong Support ($1400 to $1500): Below the weekly support, the $1400 to $1500 zone is identified as "Strong support." This would be the next major demand area if the 2000−2200 level were to fail. The chart shows price briefly dipping below the 2000−2200 zone before finding a base and initiating a strong rebound.
Recent Bounce: The current price action shows a strong bounce from the lows reached after the trendline breakdown, indicating renewed buying interest and an attempt to recover.
4. The "Deciding Area" ($2900 to $3000 & Red Trendline):
Confluence of Resistance: The most critical area on the chart is the "Deciding Area," which represents a confluence of significant resistance levels:
The Former Green Trendline (now acting as resistance): What was once a strong support trendline has now likely flipped to become a resistance trendline (implied by the red line, which is parallel or an extension of the green line). Price often retests broken trendlines before continuing in the new direction.
Horizontal Resistance Zone ($2900 to $3000): This grey box aligns with previous support/resistance levels and now acts as a key overhead supply zone.
Current Price Engagement: Price is currently approaching the lower boundary of this "Deciding Area." This zone will determine the immediate future direction of ETH.
Potential Scenarios:
Bullish Continuation (Breakout): If ETHUSDT can successfully break above the "Deciding Area" ($2900 to $3000 zone and the red trendline) with strong volume, it would signal a significant shift in buying conviction. The next logical target would be the "Key Resistance $3900 to $4000" area, and potentially a retest of its all-time highs. The current bullish arrow on the chart suggests this is the anticipated move if the "Deciding Area" is breached.
Bearish Rejection (Reversal): A strong rejection from the "Deciding Area" could see ETHUSDT consolidate or retrace back towards the "Weekly Support $2000 to $2200" zone. A failure to hold this support could then lead to a test of the "Strong Support $1400 to $1500."
Conclusion:
ETHUSDT is at a pivotal point, engaging with a highly significant "Deciding Area" that combines both horizontal and trendline resistance. The ability of the bulls to push through this zone will be crucial for determining whether the rally from the recent lows can continue towards prior highs or if ETH will face another period of consolidation or deeper correction. Traders should closely monitor price action and volume at these critical levels for confirmation of the next directional move.
Disclaimer:
The information provided in this chart is for educational and informational purposes only and should not be considered as investment advice. Trading and investing involve substantial risk and are not suitable for every investor. You should carefully consider your financial situation and consult with a financial advisor before making any investment decisions. The creator of this chart does not guarantee any specific outcome or profit and is not responsible for any losses incurred as a result of using this information. Past performance is not indicative of future results. Use this information at your own risk. This chart has been created for my own improvement in Trading and Investment Analysis. Please do your own analysis before any investments.

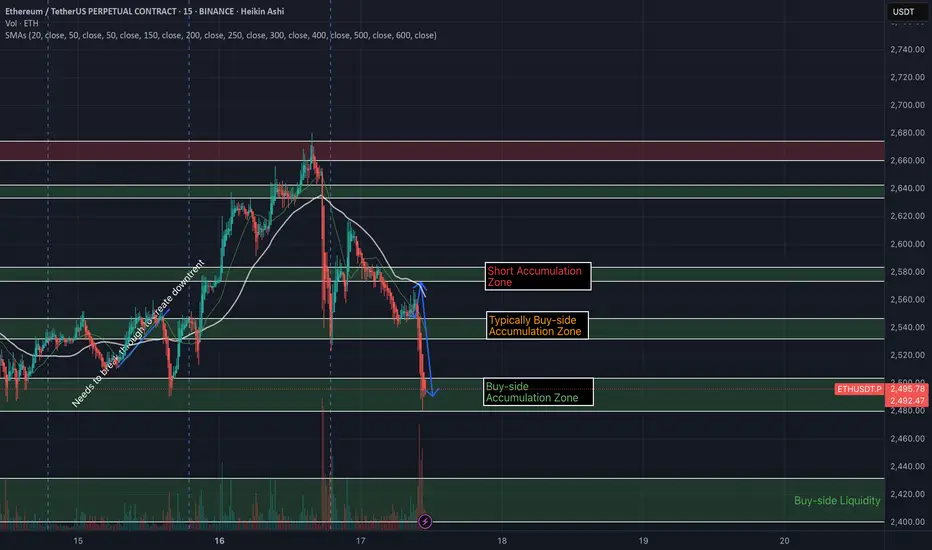
Ethereum Futures Update (Trade Idea)After identifying clear supply and demand zones for ethereum, you can look at the chart and now identify where and when to place trades. Based on my analysis, it is best if we cross map this to the coinglass liquidation heat map to have a more clear idea on the direction that the price action moves.
Furthermore, I think we see maybe a jump back up to 2540s and the make the next move down.
Wait for ETHETH faced rejection at the weekly resistance near $2,700.
Price is likely to retest the current weekly support around the $2,100 zone.
Patience is key—wait for ETH to reach this support area before considering entry.
Disclaimer:
This analysis is based on my personnal views and is not a financial advice. Risk is under your control.
ETHUSDT – Trade Recap & Daily Bias for June 21Trade Recap (June 20):
I. First thing I did was mark out a DOL on the daily — price was hovering near a swing low, and I started noticing trend-side liquidity building up on the lower timeframes.
So my directional bias for today was short.
II. I marked the daily open.
III. With a short bias in mind, I waited for a Turtle Soup setup right above the daily open.
IV. The equal highs above were clean and obvious — textbook liquidity.
V. Once that liquidity was swept, I dropped to the M15 to watch how price reacted — waited for a clean displacement away from that zone before getting involved.
Daily Bias (June 21):
Still leaning short. We’re pretty close to a weekly FVG, which might act as a magnet.
If price forms liquidity during the day and takes it out in-session, I’ll look to short again.
Bread and Butter & Turtle Soup
