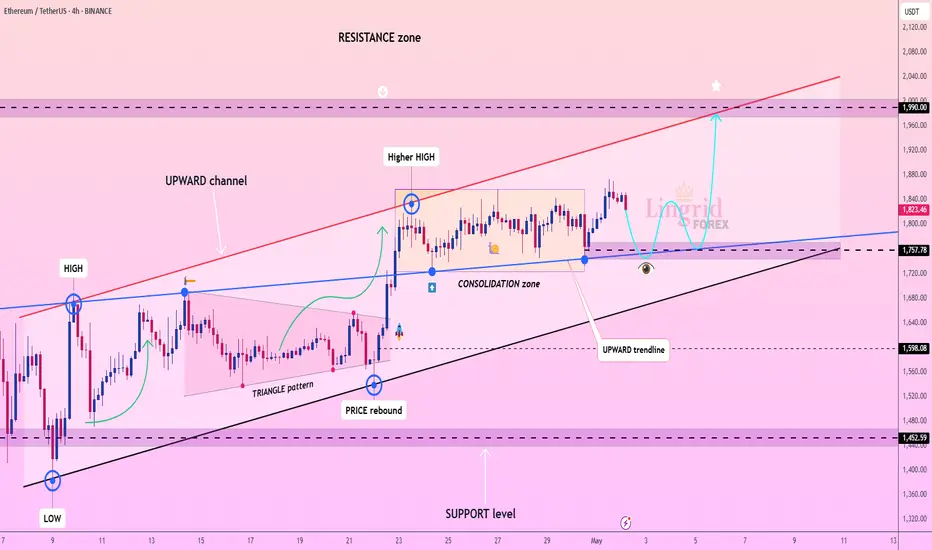
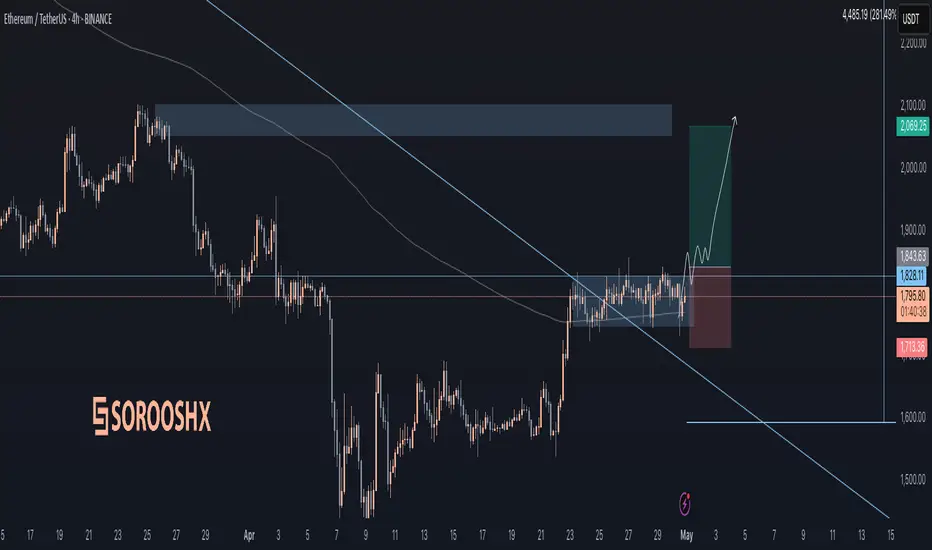
Lingrid | ETHUSDT Trend Continuation Pattern. Potential LongBINANCE:ETHUSDT is consolidating inside an upward channel, holding just above the 1,757 support and the upward trend-line. After reaching a higher high near the channel top, price pulled back but remains within structure. If the trend-line holds, a rebound toward the 1,990 resistance looks likely. The bullish setup remains valid while price trades above the trend-line.
📈 Key Levels
Buy zone: 1,750 – 1,760
Buy trigger: bounce from trend-line
Target: 1,990
Sell trigger: break below 1,750
💡 Risks
If ETH loses trend-line support, momentum could flip to bearish.
Volatility from BTC or macro events may trigger false moves.
Watch for breakout above consolidation highs for early confirmation.
Traders, if you liked this idea or if you have your own opinion about it, write in the comments. I will be glad 👩💻
ETHUST trade ideas
B wave short incoming!if eth breaks its local top before making a double bottom this trade idea is invalid.

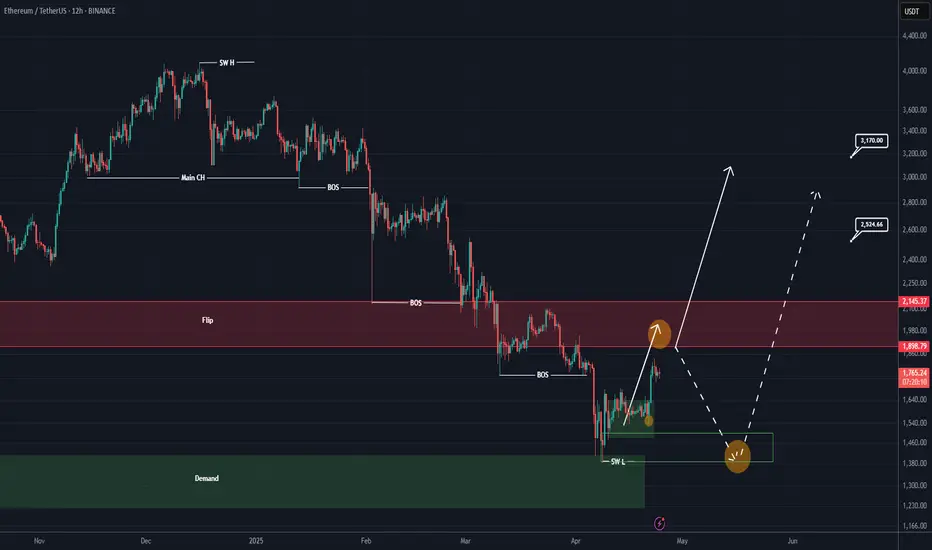
ETHEREUM is getting ready for a major breakout (12H)This analysis is an update of the analysis you see in the "Related publications" section
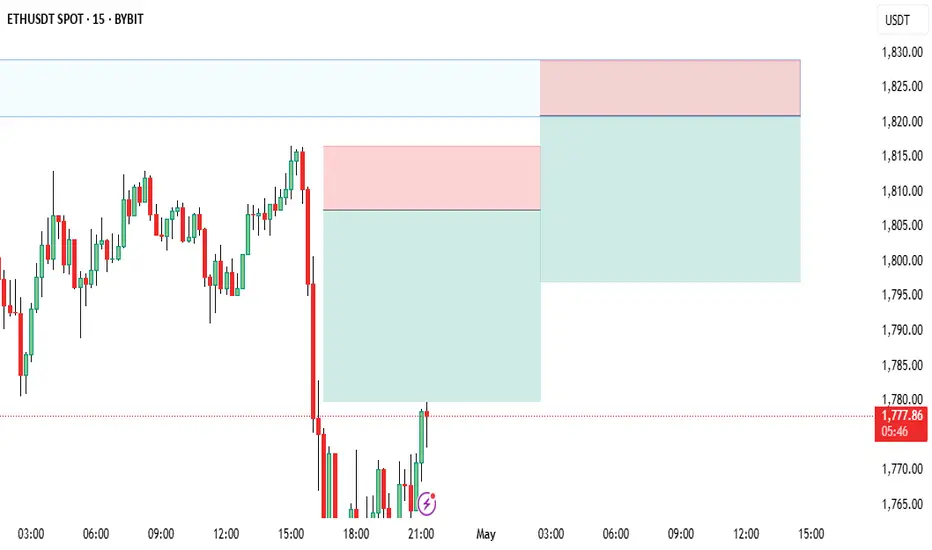
The red zone represents a supply area based on the Philip strategy. It’s possible that the price might not be able to break through this zone on the first attempt. If the price gets rejected, the lower green box will be a re-entry opportunity for those who missed the move.
Let’s closely monitor this chart and see how it plays out.
A daily candle closing below the invalidation level will invalidate this analysis. invalidation level : 1198$
For risk management, please don't forget stop loss and capital management
When we reach the first target, save some profit and then change the stop to entry
Comment if you have any questions
Thank You
HolderStat | Tracking a long-term strategistThis trader turned $127 into $4,626 — that’s +3623% with just 3 trades over 5+ years.
He didn't chase hype.
He bought at $671 and sold at $4,741.
Minimal action. Maximum gain.
Wallet still holds 0.74 ETH CRYPTOCAP:ETH ($1.3K).
Proof that sometimes… doing nothing is the best strategy 🧘♂️

ETH ~ H4 ETHUSDT.P LONG TRADE
SETUP
E : 1814.76
TP : 1952.00
SL : 1767.62
BREAKDOWN
Decent Structure break (Cisd ) change in state of delievery taking previous range highs,
Looking for some fills over h4 breaker block resting @ 1814.76ish aiming range highs ( erl ).

Crypto psychology ep4 : Why You Want to Make Money from Crypto ?Crypto isn’t just a market — it’s a dream factory. Every day, millions of people throw their money (and hopes) into the blockchain, all chasing the same thing: " financial freedom ". But why are people so drawn to making money from crypto? Let’s unpack it.
The Dream of Easy Money
Let’s be real: who doesn’t want to make money without breaking their back? Crypto promises that fantasy — you buy a coin, wait, and (hopefully) watch it explode in value. Unlike traditional jobs or businesses, it feels like you can skip the grind. That hope of less effort, more reward keeps pulling people in, even if the reality is much harsher.
Chasing the Jackpot Coin
Everyone’s looking for the next Bitcoin, the next 100x gem that could turn a few hundred bucks into millions. That “ lottery ticket ” mentality fuels the hunt for low-cap coins, meme tokens, or risky projects. It’s not just about profits — it’s about finding that one life-changing win that could rewrite their story forever.
The Escape from the 9-to-5 Job
For many, crypto isn’t just a side hustle — it’s a possible escape route. The idea of quitting that soul-crushing office job , saying goodbye to bosses and deadlines, and living on your own terms? Crypto makes it feel achievable. Even if it’s a long shot, it’s a shot people are willing to take to avoid spending decades in the rat race.
Important : Revenge on the Market
Since the brutal crashes of 2022 , a lot of traders have been left deep in the red. But instead of walking away, many are chasing the market harder than ever. It’s not just about making money anymore — it’s about getting back what they lost, proving they were right, and maybe even outsmarting the system that beat them before. That hunger for revenge can keep people in the game way longer than logic says they should stay.
Crypto isn't just numbers on a screen — it’s a cocktail of hope, desperation, and ambition. And that’s why, no matter how risky it gets, people keep coming back.
BINANCE:BTCUSDT BINANCE:DOGEUSDT BINANCE:XRPUSDT BINANCE:ADAUSDT

Eth ~ H4 AnalysisETHUSDT.P
Exchange : Bitget
Directional Bias
Htf : Bullish
Ltf : Locally Bearish to fill ineffiecines lower - send it higher from there.
Breakdown:
Price currently breaking Previous resistance zones while we had a Daily close above @ 1742ish confirming the bullish trend intact,
Tagged local Volume Gap marked by indicating aggresive buys sitting at these lows which they dont want to lose,
Key Important Levels :
1) 1956 (Low - term targets )
2) 2017 (Mid - term targets )
Looking at the 1811 zone for ltf confirmation to bid largos aiming 1956ish region,
After tagging 1956ish fills - > ltf accumulation and we squeeze aiming our secound zone resting @ 2017

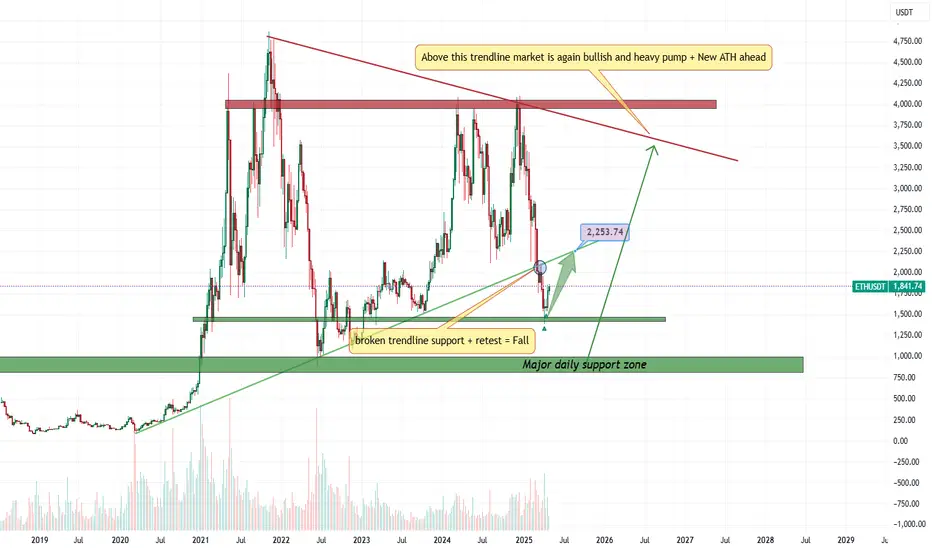
ETHUSDT Soon again Above 2K$The support zone hold price from falling as it was expected:
Now we are looking for more pump here and at least our first target which is 2200$ and if the price pump and get back above the green trendline then market is bullish once again and next Targets like 3K$ is also possible.
DISCLAIMER: ((trade based on your own decision))
<<press like👍 if you enjoy💚
#ETH #ETHUSD #ETHUSDT #ETHEREUM #Wyckoff #Analysis #Eddy#ETH #ETHUSD #ETHUSDT #ETHEREUM #Wyckoff #Analysis #Eddy
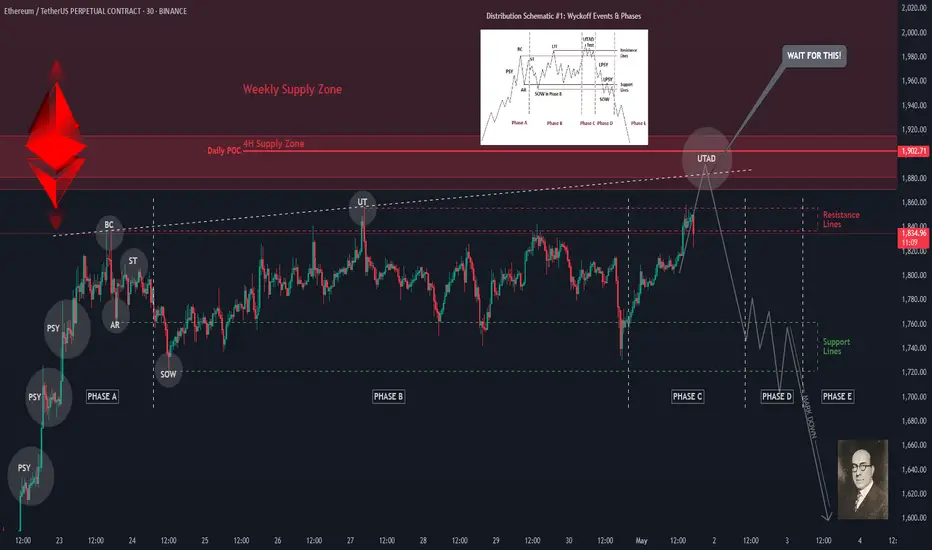
This analysis is based on the analytical style of the Wyckoff Distribution Structure of Schematic #1.
I have outlined for you the important parts of the Wyckoff style on the one-hour timeframe.
Currently, we are in Phase C of the Wyckoff Distribution Structure.
We have to wait for the completion of this phase and the start of Phase D of the Wyckoff Distribution Structure.
When will this structure be fully confirmed? When the Ethereum price falls to the 1750 support and gathers the final spring when this support is broken for the fall, we will enter a short position by getting the necessary confirmations based on our style and strategy.
💬 Note: The best entry point for short positions will be the 1720_1750 support break. if the Ethereum price UTAD and test formed, high-risk traders who are willing to trade in the opposite direction can enter a short position by getting confirmation in the time frames below 15 minutes.
Where will the targets be? The first target is 1500 and the second target can be 1000 dollars. Maybe next targets is : 800_500 dollars.
When can you safely close the position and enter a reverse trade, that is, long or buy? When a Wyckoff accumulation structure is formed at one of the targets.
The responsibility for the trade is yours and I have no responsibility for your failure to comply with the risk and capital management.
Good luck and be profitable.
I also invite you to review and view my latest analysis on Bitcoin & TOTAL3 on my page.
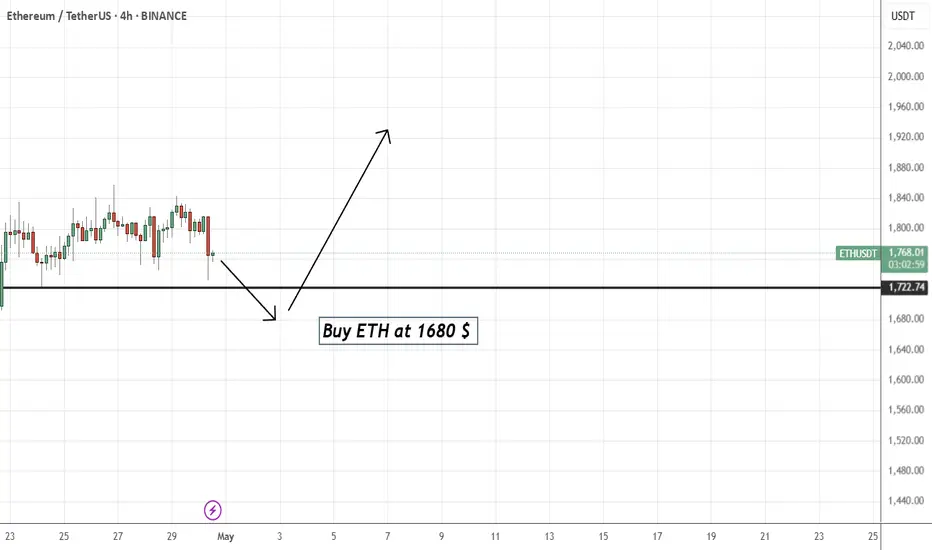
ETH : BUY...Hello friends
Due to the entry of buyers and the breakdown of the trading range, we can buy in the direction of the trend and with capital and risk management within the specified limits and move to the specified targets.
*Trade safely with us*
ETHUSDT LONG ETHUSDT
LONG opportunity
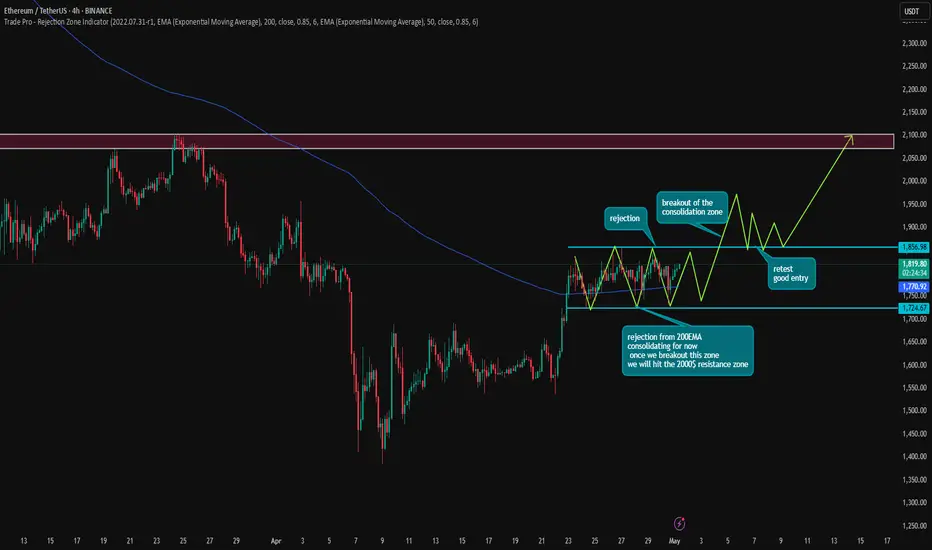
Ethereum is the most undervalued asset right now us we can prove that on weekly RSI and stochastics.
The 4HR chart looks good to buy in short time period. As it is shown in the chart price has been bounced 3 time from the 200 EMA which acts as support and consolidating sideways once we break out of the 1856.98 price zone, we may probably hit the 2000$ dollar mark. let me know what you think
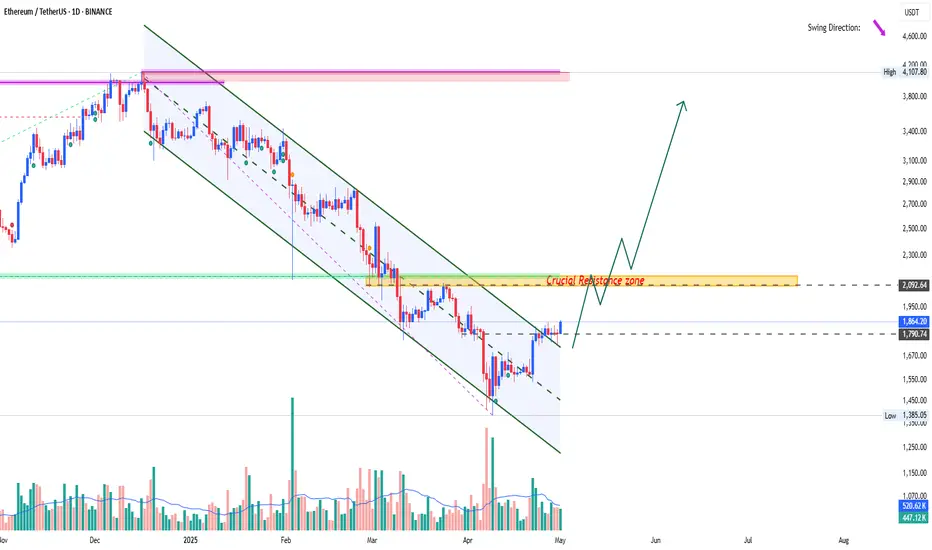
$ETH CRYPTOCAP:ETH 1D - two possible scenarios
Ethereum retains the potential to form an entry point within the designated zones of interest.
Alerts are set, I am waiting for one of the two scenarios presented on the chart to materialize.
The main emphasis is on the first scenario - I continue buying on the DCA strategy (yes, even the main skeptic of CRYPTOCAP:ETH is now accumulating it).

Ethereum (ETH): Looking For Market Structure Break | Golden ZoneEthereum is still inside the golden zone, which we determined on a 4-hour timeframe, where we see pressure from sellers being bigger than buyers.
Usually this kind of structure development leads to MSB formation so that's what we are looking for. As long as sellers maintain the price below the upper resistance zone, we are good for a smaller correctional movement here.
Swallow Academy

Ethereum (ETH): Sellers Are More Aggressive Than BuyersLooking at candles on the 4-hour timeframe, we are noticing the strong momentums from sellers with big and strong red candles they form after some kind of upward movement (which comes with hard work from buyers).
This kind of dominance is giving us a possible sign of an upcoming bigger selloff so we need to monitor here the 200 EMA, which is acting currently as a support zone. Once we see a 4-hour candle close below that EMA, we will be looking for downside movement!
Swallow Academy

$ETH – The move is obvious.CRYPTOCAP:ETH – The move is obvious.
We already know what’s next.
If you’re not in, you’re watching gains walk away.
You snooze, you lose. 🚀

This Trade Can Change your Life - $ETHMy Last idea i shorted Bitcoin Top when everyone was bullish
Marked 75K as bottom when everyone was bearish
i have high confidence in this ETH Setup
Enjoy

Technical Analysis: Ethereum (ETH) — April 30, 2025📊 Outlook
Ethereum is trading in a tight range with slight upward momentum. Current RSI is neutral, and price remains above the 50-day SMA, hinting at a sustained bullish trend. The Fear & Greed Index supports this positive sentiment. A break above $2,000 could confirm bullish continuation, while a drop below $1,700 may shift sentiment to bearish.
📌 Analyst Note: Maintain bullish bias while ETH remains above $1,790.66. Monitor resistance at $2,000 for breakout confirmation.
🔍 Indicators
RSI (14): 51.60 — Neutral
SMA 50: $1,790.66 — Price slightly above → Bullish
30-Day Volatility: 4.97%
Fear & Greed Index: 61 (Greed)
Technical Sentiment: Bullish
📈 Levels
Next Resistance: ~$2,000
Next Support: ~$1,700
Short-Term Price Target: $1,804.35 by May 30, 2025
ETH short
Liquidity sweep and rejection at the monthly open.
Short trigger. Aiming for the previous weeks high
Confluent with the value area low of the current week so far (volume profile)

#ETHUSDTTwo areas for selling trades are marked with a reward of one to three. It is better to enter in the higher area because it is less risky, and the lower area is more risky because the price may hit the lower area stop to reach the upper area.
ETH at a critical Zone - Bounce or Drop?Ethereum is trading at a key level. Will we see a strong reversal to the upside, or is a deeper drop coming? What's your expectation?
Share your thoughts below!
Kindly support this idea with a LIKE👍 if you find it useful🥳
Happy Trading💰🥳🤗

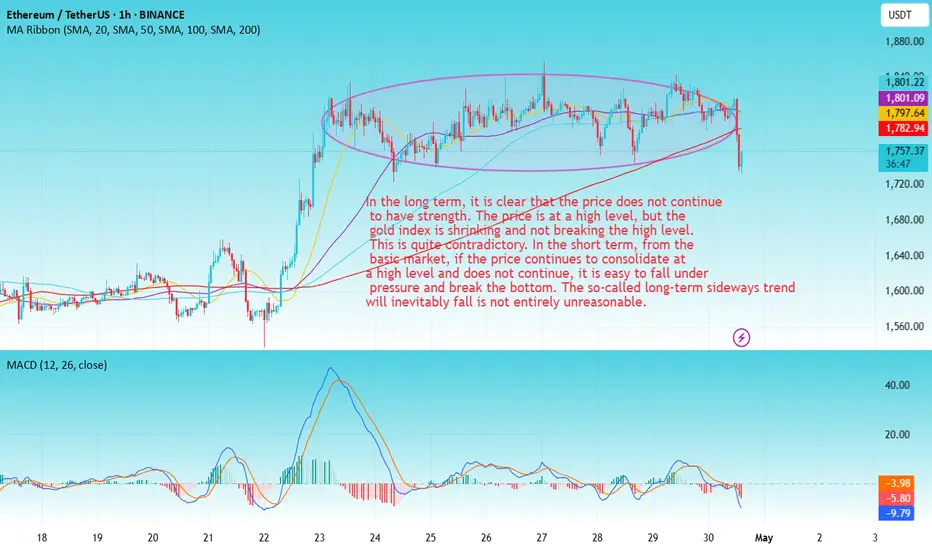
ETH-----Sell around 1800, target 1730 areaTechnical analysis of ETH contract on April 30:
Today, the large-cycle daily level closed with a small negative line yesterday. The K-line pattern was a continuous positive single negative, the price was above the moving average, and the attached indicator was a golden cross with a shrinking volume. However, at present, the rise did not break the high and did not continue. The decline also did not see the strength and continuation. It is likely to be a fluctuating trend. Therefore, we should not think too much about trading, just keep short-term; the short-cycle hourly chart was under pressure and retreated in the morning. Yesterday's high point was in the 1842 area, and the previous low point supported the 1722 area; this is the current range of range fluctuations. The current K-line pattern is a continuous negative, and the attached indicator is dead cross running, so there is still a high probability of a downward trend during the day.
Therefore, today's ETH short-term contract trading strategy; sell at the 1800 area, stop loss at the 1830 area, and target the 1730 area;