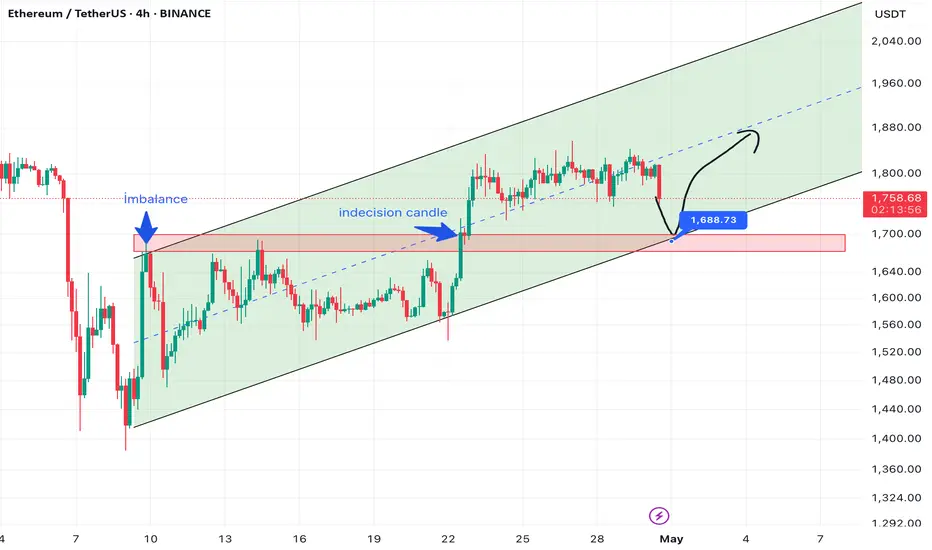
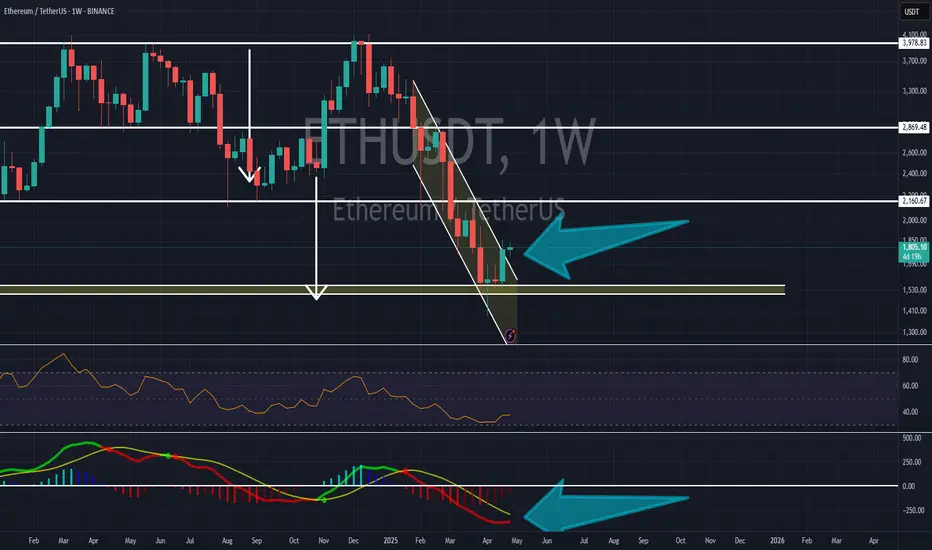
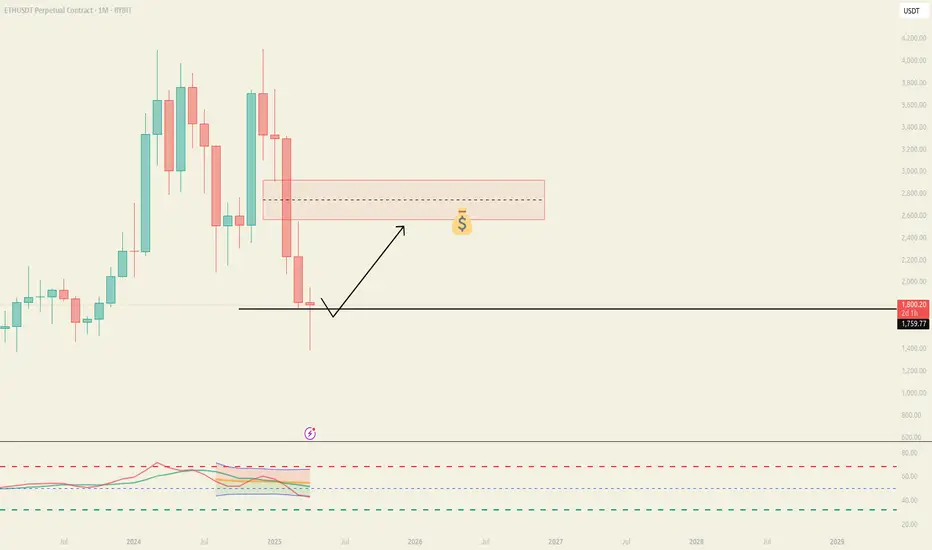
ETHUSDT UPDATEEthereum is currently in a downtrend, but I want to predict where it will come back from. The area I mentioned has both an imbalance and an indecision candle. This means that 1680-1700 is an important support for us. We have fallen too much, that's enough. I will try to increase my analysis and add value to you.
ETHUST trade ideas
ETH/USDT 1H Chart: Breakout on the Horizon? Hey Ethereum traders! Let’s dive into this 1-hour ETH/USDT chart.
I didn’t manage to post in time, and ETH has made its move — unfortunately, it’s not the one we hoped for!
We had a classic triangle forming, with ETH consolidating between converging trendlines. The price was sitting around $1,803.65, teasing the daily high resistance at $1,842.89. I thought about a potential breakout toward the weekly high of $1,864.20, but instead, ETH broke below the triangle’s support line!
Now that the breakdown has happened, we’re likely heading toward the weekly low at $1,754.28, or even the breakdown target of $1,691.30.
Key Levels to Watch:
Resistance: $1,842.89 (daily high), $1,864.20 (weekly high)
Support: $1,780.47 (daily low), $1,754.28 (weekly low)
Breakdown Target: $1,691.30
The bears have taken control for now — where do you think ETH is headed next? Let’s discuss below!

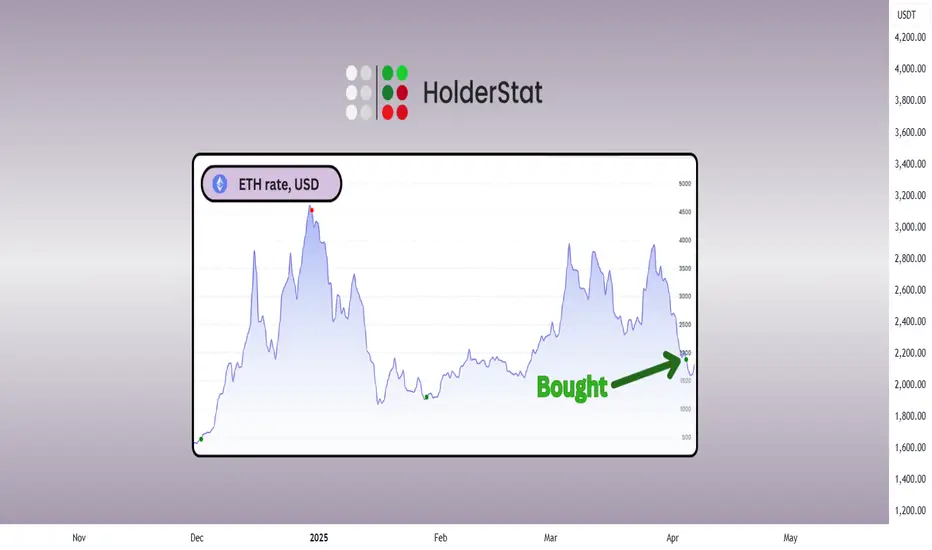
HolderStat | Smart ETH whale spotted💼 Holding 6.5 ETH (~$11,722)
💰 Invested: $1.1K → Profit: $11K (+1006%)
📉 Avg Buy: $1,289 | 📈 Avg Sell: $4,572
📌 Bought more CRYPTOCAP:ETH a month ago
🦄 Still holding BME:UNI
Knows how to ride the cycle like a pro 😎

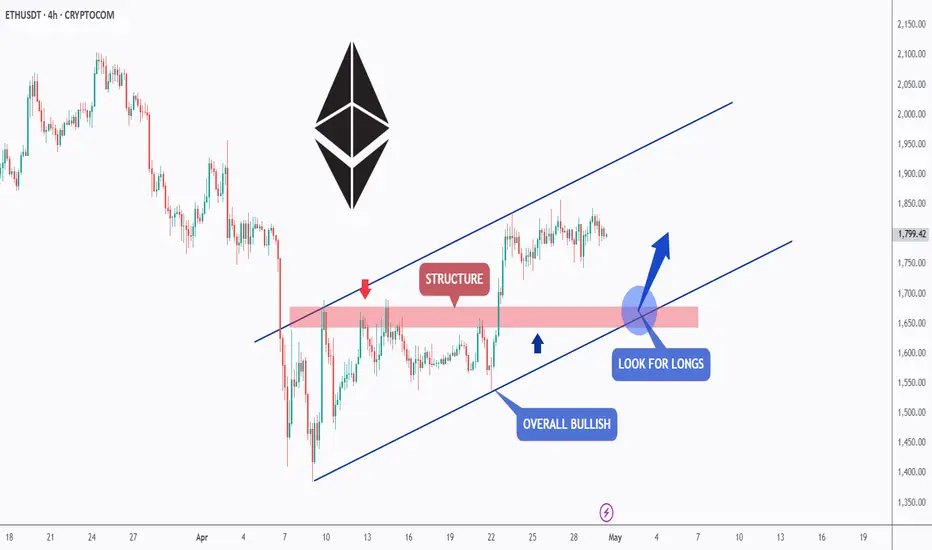
ETH - Longs on the Go!Hello TradingView Family / Fellow Traders. This is Richard, also known as theSignalyst.
📈ETH has been overall bullish from a medium-term perspective trading within the rising channel marked in blue.
Moreover, the red zone is a strong resistance turned support!
🏹 Thus, the highlighted blue circle is a strong area to look for buy setups as it is the intersection of support and lower blue trendline acting as a non-horizontal support.
📚 As per my trading style:
As #ETH approaches the blue circle zone, I will be looking for bullish reversal setups (like a double bottom pattern, trendline break , and so on...)
📚 Always follow your trading plan regarding entry, risk management, and trade management.
Good luck!
All Strategies Are Good; If Managed Properly!
~Rich
Ethereum about to flyAs the falling channel for ethereum has broken few days ago, now the weekly MACD is about to make a bullish cross as well, and that makes ethereum to fly soon
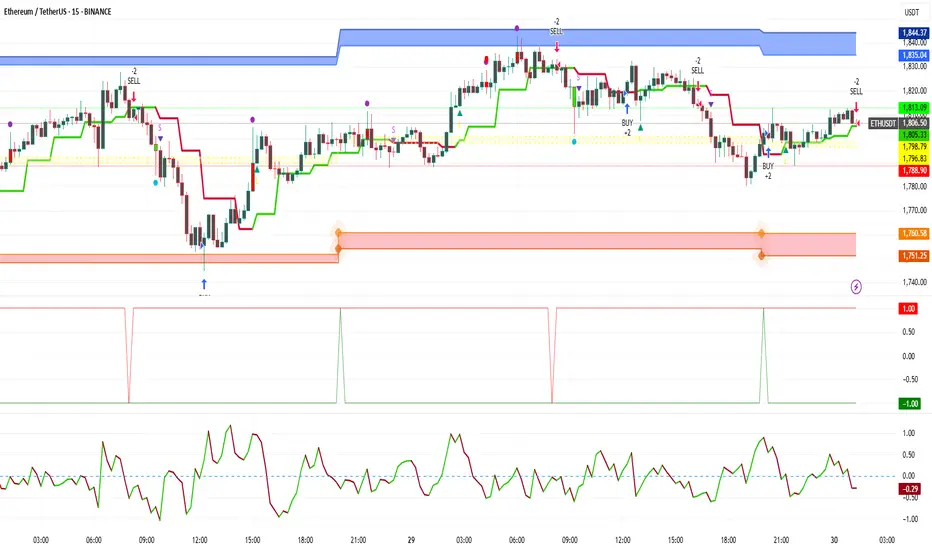
ETH is showing a potential reversal !on the 15 minute chart,
Price is holding strong above the support zone
and is now testing resistance at $1815
if it breaks, the next target is $1830.
scalpers don't miss this breakout opportunity!
ETHUSDT – Long Setup ETHUSDT – Weekly Structure + FVG + Fibonacci Confluence | Potential Long Setup
---
📌 Summary
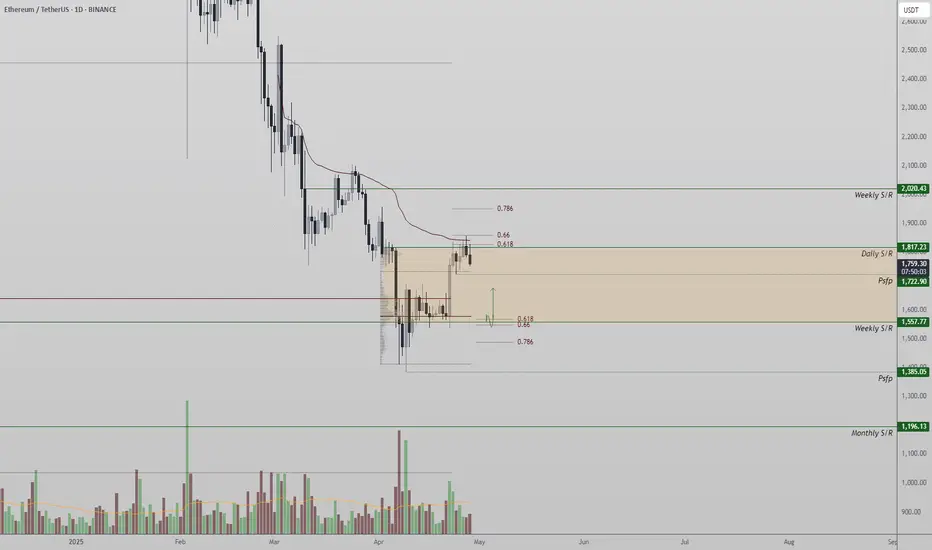
Ethereum is showing signs of basing out after a prolonged downtrend, hovering near a high-timeframe fair value gap (FVG) zone. Weekly RSI is recovering from oversold territory, and the price is reacting around the 61.8% Fib retracement from the macro low to the 2021–22 highs. I'm watching for a potential long if price holds above $1,700 and pushes back toward the $2,000–2,200 supply zone.
---
🔍 Fundamentals Snapshot
While crypto is primarily sentiment-driven, ETH remains a core network token with strong utility, staking growth, and continued developer activity.
- Market Cap: ~$220B
- Narrative: Staking yield + DeFi backbone
- Risk: Macro pressure + Regulatory overhang
- Key On-Chain Trends: Supply contraction post-merge, L2 growth, ETH burn
---
📈 Technicals Overview
- **Trend**: Downtrend, but flattening; possible bottom structure
- **Fair Value Gap (FVG)**: Weekly FVG between ~$1,550 and ~$1,700 acting as support
- **Fibonacci**: Price reacting to the 61.8% retracement (~$1,800) from the 2020–21 run-up
- **RSI**: Near 40 on the weekly, bouncing from oversold levels
- **Moving Averages**: 8/21 EMAs compressed; momentum shift possible on crossover
- **Structure**: Possible bullish MSB (market structure break) if ETH closes above $1,900
- **Support/Resistance**:
- Support: $1,700, $1,550
- Resistance: $2,000, $2,200
---
🧠 Sentiment & Positioning
- Sentiment has been washed out post-liquidation cascade
- Open Interest flattening; some early long buildup visible
- Crypto Twitter showing cautious optimism, no euphoria (bullish)
---
Risk/Reward Snapshot
- **Entry**: On pullback toward $1,720–$1,760 or breakout above $1,900
- **Stop Loss**: Below $1,540 (weekly FVG invalidation)
- **Target 1**: $2,000
- **Target 2**: $2,200
- **R/R**: ~2.5 to 3.0 depending on entry
- **Position Size**: Scaled in across FVG zone with tighter risk at midpoint
---
📝 Final Thoughts
ETH is at a potential turning point structurally. The weekly FVG, Fib retracement, and improving RSI suggest a favorable risk/reward for swing longs. A confirmed weekly close above $1,900 would increase confidence in a trend reversal. Watching for confirmation via volume expansion and follow-through candles.
---
HolderStat | What second top ETH holder do?He HOLD his position 7.02 ETH ~ 12 790 USD.
He know how to hold ETH/USDT for profit 😎
🧠This dude makes money by buying near a bottom and waiting for signs of a decline.
Statistic:
📥Invested($): 649
📈Profit ($): 41 820
💹Profit (%): 6448

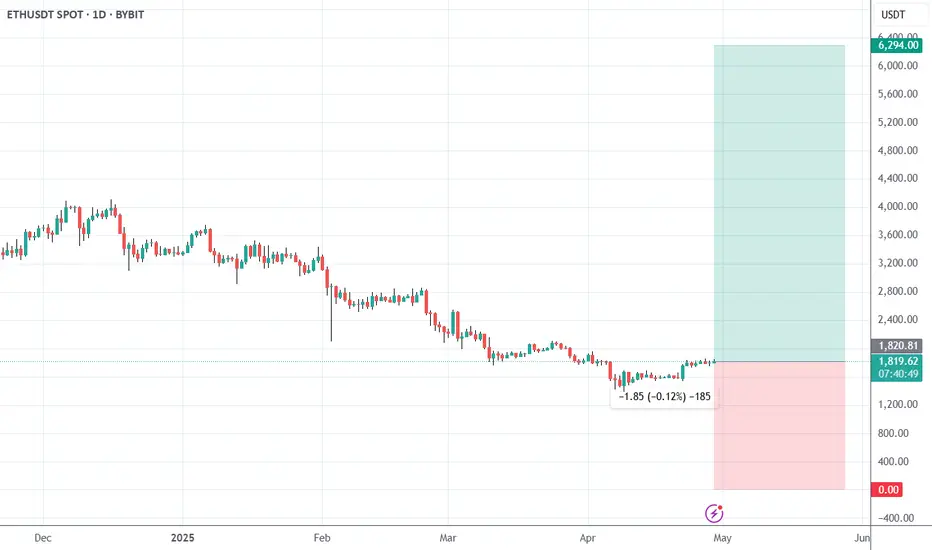
ETH Would Hit $6.000Buying ETH on the spot market now could be a good opportunity if prices are near support ($1,800–$2,500) and technical indicators signal a bottom.
Ethereum’s strong fundamentals and upcoming catalysts (Pectra, ETFs) support a hold strategy, with $6,494 as a viable profit-taking target in a bull run.
Holding beyond $6,494 could capture further upside for long-term holder, but secure profits incrementally to hedge against volatility.
Only for SPOT Market!!!
Some news for my own consideration:
Pectra Hard Fork (April 2025) : The upcoming hard fork, set for May 2025, is a significant bullish catalyst. It will enhance Ethereum’s scalability, security, and user experience, potentially attracting more developers and users.
Spot ETH ETFs : Ethereum’s U.S. spot ETF approval is a major milestone, with analysts noting its potential to drive demand. Posts from July 2024 suggested the market underestimated ETF impacts, which could materialize in 2025.
Market Volatility : Ethereum faced significant declines, hitting its lowest level since November 2023 in March 2025 (down 15% in 24 hours). However, it showed resilience trading above $1,800 amid stock market turmoil in April 2025.
Whale Activity : Large ETH holders have been active, with some selling for profits before market crashes (e.g., $399M moved in February 2025). This suggests potential price suppression but also opportunities to buy during dips.
Broader Crypto Market : Bitcoin’s rally to $90,000 in April 2025 amid a turbulent stock market has spilled over to altcoins like ETH, supporting a bullish sentiment. A pause in U.S. tariffs also lifted risk sentiment, benefiting ETH.
Clear Lower range to higher rangeNo real resistance for ETH till Golden pocket. Monthly close around corner.

ETH(20250429) market analysis and operationTechnical analysis of ETH contract on April 29: Today, the large-cycle daily level closed with a small positive line yesterday, and the K-line pattern was a single negative line. The price was consolidating at a high level. The attached indicator was in a golden cross operation. The overall trend of rising is still obvious. However, it should be noted that the price seems strong but the rebound did not break the high and did not continue. Instead, it quickly retreated under pressure after touching the high pressure level. At the same time, the low point moved up. In this way, the price will maintain a range of fluctuations before it breaks through the pressure position and support position; the short-cycle hourly chart was also in a range trend yesterday, with a high of 1850 and a low of 1750. The current price is in correction.
Therefore, today's ETH short-term contract trading strategy: buy in the 1750 area when it retreats, stop loss in the 1720 area, target the 1815 area, sell in the 1815 area when it rebounds, stop loss in the 1845 area, target the 1750 area; give real-time trading strategies based on real-time trends during the session

ETH USDT PositionETHUSDT long opened — Margin: $835 | Leverage: 55x. Targeting breakout continuation above key resistance zone

ETHETH had a trend reversal when it broke out of the daily downtrend as seen on chart with a clean a strong displacement. I am looking for a sweep of local highs and swing highs of the range that eth is in with a displacement and a confirmation before entering.

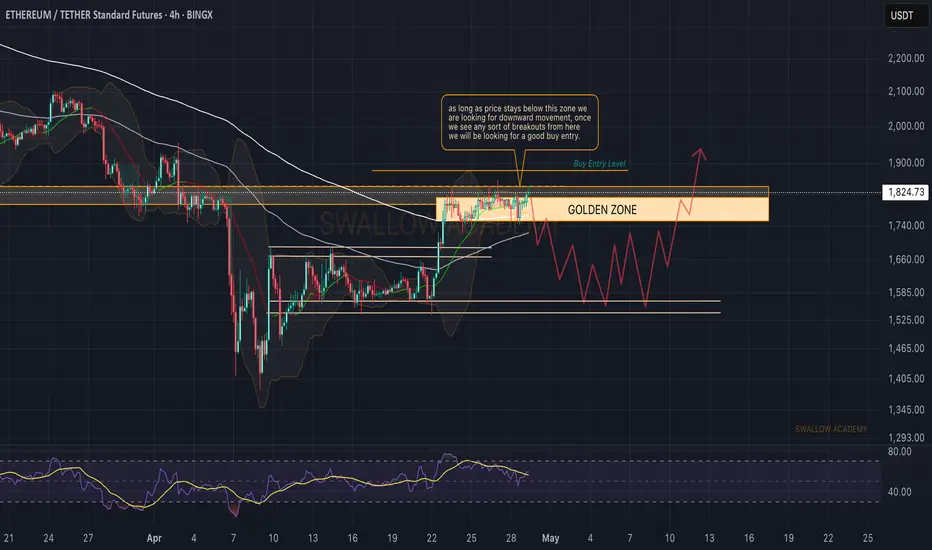
Ethereum (ETH): Waiting For More Clarity, Eyes on 200EMANothing much has changed on Ethereum, where the price has been trading in our golden zone between the 200EMA and our resistance zone.
While price has been moving up and down in a sideways channel for the past week, we are expecting some volatile breakout or breakdown to happen this week, when the monthly candle of ETH will close and a new one will open.
So we wait; once one of our zones is reached, we will be looking for a long position or a short position (if 200EMA will be broken), depending on market structure development.
Swallow Academy
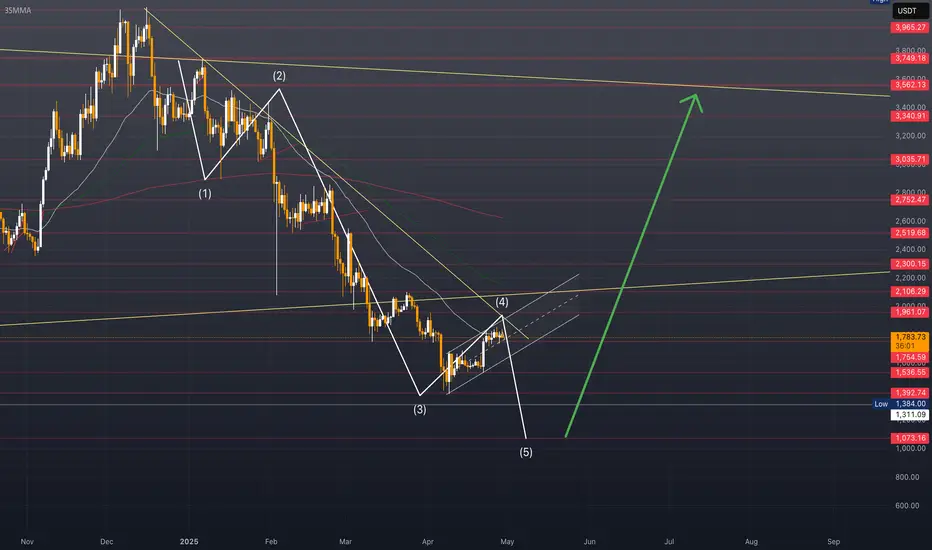
Ethereum Nears Breakout: Strong Support, $1950 Targeted NextHello and greetings to all the crypto enthusiasts, ✌
All previous targets were nailed ✅! Now, let’s dive into a full analysis of the upcoming price potential for Ethereum 🔍📈.
Ethereum has been trading within a downward cycle, but a short-term breakout above the descending channel appears likely. The price is approaching the key psychological level of $2,000, with a primary target of $1,950. This suggests a potential upside of at least 25% from a strong support zone.📚🙌
🧨 Our team's main opinion is: 🧨
Ethereum looks set to break out of its downtrend, eyeing the $2,000 mark with a main target of $1,950—about a 25% move up from strong support.📚🎇
Give me some energy !!
✨We invest hours crafting valuable ideas, and your support means everything—feel free to ask questions in the comments! 😊💬
Cheers, Mad Whale. 🐋

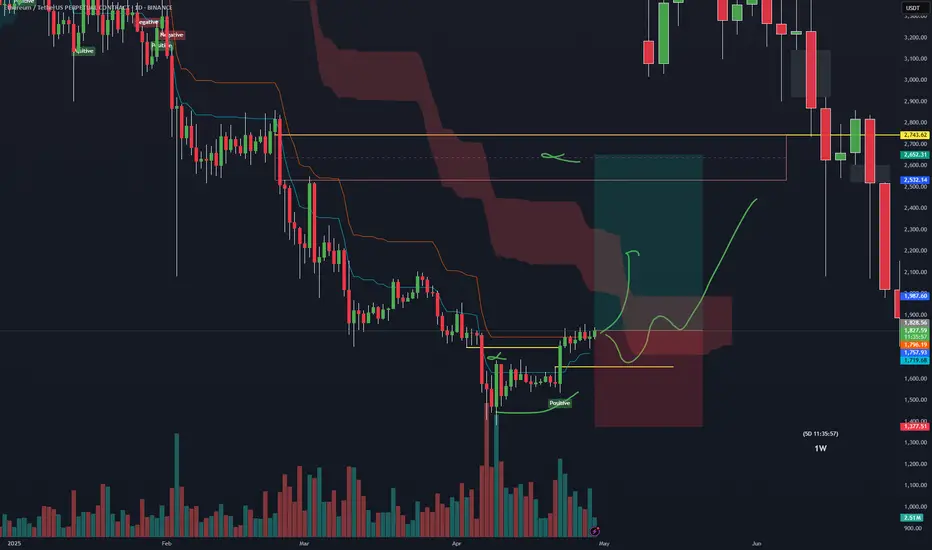
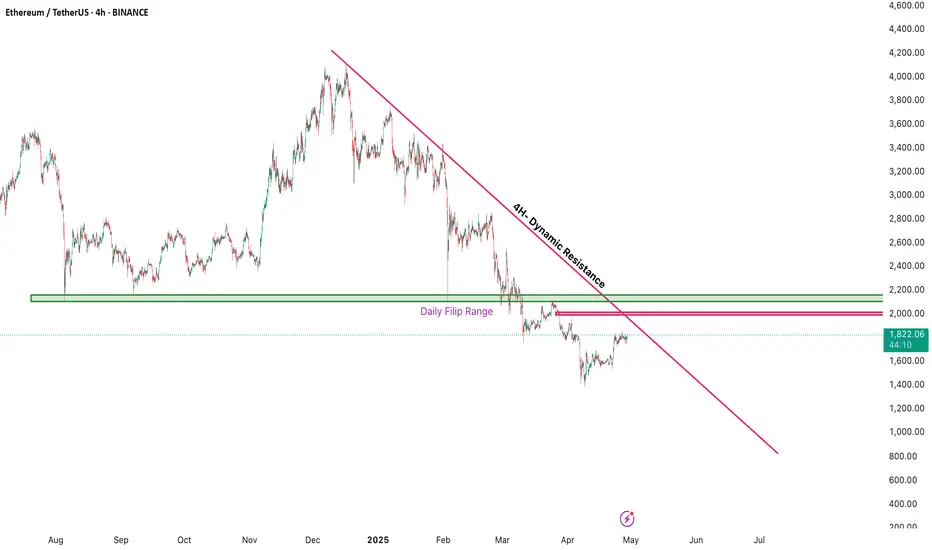
Ethereum Technical OutlookEthereum remains in its overall downtrend 📉; however, the recent sharp upward move shows early bullish signals 🟢.
The highlighted supply zone in red ($1994–$2012) could serve as a strong resistance area, potentially triggering a pullback.
Additionally, the daily flip level (marked in green) may also act as a barrier, pushing price lower.
Despite the bearish setup around these zones, we do not anticipate a deeper correction for ETH.
Any pullback is expected to be limited to the $1760 level, after which a bullish continuation and a potential breakout of the descending trendline are anticipated.
ETH
ETH is aiming for a confident long-term growth.
The nearest areas of interest for profit-taking are $2,175 and $2,565.
ETH/USDT 1H: Bearish Structure with Potential Bounce ETH/USDT 1H: Bearish Structure with Potential Bounce – Long Setup from Discount Zone
🚀 Follow me on TradingView if you respect our charts! 📈 Daily updates!
Current Market Conditions (Confidence Level: 8/10):
Price at $1,796.97, currently bearish after breaking equilibrium zone.
Hidden bearish divergence visible on RSI, suggesting weakening bullish pressure.
Smart Money likely accumulating positions in the $1,740 – $1,760 discount zone.
Trade Setup (Long Bias):
Entry: Optimal between $1,795 – $1,805 range.
Targets:
T1: $1,840
T2: $1,860
Stop Loss: $1,765 (below recent low).
Risk Score:
8/10 – Smart Money accumulation supports the setup, but confirmation bounce from support is crucial for entry.
Key Observations:
Resistance at $1,820 (previous high) acting as local cap.
Support solid at $1,760 (discount zone), strong reaction expected.
Premium zone between $1,840 – $1,860 ideal for scaling out profits.
Smart Money potentially setting up shorts from premium zone for later liquidity grab below $1,740.
Recommendation:
Wait for clear confirmation of support hold before entering longs.
Manage risk carefully; consider partial scaling at $1,840 and securing full profits at $1,860.
Monitor price action at $1,820 resistance for possible early signs of rejection.
🚀 Follow me on TradingView if you respect our charts! 📈 Daily updates!

ETH Analysis Update target ??
#Ethereum needs to close a daily candle above the orange zone at $2200 to confirm the continuation of the bullish trend. 📈
As long as the price remains below this level, caution is advised. A breakout and daily close above $2200 would likely trigger a strong upward movement.

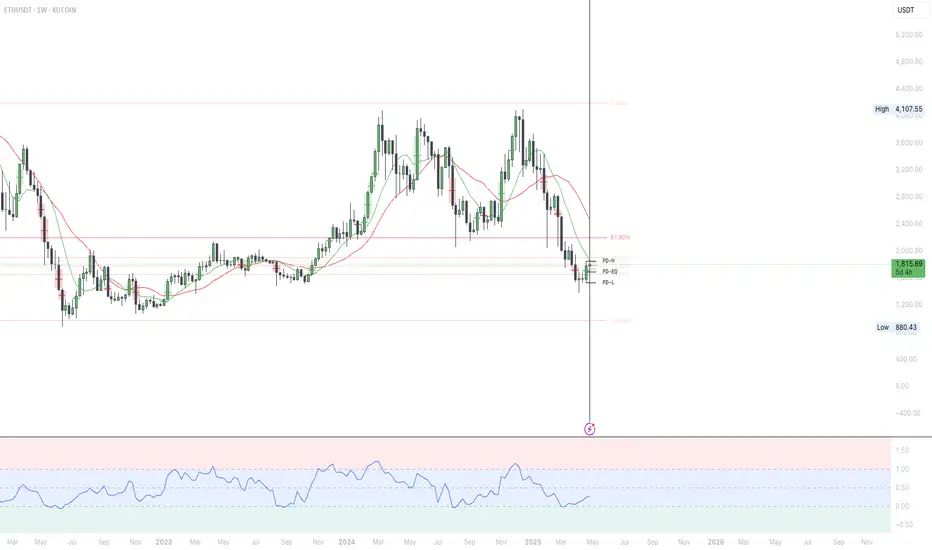
Ethereum Critical Resistance| Price Action| Macro Trend Ethereum is trading at a major resistance zone aligned with the 0.618 Fibonacci, VWAP SR, and a strong daily horizontal level. Despite the recent impulsive move, multiple daily candles have failed to close above this resistance, highlighting underlying weakness.
Key support is situated around $1,055, a high-timeframe level critical for establishing a higher low. If Ethereum fails to hold this region on a retest, it risks breaking the swing low and extending the macro downtrend of lower highs and lower lows on the daily timeframe.
At this stage, a rejection from the current resistance would likely lead to continued bearish momentum and a push toward lower support levels. Conversely, a strong support hold at $1,055 followed by a breakout above resistance would be needed to signal a potential shift in structure and early signs of strength.
Price action remains at a decisive juncture: rejection favors bearish continuation, while a higher low backed by volume could flip the trend bullish in the coming sessions.