ETHEREUM Potential Bullish BreakoutEthereum price seems to exhibit signs of overall potential Bullish momentum if the price action forms a prominent Higher High with multiple confluences through key Fibonacci and Support levels which presents us with a potential long opportunity.
Trade Plan:
Entry : 2950
Stop Loss : 2200
TP 1 : 3700
ETHUST trade ideas

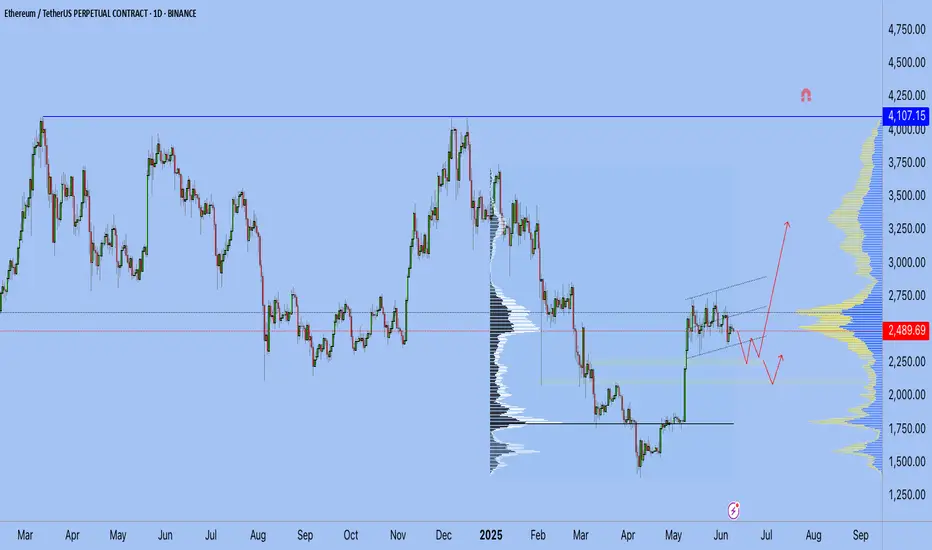
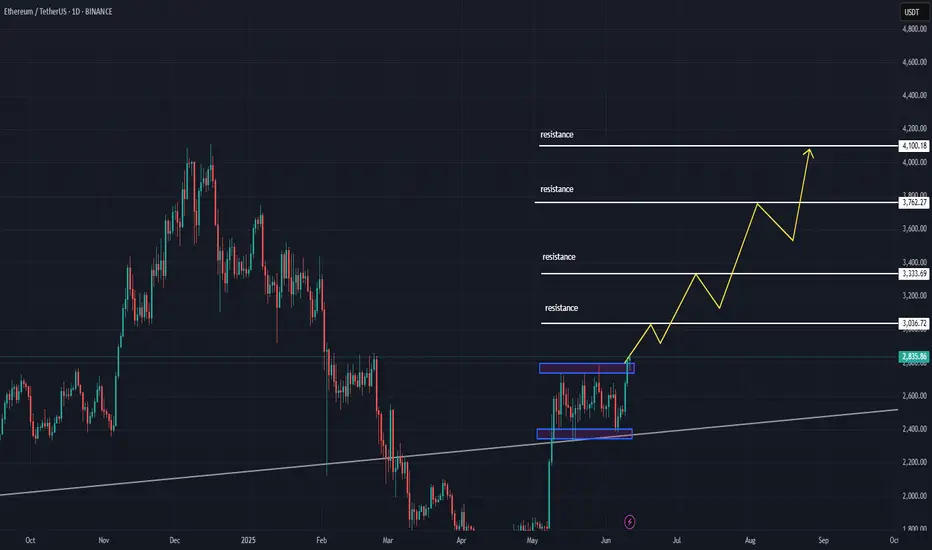
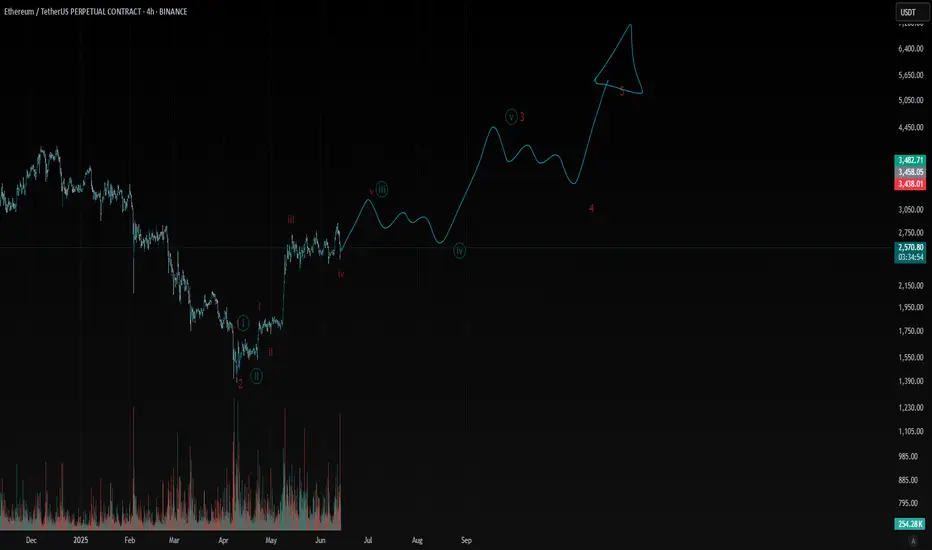
ETH update 9.06.2025Hello everyone, many of you asked me to publish my vision for ETH.
Here you go!
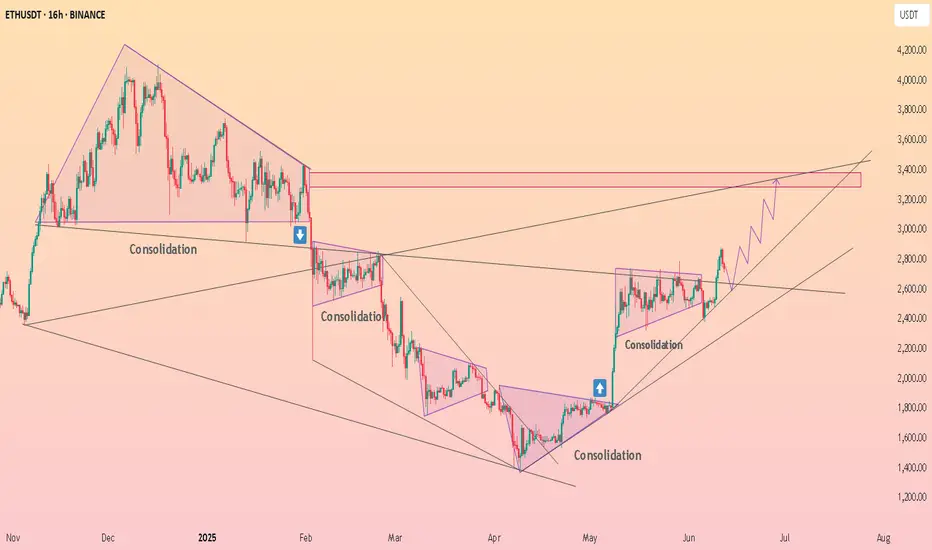
I believe that the previous impulse movement was only the first upward movement, and now we are in a sideways correction movement — call it what you will, but the fact is that the exit from this flat will be upward.
1. End of the year
2. ETH is accumulating on the Onchain
3. Liquidity overflow from BTC can be seen on the ETHBTC chart, and the overflow began at the very bottom
4. What else can large conservative players accumulate?
5. We are going after liquidity from above and should break 4100 by September
Best Regards EXCAVO
Ethereum's Price Action Reveals A Bullish Bitcoin, $8,513 Next!The strongest possible bullish signal has been confirmed. Ethereum just moved daily above MA200. This is the first time this happens coming from a low point since November 2024, this is massive.
This signal reveals two things: (1) Bitcoin is bullish and set to continue growing. You've never seen Bitcoin and Ethereum going in different directions. If Ethereum is set to continue up, Bitcoin will also do the same. The market is one. (2) Ethereum is now ready to grow for 6 months straight, minimum, and this opens the doors for $5,790 followed by $8,513 in this bullish wave. There can be more of course.
This is one of the strongest signals (MA200) but also one of the easiest to spot. It works with high accuracy, never fails. The market is bullish when the action happens above this indicator long-term.
So now you know, for sure—for certain, what will happen next. Knowing that Ethereum will be trading above $5,000 soon, how are you going to maximize profits from this knowledge? Do what it takes to increase your profits and trading success. This is the opportunity of a lifetime, it can be life changing.
Thank you for reading.
I am wishing you tons of profits, great luck and amazing success.
Namaste.

ETH Distribution pt.2It seems like the distribution model i was watching is about to get finished. I will wait for more confirmations in case it wants to go higher or deviate one more time.
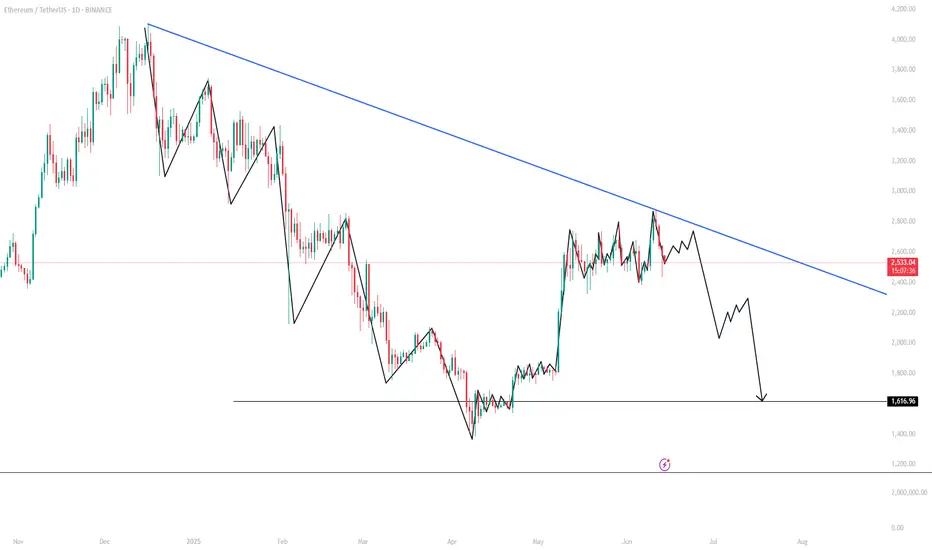
Where is Ethereum's target? (1D)This analysis is an update of the analysis you see in the "Related publications" section
The previous analysis has expired, and the price moved up without any correction. This type of movement is usually intended to attract liquidity, and once liquidity is absorbed, the price often goes through a correction.
From the point where we placed the green arrow, Ethereum has entered a bullish phase.
It now appears that we are in wave B of this bullish phase. The price may get rejected from the red zone.
Price can be rejected from the red box.
Do not enter any positions without confirmation, as the price may even continue moving up to the top of the red box.
For risk management, please don't forget stop loss and capital management
When we reach the first target, save some profit and then change the stop to entry
Comment if you have any questions
Thank You

ETHUSED TREND WEAKER Price has been ranging between approximately 2500 and 2900 and the major trend is strongly bearish.Price recently attempted to break above previous highs but got rejected. Price is at a critical support level in a larger range structure. A break below 2500 could lead to a deep correction correction
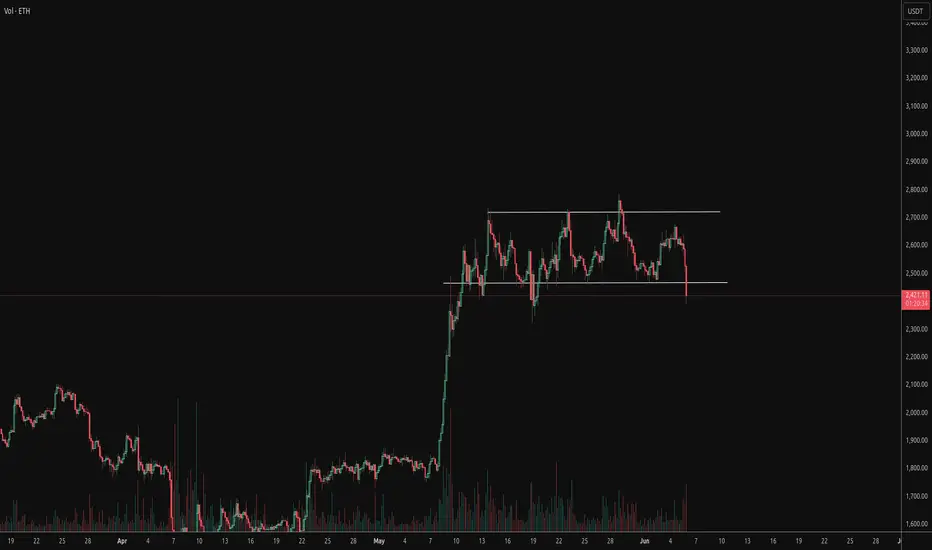
ETHUSDT - Rare Flat Range + Potential Wyckoff SpringUnusually flat range – ETH has spent -30 days- oscillating between ≈ $2 470 (support) and $2 780 (resistance). Tight “boxes” of this length are uncommon in crypto and often precede explosive moves.
Spring attempt – Price just dipped below the range low on elevated volume. If it snaps back inside, Wyckoff theory calls this a Spring (Phase C of Accumulation).
Liquidity grab – The wick beneath support flushed late longs & triggered stops, handing larger players cheap inventory—classic shake-out behavior.
Confirmation Criteria
Volume Reclaim on high buy volume
Retest Behavior Low-volume retest into $2,470 = healthy
Structure 1H higher low (HL) during reclaim
Sentiment Perps short-heavy = fuel for squeeze
HolderStat┆ETHUSD above the consolidation zoneCRYPTOCAP:ETH
→ Basing above 2 400 while probing triangle apex
↳ Crack 2 550–2 600 for runway to 2 850–3 150
⇢ Trend guard sits at 2 650 → 2 500
⤴ Close < 2 650 drops Ether back into old range
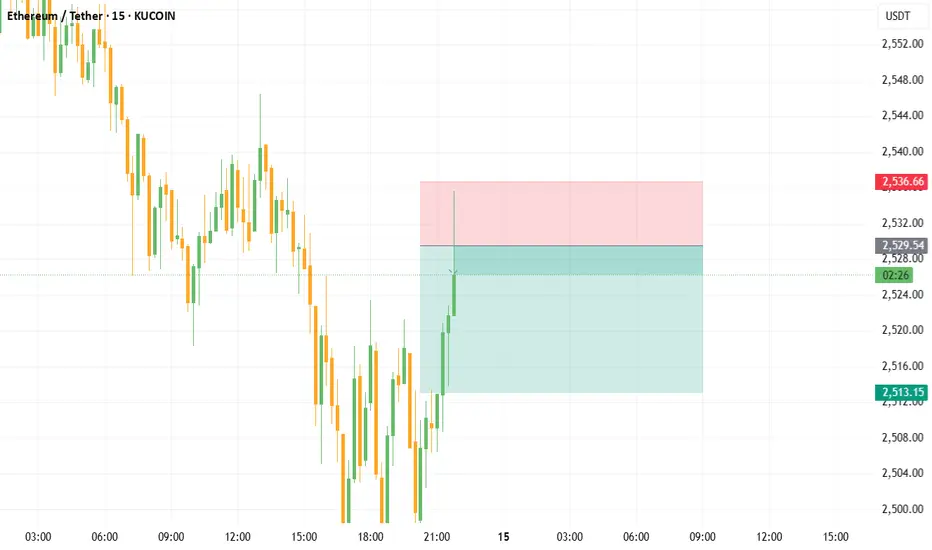
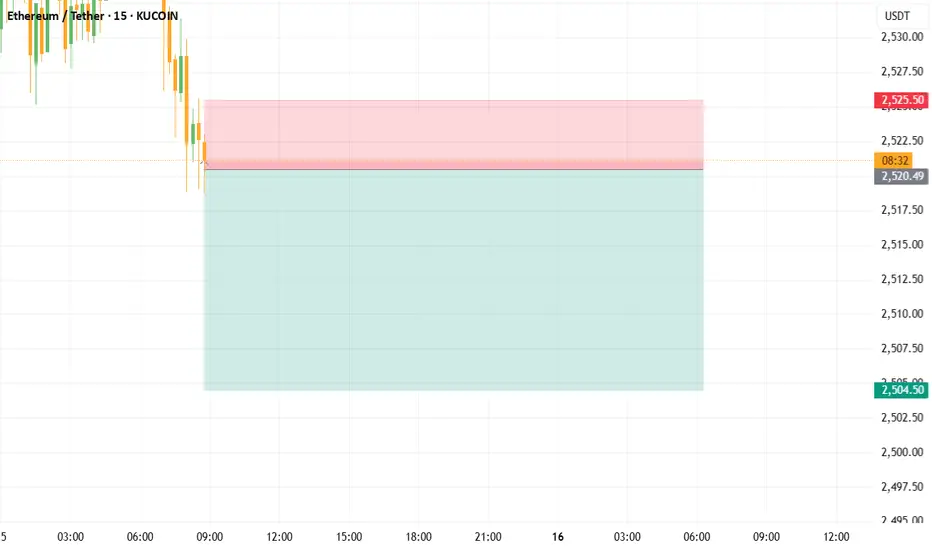
ETH/USDT Scalping Signal of the DayDirection: Empty
Entry Range: 2523 ~ 2528
Take Profit Target: 2508, 2501
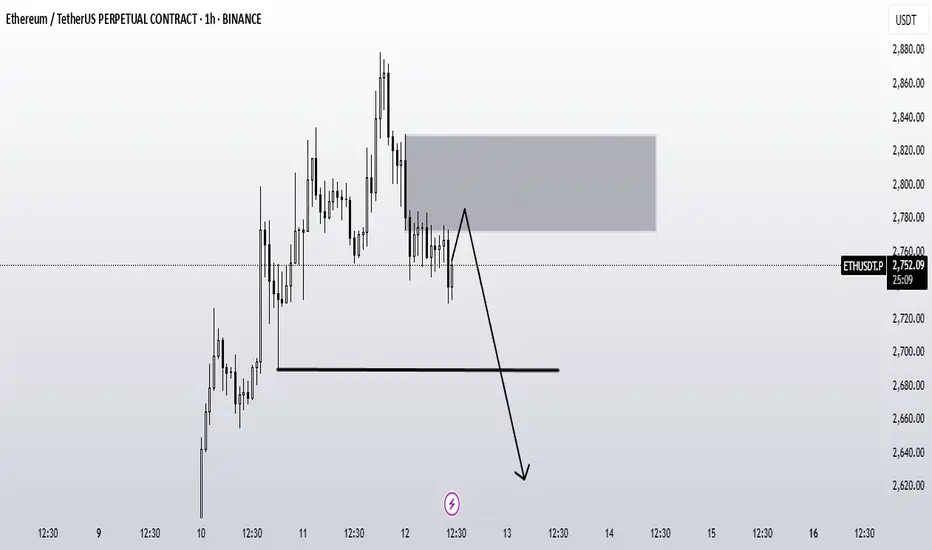
ETHUSDT.P H1 : Short-Term CorrectionBy analyzing the 1-hour timeframe, we can see that the price may drop from the 2780–2820 zone down to 2600
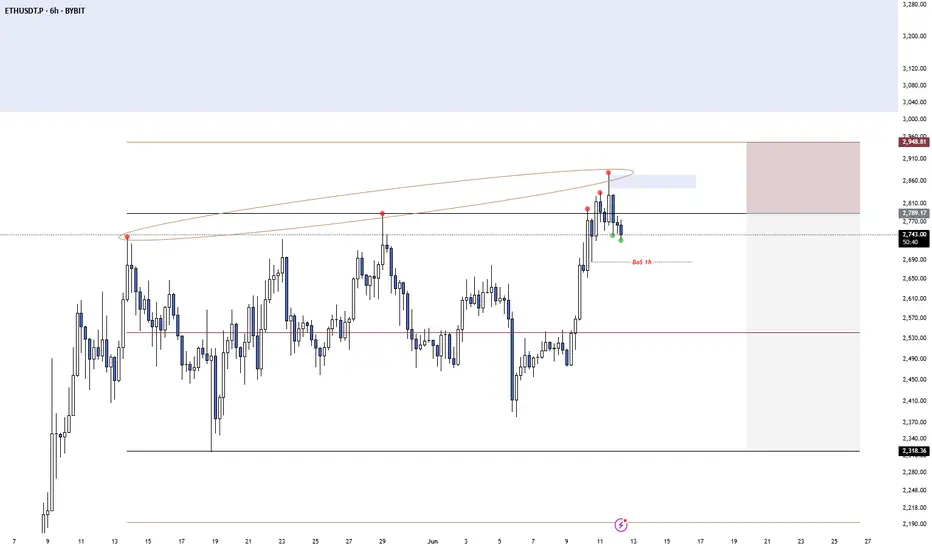
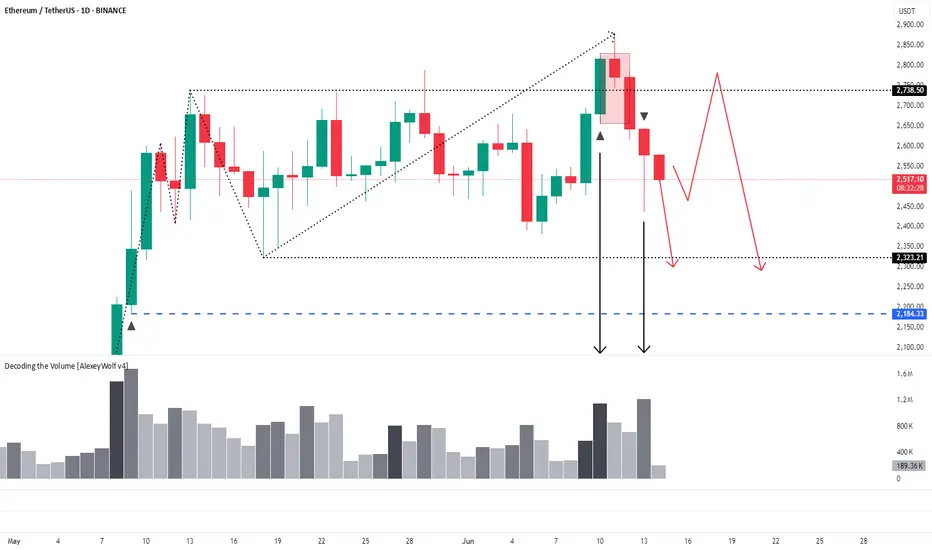
Ethereum. Daily Timeframe. Seller initiativeHey traders and investors!
📍 Context
• Market phase: Sideways range
• Current control: Seller initiative
📊 Key Price Action:
The price broke above the upper boundary of the range (2738) with a buyer KC candle, touching the 50% retracement level (2874) of the last weekly seller initiative (1).
However, the seller absorbed the buyer’s candle and pushed the price back inside the range (2), forming an IKC candle (3) — the highest volume candle within the seller’s initiative.
This sequence presents three bearish signals that support a potential continuation to the downside.
🎯 Trade Idea
Likely scenario: price tests the lower boundary of the range at 3,323.
🔸 In the meantime, it’s reasonable to look for short setups on lower timeframes within the current seller initiative.
🔸 If price reaches 3,323 and valid buyer patterns appear, this zone may offer a good opportunity for long entries.
This analysis is based on the Initiative Analysis concept (IA).
Wishing you profitable trades!
ETH Bullish Setup: Pullback to 200_SMA(D) May Launch Next Rally Ethereum ( BINANCE:ETHUSDT ) seems to have finally managed to break the Resistance lines and the 200_SMA(Daily) in the fifth attack . However, the number of Resistance lines inside the Heavy Resistance zone($2,929_$2,652) is high, and Ethereum will find it difficult to break through them.
In terms of Elliott Wave theory , it seems that Ethereum is completing microwave 4 , and we should wait for this wave to complete. Microwave 4 could act as a pullback to the resistance lines and 200_SMA(Daily) .
I expect Ethereum to start rising from the Support zone($2,745_$2,650) again and rise to at least the Potential Reversal Zone(PRZ) .
Note: If Ethereum touches $2,537 , we can expect further declines.
Please respect each other's ideas and express them politely if you agree or disagree.
Ethereum Analyze (ETHUSDT), 1-hour time frame.
Be sure to follow the updated ideas.
Do not forget to put a Stop loss for your positions (For every position you want to open).
Please follow your strategy and updates; this is just my Idea, and I will gladly see your ideas in this post.
Please do not forget the ✅' like '✅ button 🙏😊 & Share it with your friends; thanks, and Trade safe.

ETHUSD – Strong Bullish Signals on Daily ChartETHUSD – Strong Bullish Signals on Daily Chart
Ethereum is showing renewed bullish momentum on the daily chart after rebounding strongly from the $2,700 support zone and breaking into the key resistance area at $2,835–$2,845. This breakout confirms buyer strength and opens the door for a continued move higher.
The MACD has made a bullish crossover, signaling a shift in momentum.
RSI is climbing above 55, indicating increasing buying pressure with room to run before overbought territory.
A golden cross has formed on the daily chart (50-day MA crossing above 200-day MA), supporting the bullish outlook.
Volume is picking up on green candles, suggesting strength behind the move.
Key Levels:
Support: $2,700
A daily close above $2,845 with strong volume would confirm bullish continuation and open the path toward $2,920, then $3,030 and beyond.
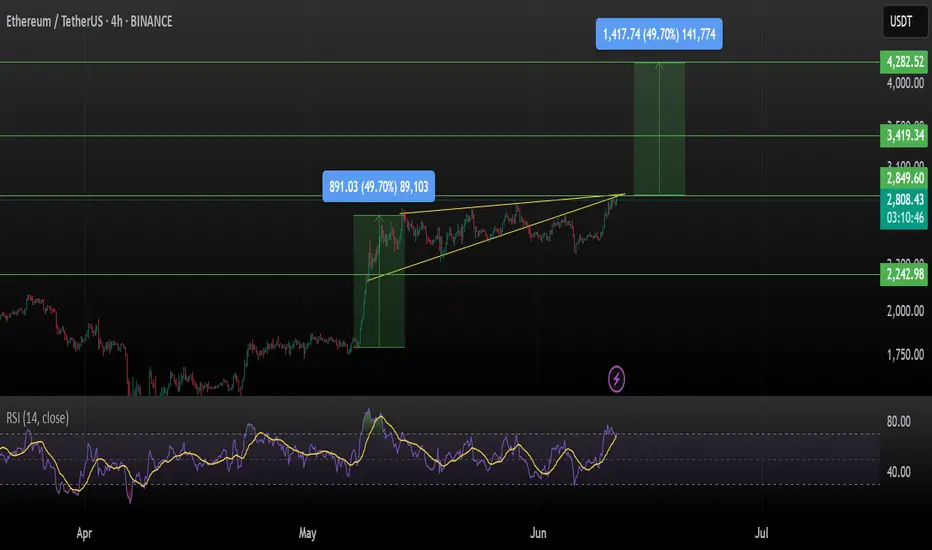
Ethereum (ETH/USDT) – Ascending Triangle Breakout Incoming?ETH is pressing against the upper resistance of a long-forming ascending triangle on the 4H chart — historically a bullish continuation pattern.
Previous Move:
Last breakout saw a +49.7% move, and the structure suggests we could see a similar surge again!
Key Levels:
Support: $2,242.98
Breakout Zone: $2,850
Resistance/Target 1: $3,419
Major Target 2: $4,282 (+49.7%)
RSI: 70.5 — strong momentum, near overbought but in breakout territory.
Volume seems to be increasing near resistance, a breakout could be imminent.
Potential Upside: +49.7% if triangle breaks cleanly.
Bias: Bullish
Timeframe: 4H
Watch for: Rejection at $2,850 or breakout retest for entry confirmation.
This is not financial advice, please do your research before investing, as we are not responsible for any of your losses or profits.
Please like, share, and comment on this idea if you liked it.
#ETH #Ethereum #ETHUSDT
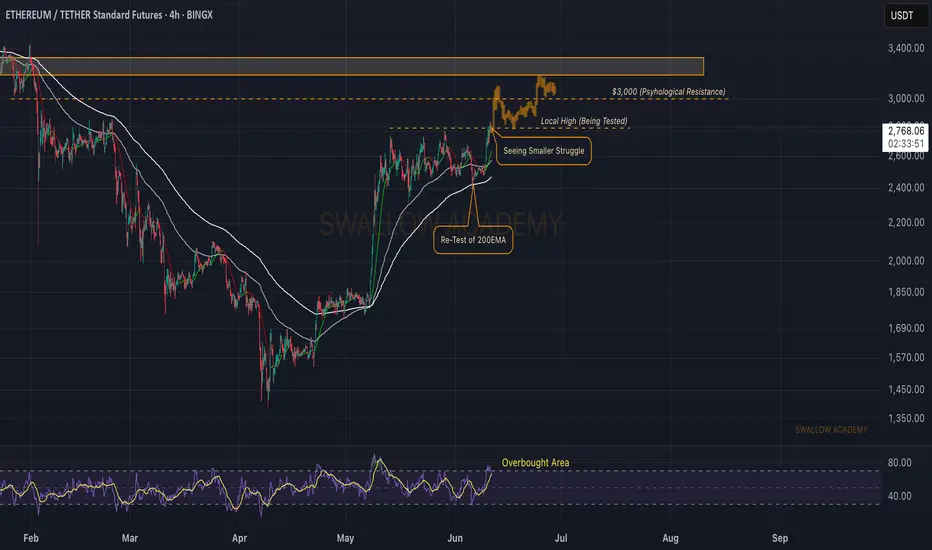
Ethereum (ETH): Targeting $3,000-$3,300Ethereum is still pushy near the local high area, where we are looking for a breakout to happen. Meanwhile, nothing much has changed since yesterday, but what we see is that pressure is pretty big (from bulls), so $3,000-$3,300 can be reached easily if we keep the same momentum on!
Swallow Academy
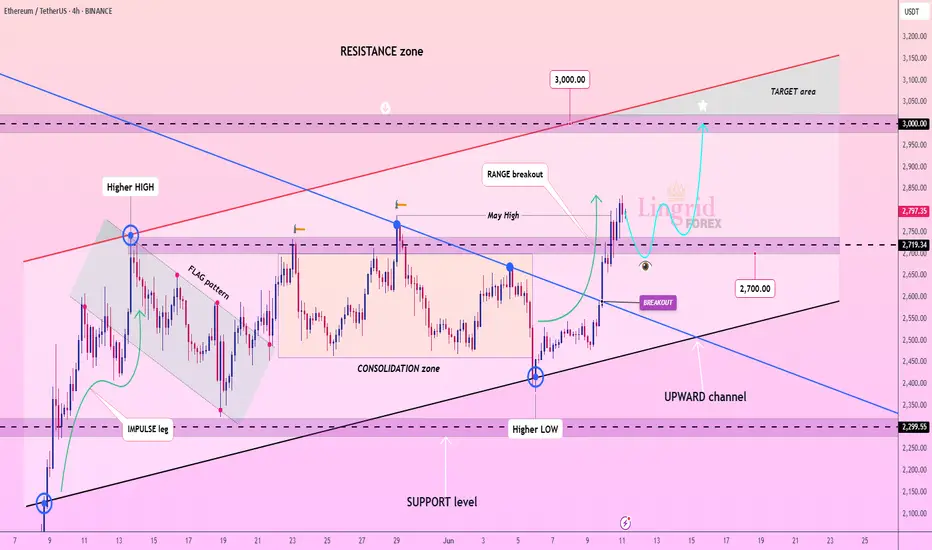
Lingrid | ETHUSDT May High Test - Continuation SetupThe price perfectly fulfilled my last idea . BINANCE:ETHUSDT has broken out of a long-standing consolidation zone and is now retesting the breakout area near 2719, which aligns with the May high and the downward trendline. Price is maintaining its position above the upward channel, showing a bullish structure with potential for continuation. A successful retest here may launch the next leg toward the 3000 resistance.
📈 Key Levels
Buy zone: 2680–2720
Buy trigger: bounce from 2719 with bullish engulfing
Target: 3000
Sell trigger: drop back below 2680
💡 Risks
Failure to hold the breakout could trap longs
Low volume during retest increases breakdown chances
3000 psychological resistance may cause premature rejection
Traders, if you liked this idea or if you have your own opinion about it, write in the comments. I will be glad 👩💻
Ethereum (ETH) is still looking bullish"Spring" breakout, retest of the range low. Textbook price action on ETH!
ETH: Next ATH on the Horizon? My Elliott Wave Analysis Says YESMy latest Elliott Wave count on TradingView points to a significant bullish impulse for ETH, suggesting we're gearing up for a fresh All-Time High! The wave structure looks clean, indicating strong momentum ahead.
Check out my chart and let me know your thoughts on this potential move!
#ETH #ElliottWave #TradingView #ATH #Crypto #MarketAnalysis #Bullish
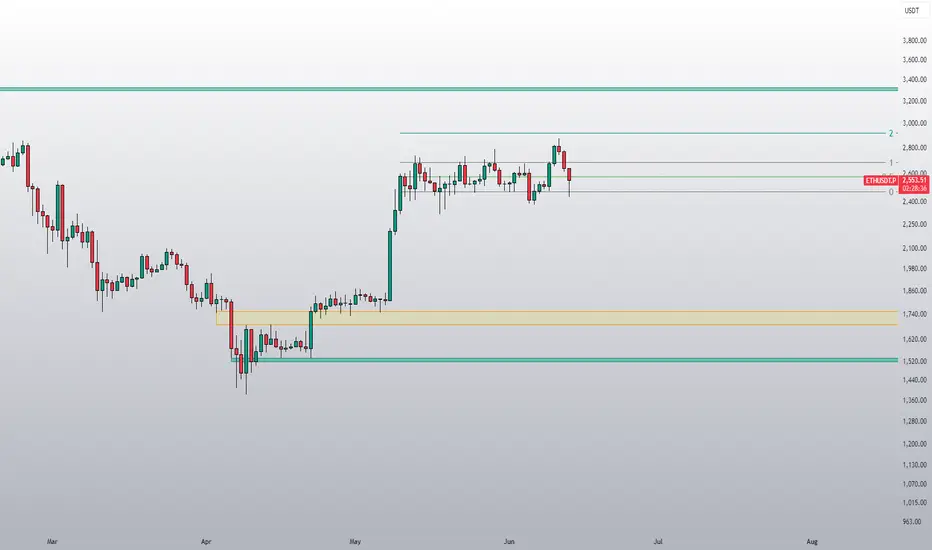
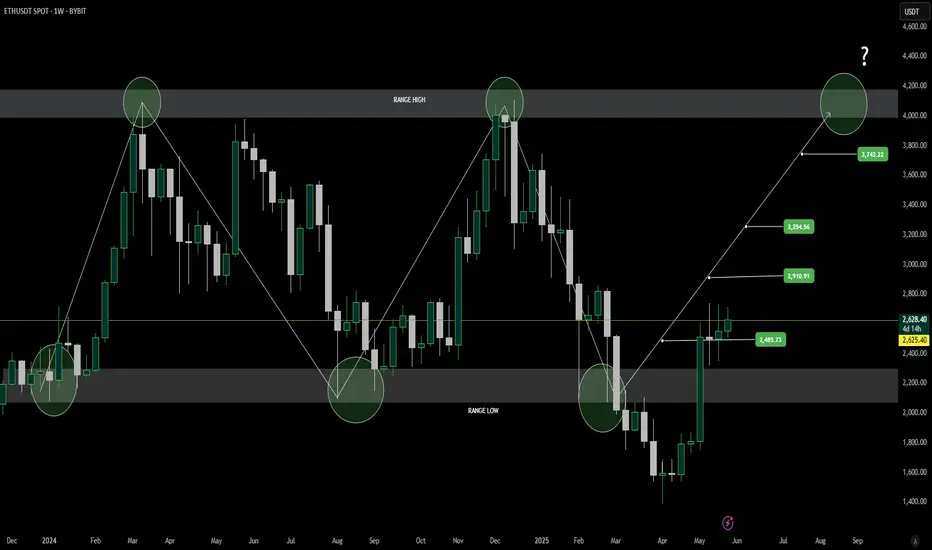
Ethereum (ETH) Weekly Outlook: Momentum Builds After Range BreakEthereum’s weekly chart continues to follow a well-defined trading range, oscillating between its historical range lows and highs. Recently, ETH closed decisively above the $2,200 level, marking a key structural break and reinforcing bullish sentiment. This move has already led to the first upside target at $2,484 being successfully hit.
Historically, Ethereum has shown a cyclical range-bound pattern — bouncing from the range low and encountering resistance at the top. With the lower boundary now acting as support and the first resistance target cleared, ETH may be entering a momentum phase with eyes on higher resistance levels.
The next major targets to watch are $2,910, $3,254, and $3,743, with $4,200 remaining the critical breakout level. A close above this zone could trigger a strong bullish continuation, potentially entering a new price discovery phase. However, failure to push past these upper resistance levels could see Ethereum revert to its range-based behavior.
The recent price structure, combined with strengthening weekly closes, provides confidence for bulls — but confirmation at each stage remains vital. Traders should monitor volume surges, price reactions at resistance, and macroeconomic catalysts that could affect sentiment.
As always, disciplined risk management is essential as Ethereum navigates these key technical zones. With a breakout above $2,200 confirmed and the first target reached, the market may be gearing up for its next move — and it's one worth watching closely.
ETH long chanceHello everyone...
Welcome to my channel!
If you liked the analysis below, hit the rocket button.
Let's dive into the Ethereum analysis on the 4-hour time frame.
What are we waiting for right now?
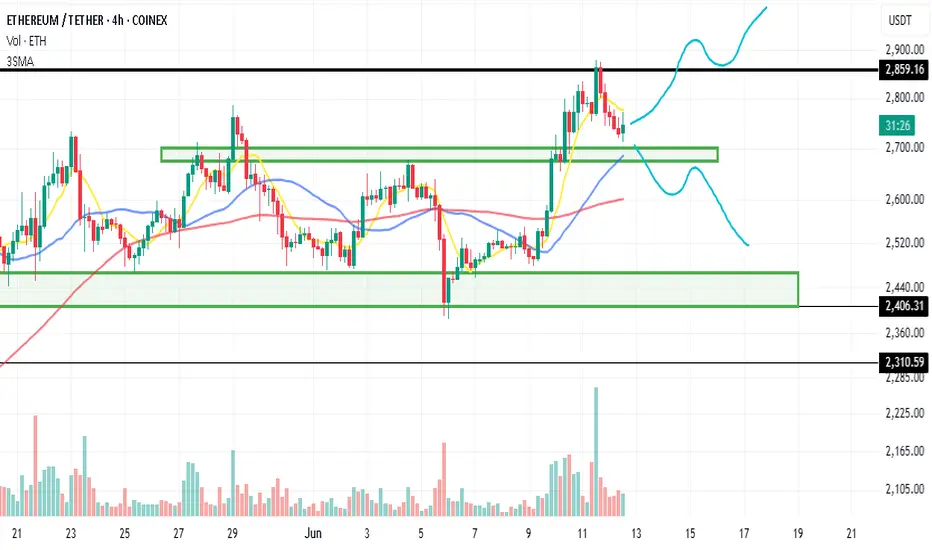
We are waiting for the 2874 level to break with good volume, so we can enter a long position with proper risk management. It is worth noting that there is a chance of a fake-out, so either use a large stop-loss below the 2310 level, or a smaller stop-loss with a small risk-to-reward ratio. If you're using a smaller stop, make sure to lock in profits sooner.
The green boxes you see in the image indicate the strong presence of buying makers who have established solid support in these areas. If the buyers fail at the 2700 area, we may need to focus more on the bearish scenario.
Hitting the rocket and sharing your comments motivates me.
Stay profitable!
ETH/USDT 4HOUR CHART UPDATE !!ETH/USDT – 4H Chart Update
Ethereum is trading near an ascending channel's upper boundary, around the $2,790–$2,800 area. This level has historically acted as strong resistance, and we are seeing early signs of price hesitation.
ETH is testing the top of the channel. Rejection from this area could lead to a reversal towards the lower channel trendline near $2,450–2,500.
First Support: $2,600–2,620 (25MA and 100MA area).
Deep Support: $2,450 (Channel Bottom).
Strong Demand Area Below: $2,050–$2,150 (highlighted yellow box).
Moving Averages:
The 25MA (black) and 100MA (purple) are currently bullishly aligned.
Thanks for your support!
DYOR. NFA

ETHUSD I Weekly CLS I Model 1 I Target CLS LowHey, Market Warriors, here is another outlook on this ETH , Im already in at 2647.73, lets go !!
If you’ve been following me, you already know every setup you see is built around a CLS Footprint, a Key Level, Liquidity and a specific execution model.
If you haven't followed me yet, start now.
My trading system is completely mechanical — designed to remove emotions, opinions, and impulsive decisions. No messy diagonal lines. No random drawings. Just clarity, structure, and execution.
🧩 What is CLS?
CLS is real smart money — the combined power of major investment banks and central banks moving over 6.5 trillion dollars a day. Understanding their operations is key to markets.
✅ Understanding the behavior of CLS allows you to position yourself with the giants during the market manipulations — leading to buying lows and selling highs - cleaner entries, clearer exits, and consistent profits.
📍 Model 1
is right after the manipulation of the CLS candle when CIOD occurs, and we are targeting 50% of the CLS range. H4 CLS ranges supported by HTF go straight to the opposing range.
"Adapt what is useful, reject what is useless, and add what is specifically your own."
— David Perk aka Dave FX Hunter ⚔️
👍 Hit like if you find this analysis helpful, and don't hesitate to comment with your opinions, charts or any questions.
