ETH GOING TO $4K 1.618 incoming
Looks like we are heading to the right direction after CPI reports 2.4% =0.024 Dovish
ETHUST trade ideas
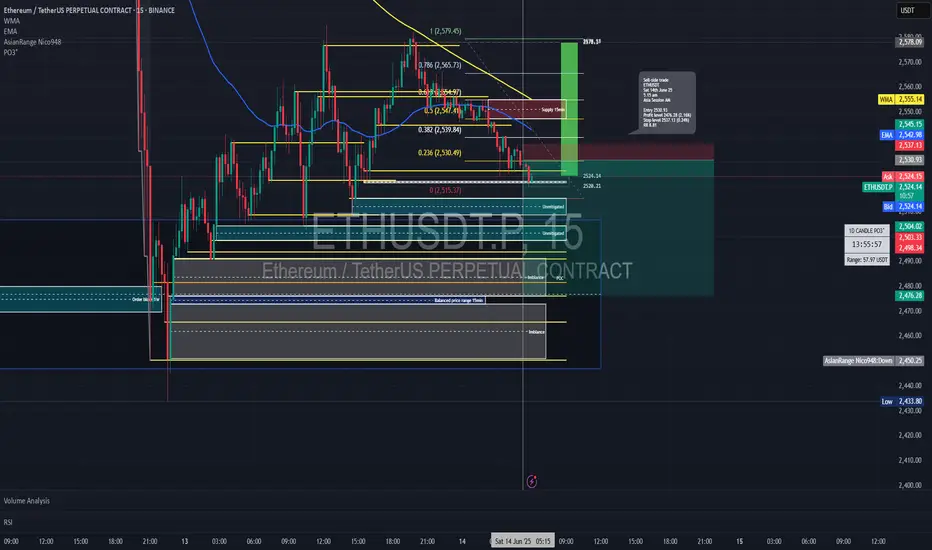
Short trade Sell-side trade
ETHUSDT
Sat 14th June 25
5.15 am
Asia Session AM
Entry 15min TF
Entry 2530.93
Profit level 2476.28 (2.16%)
Stop level 2537.13 (0.24%)
RR 8.81
Sell-side trade idea narrative based on the ICT seek and destroy indicator, taking session liquidity into account for directional bias, along with unmitigated price zones and imbalanced price ranges for confluence.
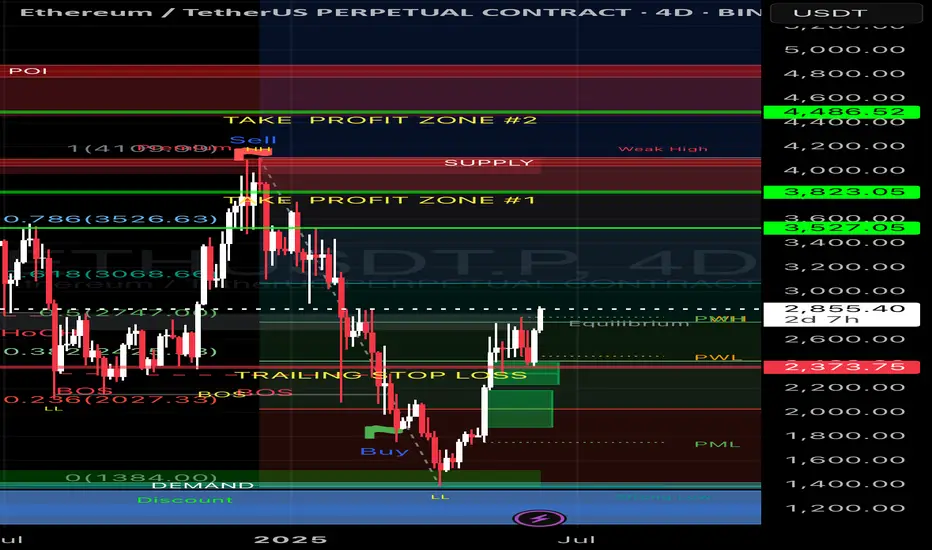
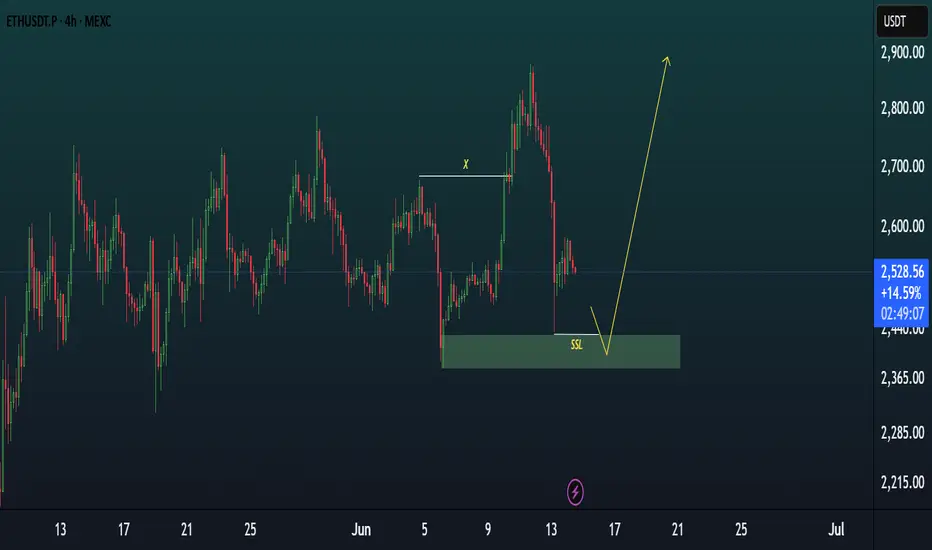
ETH LONG TRADE PLAN.ETH long below the liquidity line in demand zone. Below sell side liquidity is our entry zone.
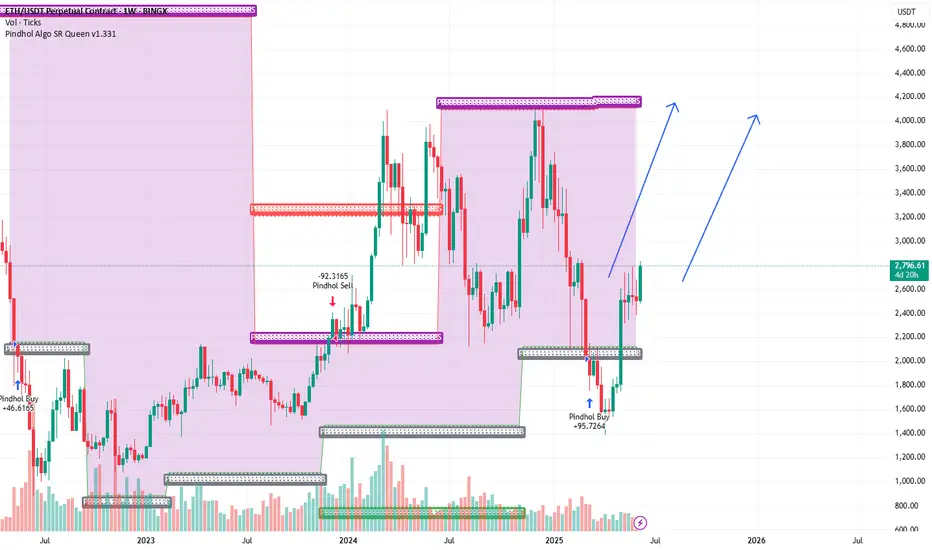
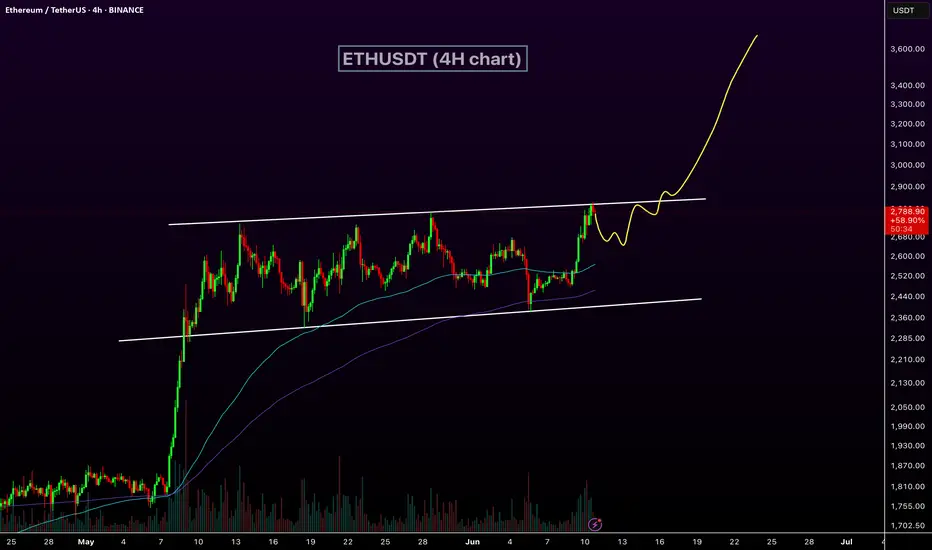
$ETHUSDT finally ready to break out of weekly range and rally!!!BINANCE:ETHUSDT seems to be ready to break out of its range that has lasted for over a month. So if it properly breaks out from this range and retests the resistance zone which tends to turn to support zone afterwards, it will likely head to the next resistance zone around $4000.
Kindly support this post to help reach other people and do comment your thoughts about the setup.

ETHEREUM Short Position Update – June 11, 2025We are the SeoVereign Trading Team.
With sharp insight and precise analysis, we regularly share trading ideas on Bitcoin and other major assets—always guided by structure, sentiment, and momentum.
🔔 Follow us to never miss a market update.
🚀 Boosts provide strong motivation and drive to the SeoVereign team.
--------------------------------------------------------------------------------------------------------
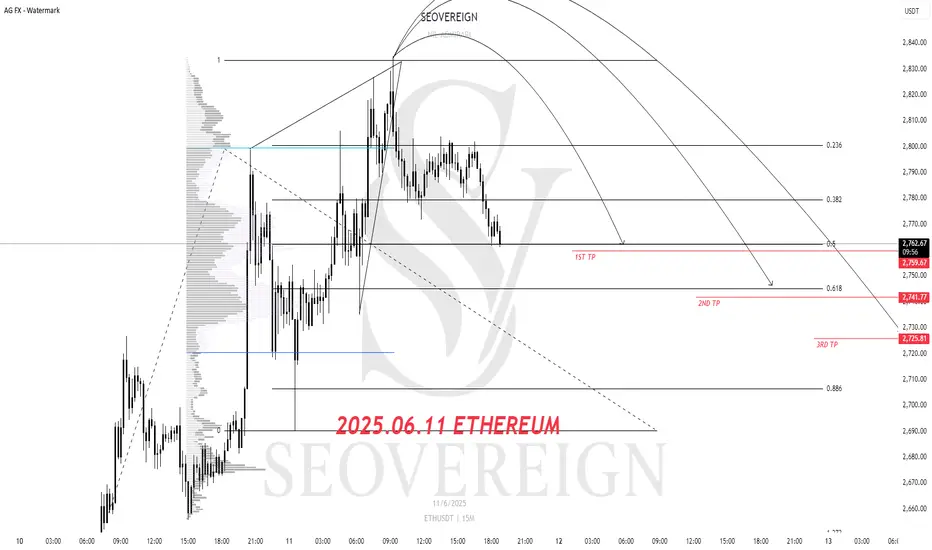
Ethereum downside perspective shared.
Recently, Ethereum has been continuously setting new highs, showing strong upward momentum. However, from a technical analysis standpoint, a breakdown below the lower trendline and an exit from a converging wedge pattern have been observed.
This suggests the potential for a short-term cooling-off phase, prompting the sharing of a bearish idea.
The first target is set at 2,771.
While Ethereum and the broader market continue to reach new highs, I personally believe a corrective phase may be approaching.
Detailed ratio analysis and further reasoning will be shared through an idea update once the first target is reached.
Flexible response according to market conditions is essential.
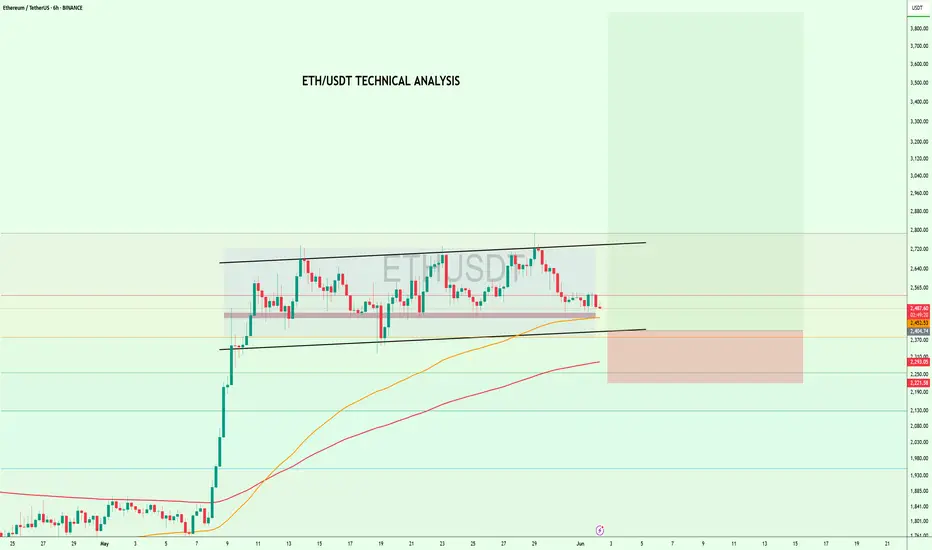
Ethereum Set for a Massive Pump!ETHUSDT Technical analysis update
ETH price has been trading within a channel pattern for the past 30 days, with the 100 and 200 EMA acting as strong support on the 4H chart. Therefore, the likelihood of the price dropping below the 100 and 200 EMA on the 4H chart is very low. Once the price breaks above the channel resistance, we can expect a strong bullish move in CRYPTOCAP:ETH
BITSTAMP:ETHUSD
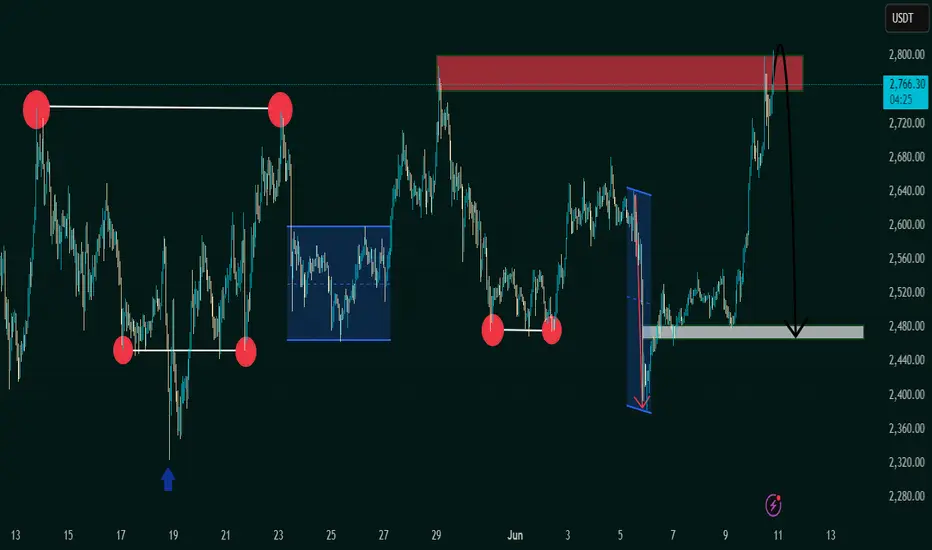
"Bearish Reversal Opportunity Following Supply Zone Rejection"1. Double Top Formation (Resistance Level Identified)
The chart displays a clear double top structure at the 2,760–2,800 USDT level.
This level has acted as a strong supply zone (highlighted in red), where price previously reversed, indicating heavy selling interest.
Current price action has retested this resistance zone and shown signs of rejection.
2. Liquidity Sweeps & False Breakouts
On the left side of the chart, an aggressive downward wick (marked with a blue arrow) suggests a liquidity sweep below a key low before strong bullish momentum returned.
This type of price action indicates smart money involvement, designed to remove weak hands before pushing price higher.
3. Accumulation Phases (Sideways Consolidation)
Multiple accumulation ranges are highlighted with blue rectangles.
These ranges show horizontal consolidation, where price builds up energy before breakout.
The most recent breakout led to a vertical rally toward the resistance zone, signaling an end of the accumulation and a start of distribution.
4. Double Bottom Support Structure
Identified near the 2,480 level, marked by red circles.
This level has historically acted as demand/support, evidenced by multiple bounces from this price zone.
Now highlighted with a grey zone, it is projected to act as the next key support area.
5. Bearish Projection
A large black arrow suggests a forecasted bearish move from the current high (~2,800) back to the support zone (~2,480).
This aligns with the idea of a mean reversion or pullback after a strong bullish impulse.
---
Conclusion & Trade Idea:
🔻 Bias: Bearish (Short-term)
The chart presents a classic reversal pattern with a double top at a well-defined supply zone.
Entry could be considered after confirmation of rejection from this level.
🧠 Trade Plan Suggestion:
Entry: Short near 2,780–2,800 after bearish confirmation (e.g., bearish engulfing candle or break of structure).
Target: 2,480 (support zone).
Stop Loss: Above 2,820 (recent high).
Risk-Reward: Approximately 1:2.5 or better depending on execution.
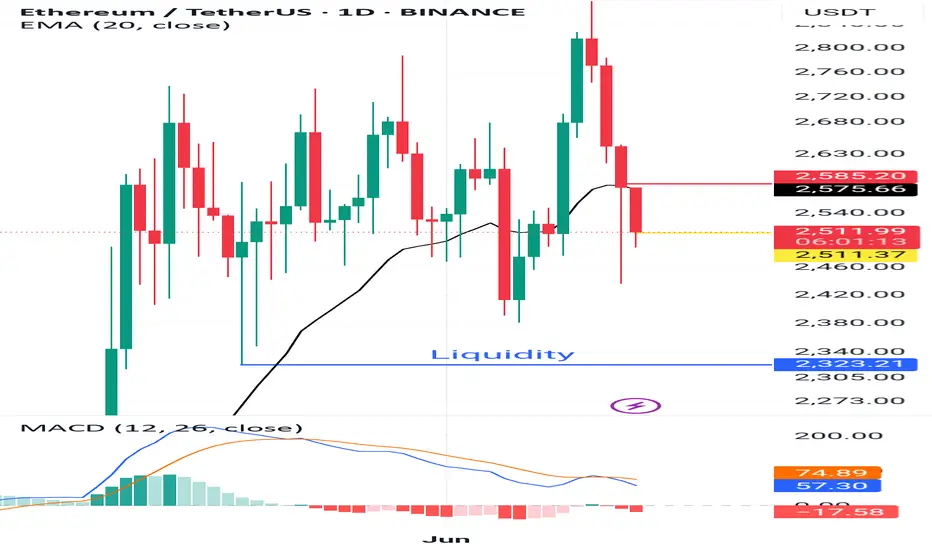
ETH rang is being respected. ETH is holding strong within range. As long as the price stays in range, a bullish bias is supported. If the price breaks below, there is a volume gap sub 2k. Be ready with the plan.
Full TA: Link in the bio
Ethereum Testing Channel Support – Big Move Loading#Ethereum Update
CRYPTOCAP:ETH is still moving inside a rising channel and currently testing the support zone around $2,480–$2,500, aligned with the 50 EMA.
If this level holds, Ethereum may bounce back toward the upper channel, with the potential to retest $2,720+.
Accumulation in these levels 2540, 2403, 2388 with stop loss of $2,220
This zone is critical.
Price action here will decide the next big move. 👀
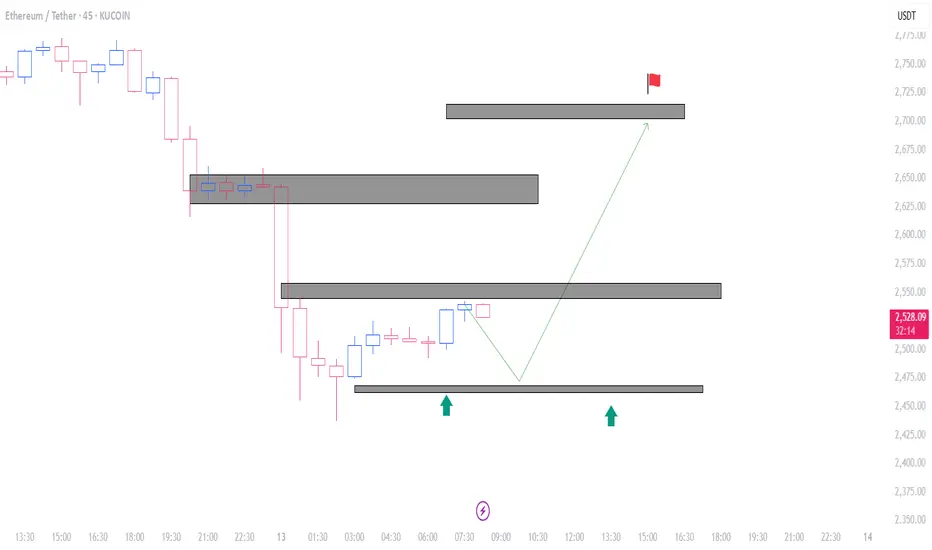
eth in 45minas you can see we have a bullish trend and strong support for eth.the price will go up and push for orders in higher price.follow me for more....
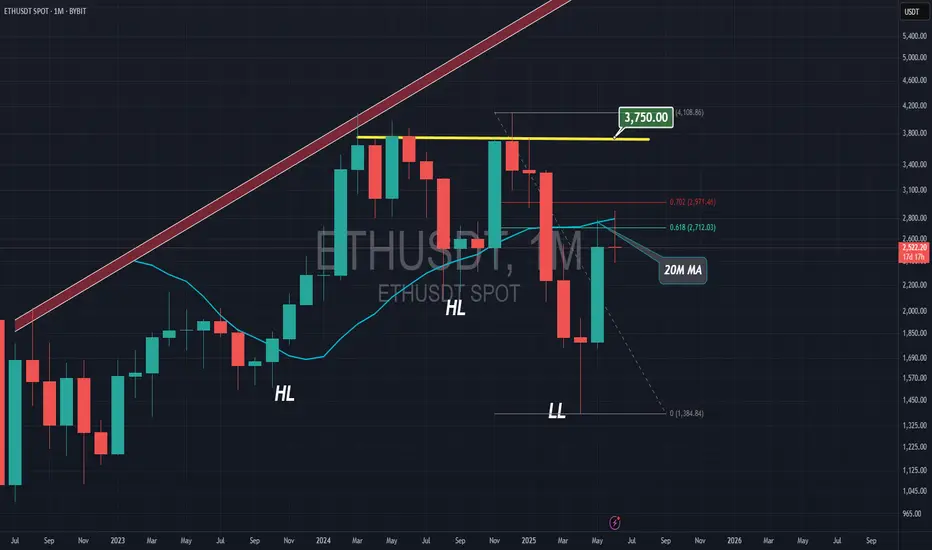
Ethereum VS $2800The 20MA on monthly timeframe for Ethereum is still working as a strong resistance, and Ethereum is running out of time to break it.
Maximum June or July..
Ethereum (ETH/USDT) Breakout Watch ! Hello traders here is KingPro's analysis on Ethereum
📈ETH is at the critical resistance level strong closing above it could tiger a bullish move.
Current Price: $2,628
EMA 70 Support: Price is holding above the 70-period EMA ($2,577), showing bullish structure.
Support Zone: The area around $2,320–$2,400 is acting as a strong historical support, confirmed multiple times.
Supply Zone: Consolidation occurred near $2,570–$2,620, but price has broken above it — indicating accumulation.
Critical Resistance Area: Around $2,780–$2,800. This is a key level — a breakout above could lead to strong bullish continuation.
Next Target: $2,782.93 – price may retest this resistance as indicated by the projection arrow.
📊 Trade Idea:
If ETH sustains above $2,620 and breaks the short-term channel resistance, a move toward $2,782+ is likely.
🔒 Risk: A breakdown below the EMA or the supply zone (~$2,570) could invalidate the setup.

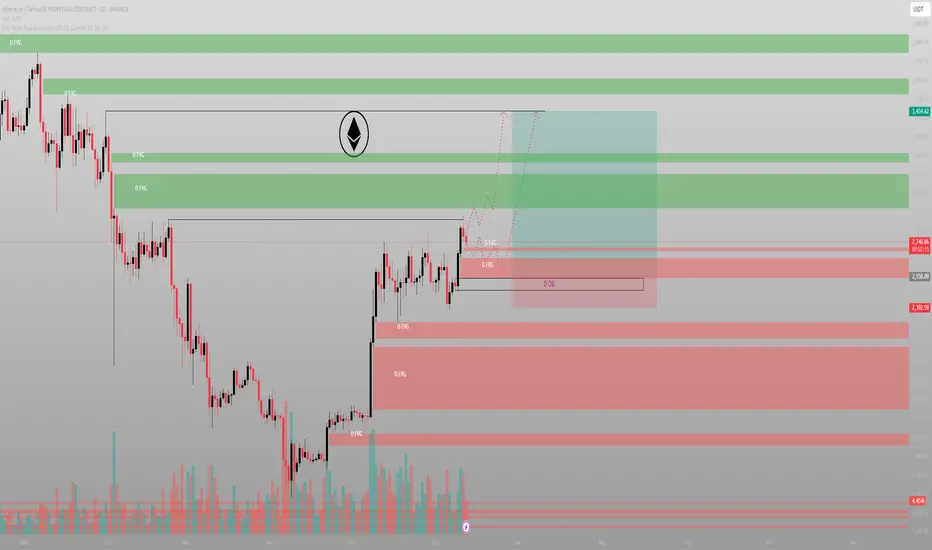
This isn’t a breakout. It’s a setup.ETH has been coiling under this level for weeks. While most watch for breakout confirmation — I’ve already mapped the reaccumulation narrative.
The structure:
Price delivered cleanly off a Daily OB and is now grinding through prior inefficiencies. Multiple D FVGs stack just beneath the current zone — not noise, not gaps — these are algorithmic footprints.
Below price? A refined Daily Order Block at 2558, paired with stacked inefficiencies all the way to 2392. That’s the reload zone if price wants to run it deeper.
But the key here is this: price is compressing under draw-level FVGs. Every candle is building imbalance. Every wick is a test. This isn't weakness — it's staging.
Scenario 1:
Minor pullback into local D FVG cluster
Hold above 2580–2600
Reprice into 3030 FVG
Final objective: 3434 sweep and delivery into premium inefficiency (3650+)
Scenario 2:
Sweep below 2580 into full OB at 2558
Sharp rejection
Acceleration through D FVGs above
Mindset:
You don’t chase moves. You wait where Smart Money builds. This isn’t about predicting pumps — it’s about positioning before they become obvious.
“Structure doesn’t lie. Price just tells you who’s in control.”
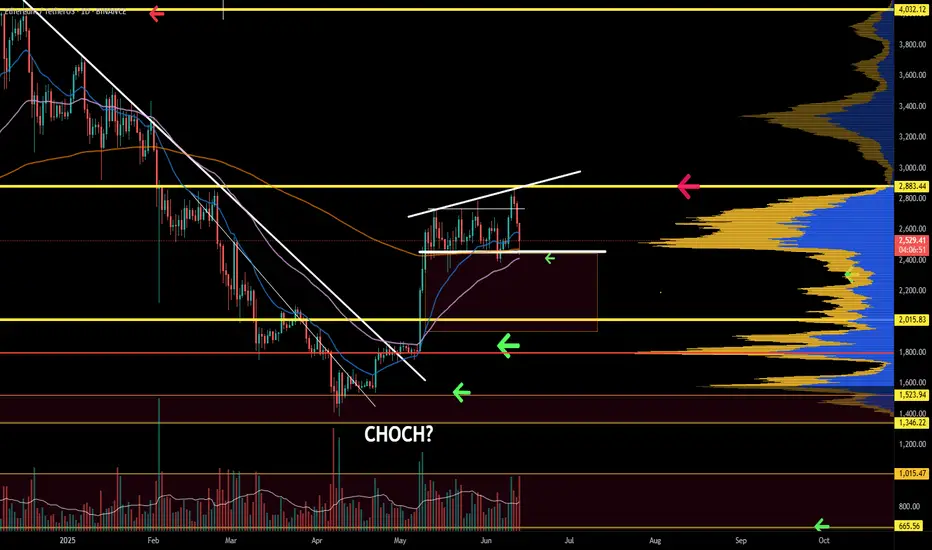
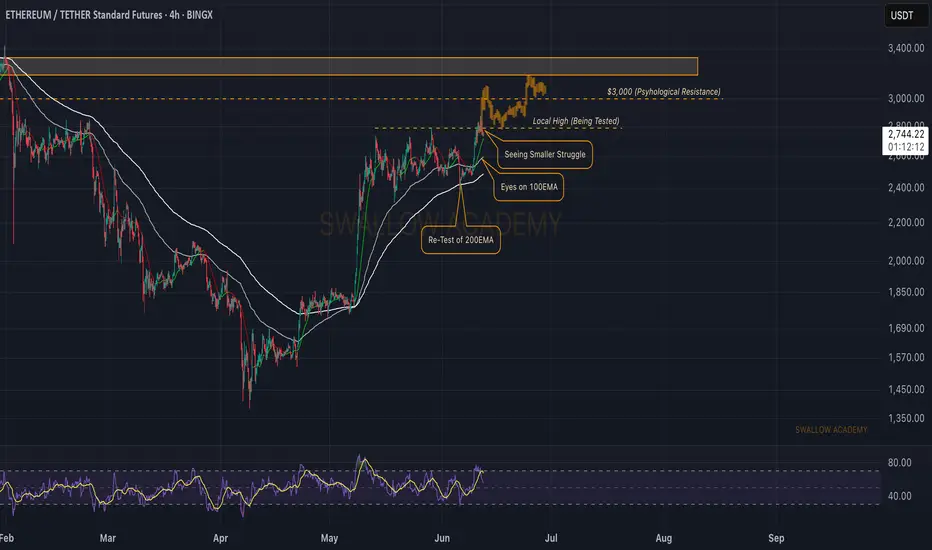
Ethereum (ETH): Important Zone | $3000 IncomingThere are lots of uncertainties near the current area where both buyers and sellers are fighting over dominance near the current zone, as this will determine if we will bounce from here towards our upper targets (above $3000) or if we will retest the first 100 EMA before seeing another bullish movement.
The key zone is the $3000 area, which we have marked as psychological resistance. One way or another, we should reach this zone!
Swallow Academy
"ETH Bullish Heist: MA Breakout Confirmed! Next Stop 3600?"🔷🔹 "THE ETH HEIST: MASTERPLAN TO LOOT 3600!" 🚨💰 (Breakout + Pullback Strategy)
🌟 Yo, Fellow Market Robbers! 🌟 (Hola! Bonjour! Salaam!)
Listen up, Money Makers & Thieves! 🏴☠️💸
Based on the 🔥Thief Trading Style🔥, we’re about to pull off the ultimate ETH/USDT heist—Ethereum vs Tether is our target!
🔪 THE TRADE SETUP (LONG HEIST)
🎯 Entry Signal:
"The heist begins at MA Breakout (2900)! Wait for confirmation, then strike like a pro thief!"
Option 1: Buy Stop above MA (2900) for breakout momentum.
Option 2: Buy Limit on pullbacks (15-30min TF) for sneaky low-risk entries.
📌 ALERT! Set a breakout alarm—don’t miss the robbery!
🛑 Stop Loss (Thief’s Escape Route):
"Yo! If you’re entering on breakout, DO NOT set SL before it triggers! Place it at the nearest swing low (12H TF)—or risk getting caught by the bears! 🐻🔪"
🎯 Profit Target: 3600 (OR Escape Early!)
Scalpers: Only long scalps allowed! Use trailing SL to lock profits.
Swing Thieves: Ride the wave but exit before the cops (bears) arrive!
⚡ WHY THIS HEIST WILL WORK:
Bullish momentum + MA Breakout = Easy Loot!
Overbought? Trap? Reversal? Nah—we escape before the danger zone! (Yellow ATR = High Risk)
📢 THIEF’S WARNING:
🚨 News Alerts = Market Chaos!
Avoid new trades during high-impact news.
Trailing SL = Your Best Friend.
💥 BOOST THIS HEIST!
👉 Hit 👍 LIKE & 🔔 FOLLOW to strengthen our robbery squad! More heists = More profits! 🚀💰
Stay tuned, thieves… Next heist coming soon! 🏴☠️🔥

ETH Road to RecoveryWhile the spotlight often shifts to short-term price action, Ethereum (ETH) is laying the groundwork for structural expansion that could surprise even seasoned investors.

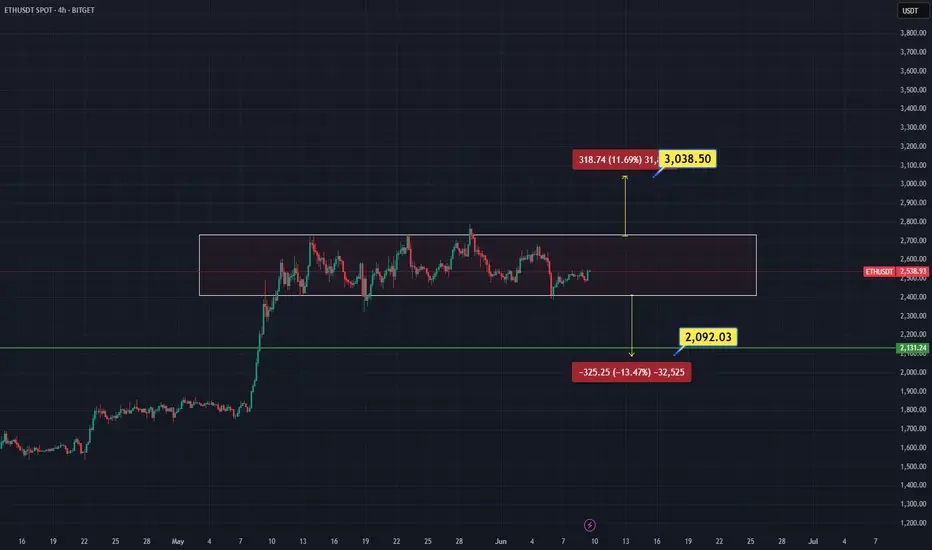
ETH 4HETH managed to pass the box it was moving horizontally upwards and is expected to rise as much as the box size. I expect it to move as I indicated with the arrow sign on the chart.
Bad Time Over for ETH? Second Wave Toward $4,000 Incoming!!🟢 Bad Time Over for ETH? Second Wave Toward $4,000 Incoming
MARKETSCOM:ETHEREUM ( CRYPTOCAP:ETH ) appears to be leaving its consolidation phase behind, and all signs point to a fresh bullish wave. After outperforming Bitcoin in recent days, CRYPTOCAP:ETH has now broken out of a key structure — signaling the potential start of a major uptrend.
We’re also witnessing rising CRYPTOCAP:ETH inflows, suggesting growing investor confidence. This kind of accumulation behavior has historically led to significant rallies. Previously, ETH consolidated between $1700–$1800 before a strong move up. More recently, it ranged between $2400–$2700, and now that it’s broken out, we’re anticipating another powerful leg — possibly the second wave of this trend.
If the current momentum continues, a move toward $4000 looks likely, and with enough strength, even a new all-time high isn’t off the table.
BINANCE:ETHUSDT Currently trading at $2795
Buy level : Above $2750
Stop loss : Below $2305
Target : $4000
Max leverage 3x
Always keep stop loss
Follow Our Tradingview Account for More Technical Analysis Updates, | Like, Share and Comment Your thoughts

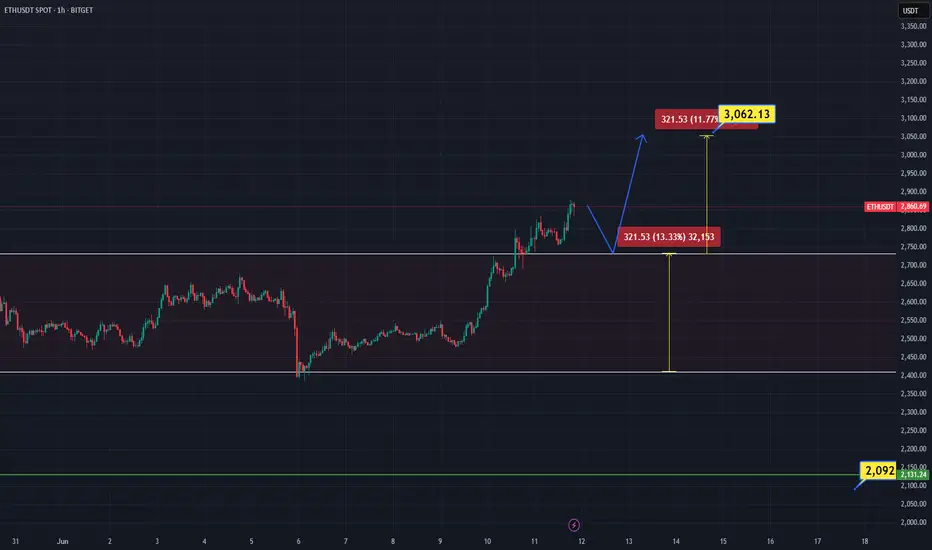
ETH to 3000?price pierced through $2800 decisively yesterday and is now retracing back into the mid 2700s.
Im looking for divergence and reversal patterns on the smaller time frames (intraday) to execute a continuation long.
eth 4h
eth is in the distribution zone and the price is expected to move in the direction it broke out of the box. I have shown the levels it can go to in the graph in which direction it breaks the box. Lots of profits.
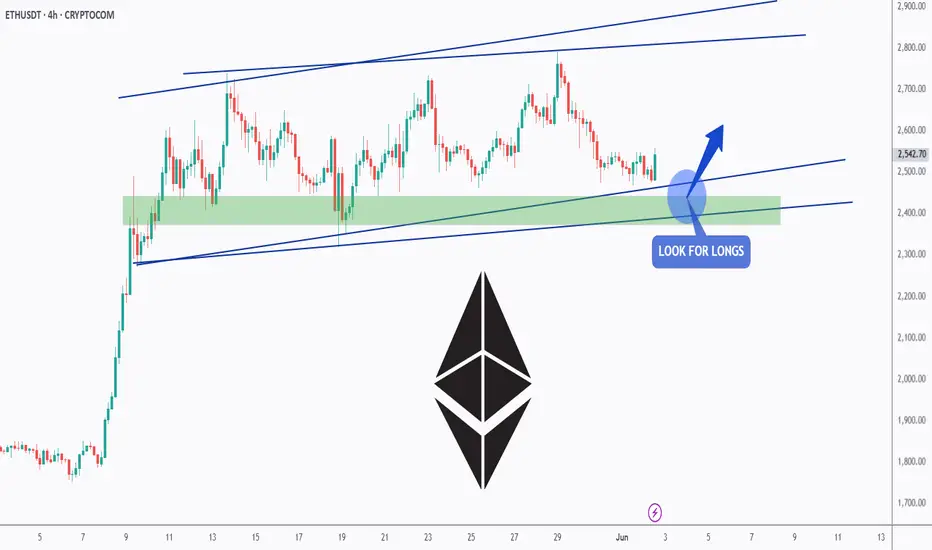
ETH - Finally Support!Hello TradingView Family / Fellow Traders. This is Richard, also known as theSignalyst.
📈ETH has been overall bullish trading within the flat rising channels marked in blue.
Moreover, the green zone is a strong support zone!
🏹 Thus, the highlighted blue circle is a strong area to look for buy setups as it is the intersection of support and lower blue trendlines acting as non-horizontal support.
📚 As per my trading style:
As #ETH approaches the blue circle zone, I will be looking for bullish reversal setups (like a double bottom pattern, trendline break , and so on...)
📚 Always follow your trading plan regarding entry, risk management, and trade management.
Good luck!
All Strategies Are Good; If Managed Properly!
~Rich
ETHUSDT – 5-Month Bullish Boom Incoming🚀 ETHUSDT – 5-Month Bullish Boom Incoming! | Ethereum Price Prediction
📈 Chart: ETHUSDT | Timeframe: 1D | Outlook: Bullish
🔍 Overview
Ethereum (ETHUSDT) is setting up for a major breakout and could rally significantly in the next 5 months (June to October 2025). With strong technical support, improving on-chain metrics, and bullish macro sentiment, Ethereum might be preparing for a massive upward move.
📊 Technical Analysis
✅ EMA Support:
ETH is currently holding strong above the 200-day EMA, confirming a bullish long-term trend.
✅ Ascending Triangle Formation:
We’re seeing a clean ascending triangle forming on the daily chart, with resistance around $3500. A breakout could target $4000–$5,200 levels.
✅ Volume Spike + RSI Confirmation:
Recent buy-side volume spikes combined with an RSI above 60 suggest renewed momentum. We may see continuation once ETH breaks above resistance.
🧠 Fundamental Factors
💡 Ethereum 2.0 and Scaling Improvements:
Continued upgrades to the Ethereum network (like Danksharding) could boost confidence and drive new adoption.
💡 Institutional Interest:
BlackRock, Fidelity, and other major players are increasing their exposure to Ethereum-based ETFs and DeFi projects.
💡 Altcoin Season Rotation:
As BTC dominance slows, capital may rotate into ETH, pushing price upward aggressively in the coming months.
🎯 Price Targets
Target Price Level Timeline
TP1 $3,500 July 2025
TP2 $4,200 August–September 2025
TP3 $5,100 December 2025
🛑 Invalidation Level
A daily close below $3,100 would invalidate this bullish thesis and suggest reevaluation.
🗣️ Conclusion
Ethereum is coiling up and looks ready for a powerful move to the upside. If it breaks the $4K level with strong volume, expect ETH to fly. Keep an eye on macro factors and network upgrades.
💬 Let me know your thoughts! Do you think ETH can hit $6K by October? Drop a comment and don’t forget to like if you agree!
#ETH #ETHUSDT #Ethereum #CryptoAnalysis #Altcoins #Bullish #Crypto2025 #EthereumPricePrediction #TradingViewIdeas