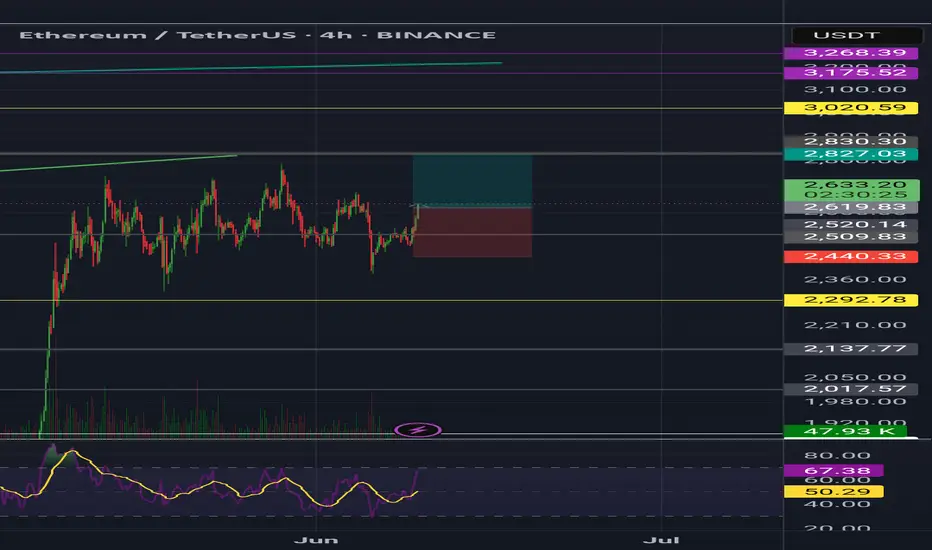
ETH – System Trigger Hit
ETH on the 12H has just reclaimed the green line: resistance from the previous tops.
This level sits roughly midway between the 0.5 and 0.382 Fib levels, with \$3000 now looking closer than \$2500.
PSAR has just flipped above the last tops, and price is now above MLR > SMA > BB center > 200MA.
All system conditions are met for a long entry on this timeframe.
This also comes as confirmation of the daily signal entry at today closing
Always take profits and manage risk.
Interaction is welcome.
ETHUST trade ideas

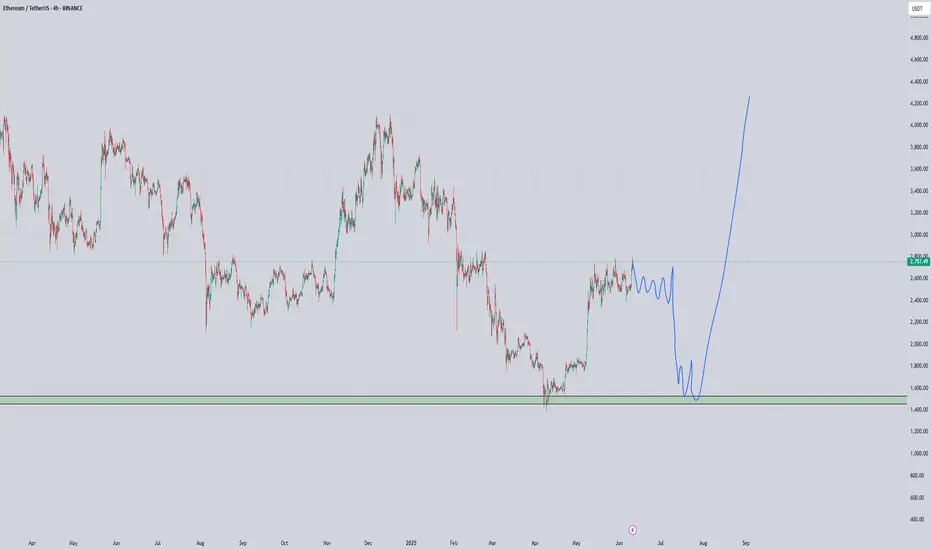
ETH - mega dump and mega ultra pumpI found a fractal for Bitcoin, and Ethereum is currently similar to it. If we want to see a truly strong upward movement, then there is a high probability of such a helicopter, as similar situations have already occurred before the strongest growth.
Ethereum breaking out!Two days ago, I've posted that we're most likely trading in a 2K-4K range on Ethereum. There was a slight deviation below 2K but the bulls swiftly regained control.
As for now, it's seems obvious we are heading towards, at least, 3K. I'm confident 4K is on the horizon, though I prefer to take it level by level.
ETH is breaking out off this bull flag and this chart looks more and more like one of those charts you study in textbooks.
ETHEREUM LOOKS READY TO POPEthereum is in an interesting spot. It is sandwiched between the weekly 50 and 200 MAs, both key areas to watch on any chart. It has been trading between these lines for the better part of 6 weeks, astounding compression and consolidation. A close above the 50 would signal major upside is likely, while a close back below would mean this run is likely over. As you can see, we have wicks on almost every candle testing each.
My bias is up.
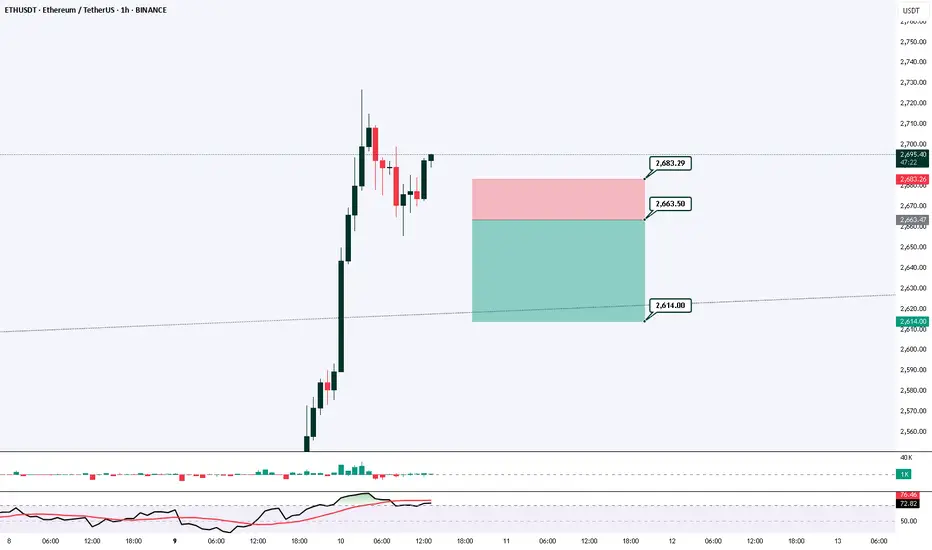
ETH/USDT Price Action Analysis — Bullish Continuation Expected 📊 ETH/USDT Price Action Analysis — Bullish Continuation Expected 🚀
🔍 Chart Overview (as of June 9, 2025):
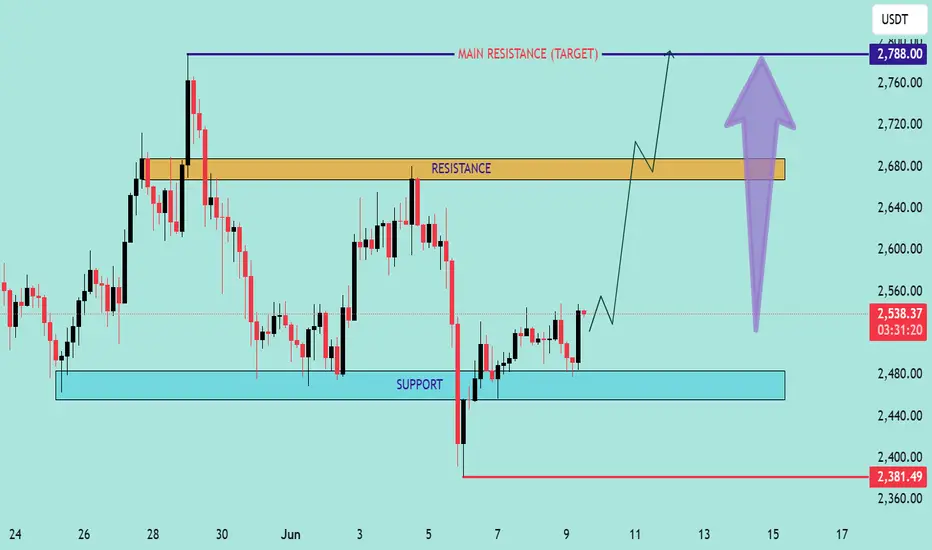
This chart of ETH/USDT highlights a well-defined support and resistance structure, projecting a potential bullish move toward a main resistance target at $2,788.00.
🧱 Key Zones:
🔵 Support Zone: $2,440 – $2,480
Price rebounded strongly from this area, showing buyer interest and liquidity absorption.
🟠 Resistance Zone: $2,660 – $2,690
Previously rejected zone where supply overtook demand. Price must break and hold above this for further upside.
🔺 Main Resistance Target: $2,788.00
If resistance is cleared, this is the next major supply area, acting as a potential take-profit level.
📈 Price Action Insight:
Price is currently hovering near $2,538.37, approaching resistance.
The chart suggests a potential breakout scenario after a short consolidation.
A bullish breakout above $2,690 could trigger a sharp rally toward the $2,788 target.
The chart projects a pullback-retest pattern (break, retest, and continuation) before the final leg up.
⚠️ Risk Management:
Invalidation Level: $2,381.49
A break below this level would invalidate the bullish setup and could lead to further downside.
✅ Summary:
Bias: Bullish 📈
Entry Area: Break and retest above resistance zone ($2,660–2,690) 🔓
Target: $2,788 🎯
Invalidation: Below $2,381.49 🚫
📌 Note: Always use proper risk management and confirm breakouts with volume or momentum indicators (e.g., RSI, MACD).
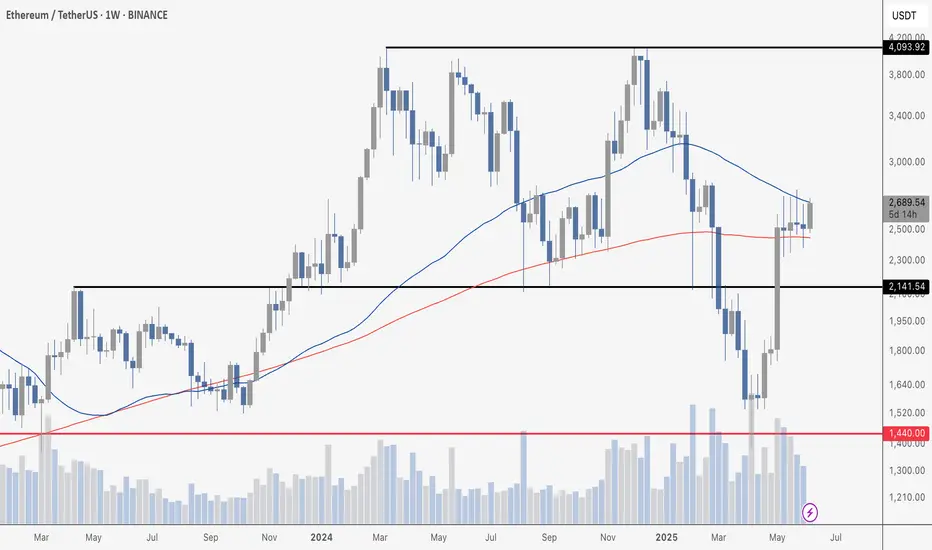
Ethereum Consolidates in Tight Range – Breakout Imminent?Ethereum has been trading within a defined high time frame range between $2,400 support and $2,800 resistance for nearly a month, dating back to May 12. This prolonged sideways action indicates a consolidation phase that could either be accumulation or distribution—depending on how price reacts to the edges of the range.
The most notable aspect of current price action is the steady decline in volume. As volume drops, volatility tends to compress, increasing the probability of an eventual breakout. However, for any breakout to be validated, it must be supported by a significant surge in volume. A weak breakout without follow-through volume risks a deviation that traps traders and reverts back into the range.
Structurally, Ethereum remains bullish. The broader trend is still intact, with price forming higher highs. A pullback from current levels into the lower boundary of the range could present a chance for a higher low to form, offering further confirmation of trend continuation. Alternatively, an upside breakout from this range—without a deeper pullback—would still be valid, provided it’s volume-backed.
For now, Ethereum remains in a holding pattern. Traders should be patient and wait for a clear move beyond either $2,800 or $2,400 with volume confirmation before taking directional trades. A break above $2,800 could trigger bullish continuation, while a break below $2,400 would shift structure and suggest deeper downside risk

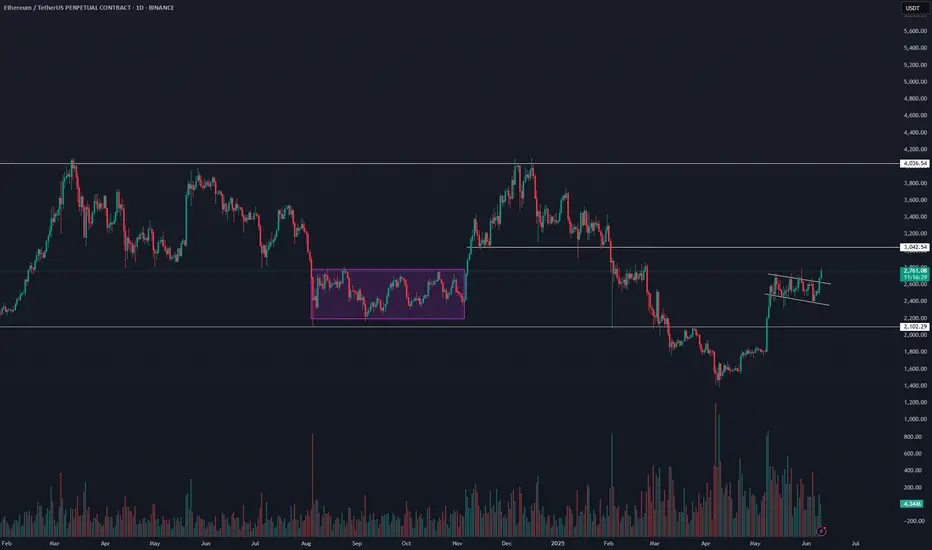
ETH is going for itAfter reclaiming the range, now the breakout on the daily RSI. Everything looks set for ETH.

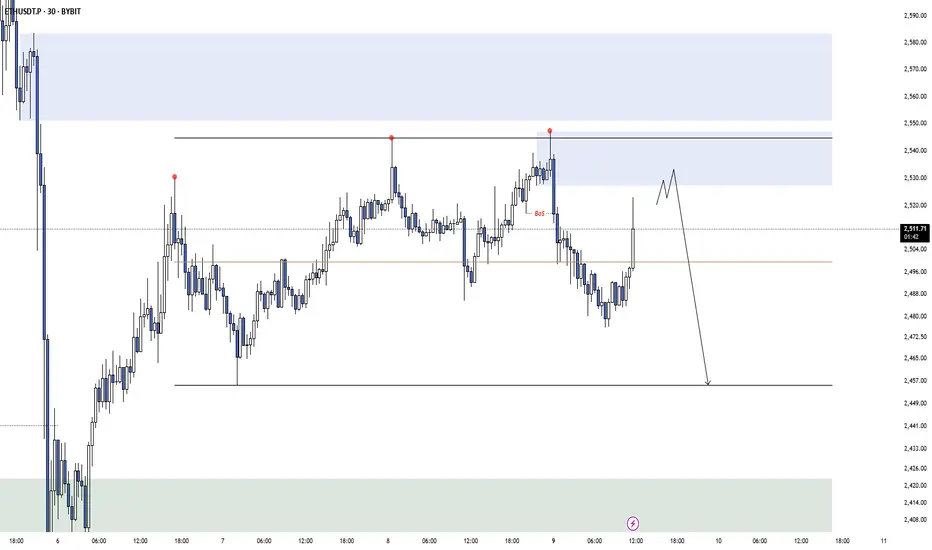
Short ETH
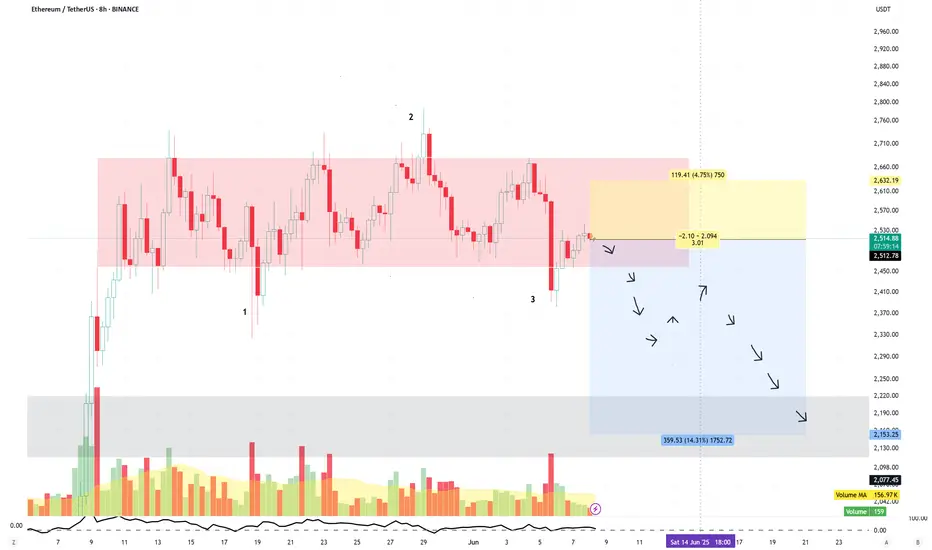
ETH has been consolidating below the key resistance level at $2,700.
On the 8-hour timeframe, price action suggests the formation of a potential distribution schematic 1-2-3.
A short setup is illustrated on the accompanying chart.
Disclaimer:
This analysis is based on my personnal views and is not a financial advice. Risk is under your control.
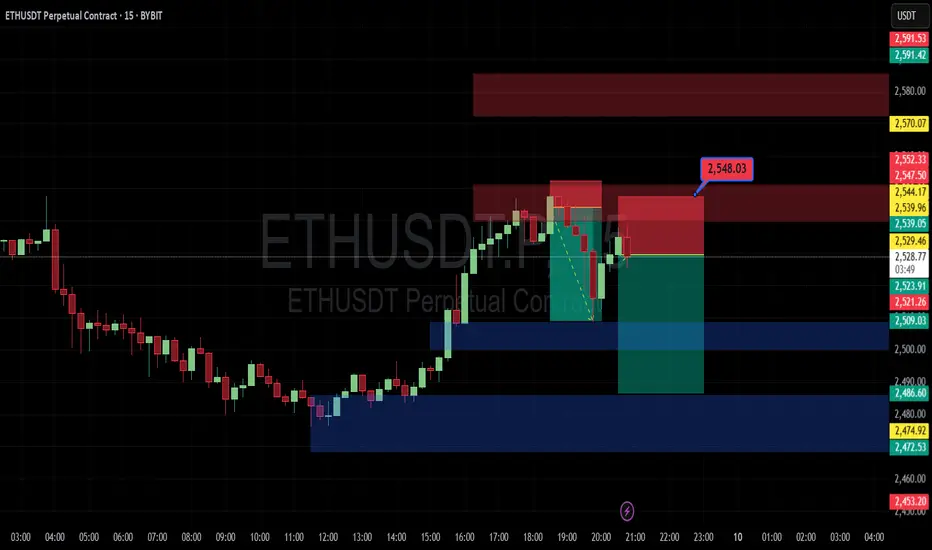
ETH SELL SIGNAL 🚨 ETH SELL SIGNAL 🚨
Ethereum is flashing red on the charts! 🔻
📉 Target: $2496
High-probability setup based on price action + volume dynamics.
Perfect time to lock in gains or short the dip! 💰
Follow for more real-time crypto signals, smart entries, and profit-taking strategies. 🚀
#ETH #Ethereum #CryptoSignals #SellSignal #TradingView #CryptoTrader #Altcoins #ETHAnalysis
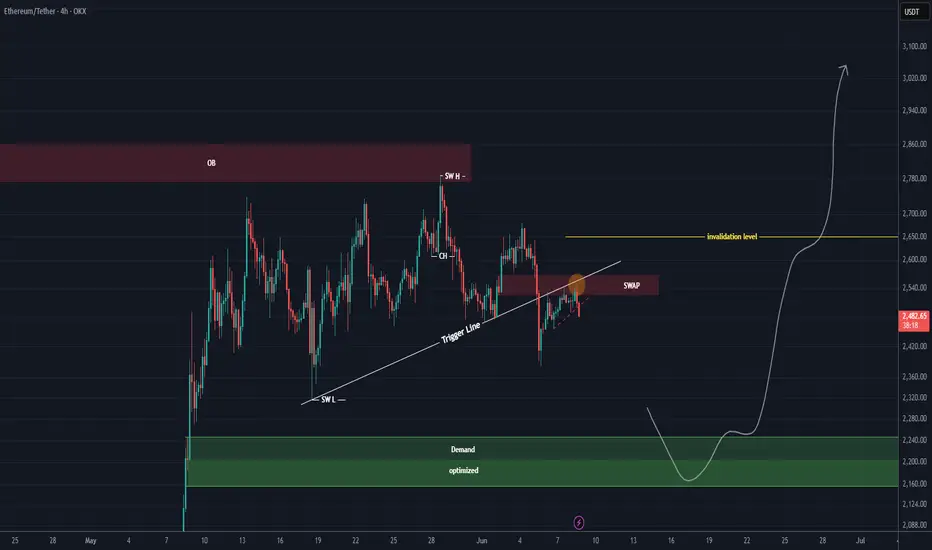
ETH NEW UPDATE (4H)This analysis is an update of the analysis you see in the "Related publications" section
Inside the red zone from the previous analysis, there was also a SWAP zone that price reacted to. The pullback trendline has also been broken. After re-evaluating the chart, the best area for a potential re-entry is the $2,165 to $2,250 range.
Do not enter a position without a proper setup and risk management | you could easily become market maker bait.
A daily candle close above the invalidation level would invalidate this bearish scenario.
For risk management, please don't forget stop loss and capital management
Comment if you have any questions
Thank You
ETH DistributionThere is a potential extended model 1 going over into a model 2 on ETH. I look for entries at this extreme supply. The supply above and the speed its coming up is not optimal so let's see what happens.
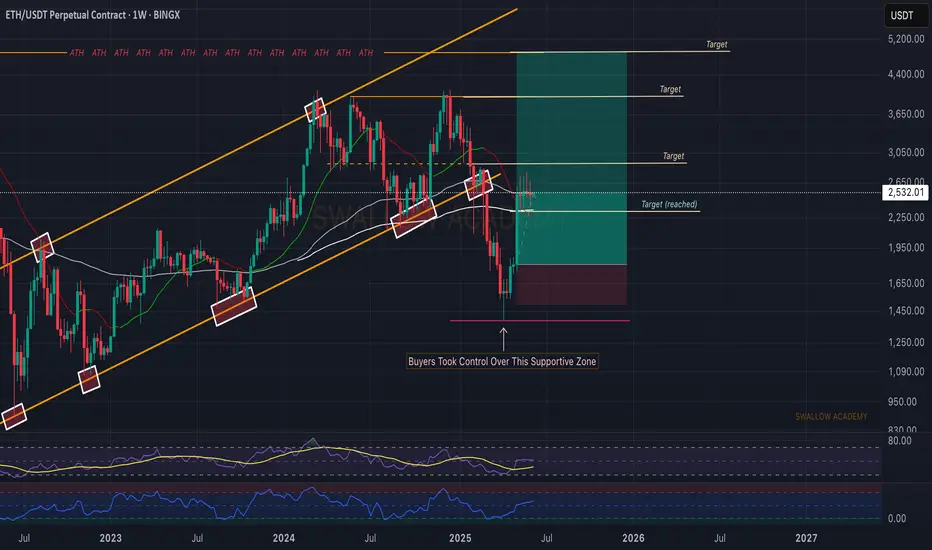
Ethereum (ETH): Time For ETH To Shine | Bullish!Ethereum has done very well so far, where we have established the bottom for the weekly timeframe and also got a good entry for the long position here.
Now, while we reached our first target we are still looking for further movement to upper zones, filling rest of our target. This would be the next step for upcoming bull market, where liquidity will fall into ETH and coins on ETH ecosystem.
Swallow Academy
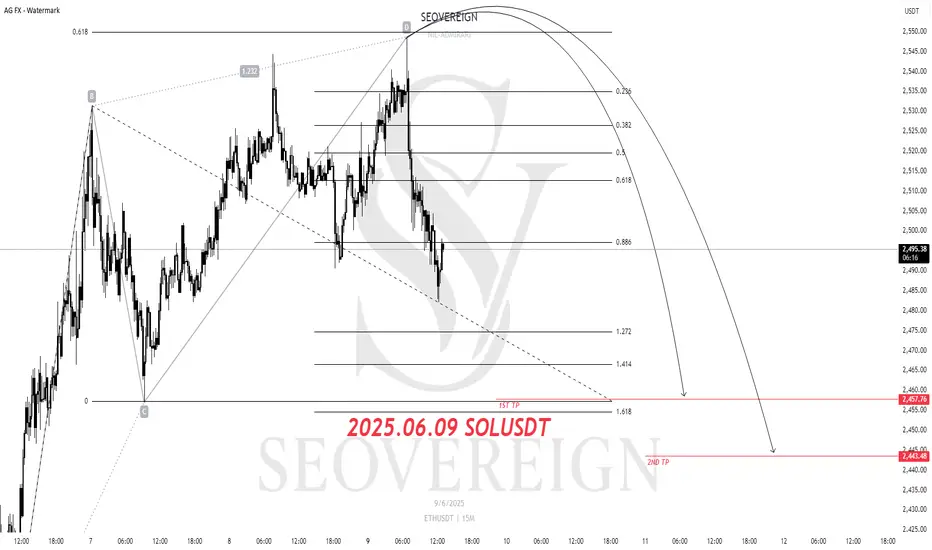
ETHEREUM Short Position Update – June 9, 2025We are the SeoVereign Trading Team.
With sharp insight and precise analysis, we regularly share trading ideas on Bitcoin and other major assets—always guided by structure, sentiment, and momentum.
🔔 Follow us to never miss a market update.
--------------------------------------------------------------------------------------------------------
Ethereum (ETH) Short Position Strategy
Position Basis: Technical reversal signal based on the ABCD
1st Target: 2.45
Analysis Summary:
Currently, ETH has entered the completion zone of the ABCD pattern, one of the harmonic patterns, suggesting a potential price reversal. This pattern provides a technical basis for a short entry along with an overbought signal at the top.
The targets are set as support zones that the downward wave may reach after the pattern completion, and a partial take-profit strategy may be effective depending on market conditions. Thorough risk management and setting a stop-loss are crucial to prevent pattern invalidation.
#ETHUSDT: Currently On The Way Towards Filling The FVG?ETCUSDT is currently experiencing a significant correction as the price approaches a pivotal juncture where a substantial bullish price reversal is anticipated, potentially propelling it to new all-time highs or even surpassing them. It is imperative to exercise meticulous risk management and conduct your own thorough analysis before engaging in any cryptocurrency trading or investment activities.
Should the price indeed undergo a major correction, it is likely to decline to our second designated area, where it is anticipated to fill the liquidity gap and subsequently reverse course, continuing its trajectory towards our established targets.
Please consider this analysis as a secondary influence only, or even solely for educational purposes. It is crucial to conduct your own independent analysis and risk management prior to engaging in any cryptocurrency trading or investment endeavours, as they inherently carry substantial financial risks.
We extend our best wishes and encourage you to trade safely and responsibly.
Should you wish to demonstrate your support, you are welcome to express your appreciation through likes, comments, or sharing this information.
Thank you for your consideration.
Have a pleasant weekend.
Team Setupsfx_

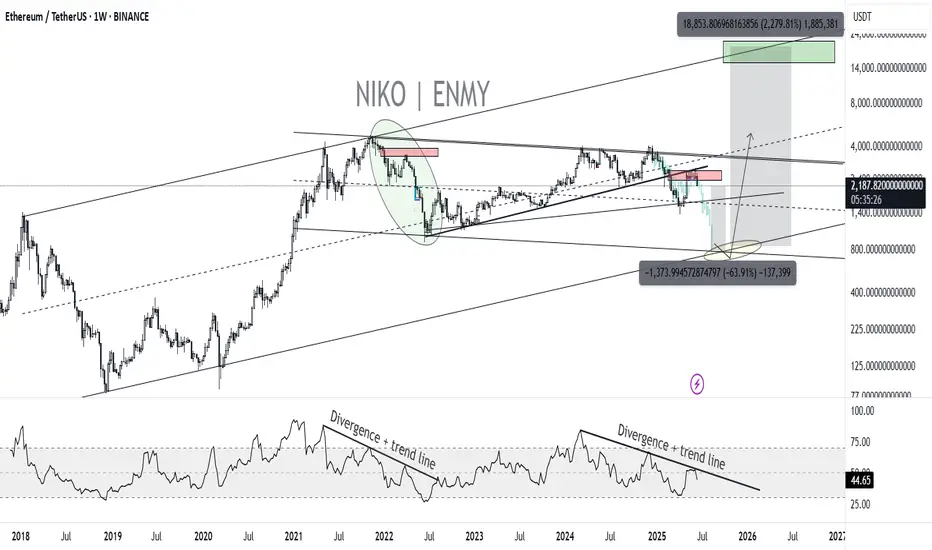
ETHEREUM for $750?In this chart, I am showing you the worst possible scenario. If we compare this cycle to the past, we see some very similar things on the weekly chart:
- Weekly RSI divergence
- Testing the 50-level RSI and the trend line from the bottom to the top
- Correction to the 0.5 fibbonacci level.
- Last time we had a war between Ukraine and Russia and now we have a war between Israel and Iran
- Last time everyone on X(twitter) was talking and cheering about Alt-Seoson and ToTheMoon and now we have the same situation, DYOR, check X
$750-800 for Ethereum are the lows of the two global channels. So it's a logical bottom. And after the price reaches the bottom, we can reach the top of the channel.
Hence after this mega-dump we will see #ETH at $18000-20000.
What do you think about this scenario?
ETh more dump to $2100-$2030Just recently hopped into ETH short. Aiming for $2100 to $2030
Market is correcting on the weekly tf and this is a probably area that it might use to create the new HL for continuation back up.
Time sensitive.
Stop: $2235-$2245 area. $2245 is safer a bit lower RR though.

Pullback and DownHi there!
We have a nice pattern and very clear also. We should take care about BTC movement if we trade ETH or any other ALT coin!
Our main target is very clear ABC Fibonacci extension 161,8 and Fibonacci retracement 61,8 and HH of previous cycle! Sure, under this cluster level is a liquidity zone where you can make new cheap buys :-).
Good luck traders!
ETH Bearish Retest – Heading to $900?Description:
On the weekly chart, ETH has once again failed to break back above the long-term ascending trendline that started in 2020. After losing this trendline support earlier, price is now treating it as resistance — a textbook bearish retest.
The market reaction suggests weakness, and the lack of strong volume on the upside raises concerns about buying momentum. If this structure holds, we might be looking at a broader correction in play.
📉 Key Observations:
• Bearish rejection from the multi-year trendline.
• Structure resembles a lower high formation.
• Weak volume on bounces, showing hesitation from bulls.
🔍 I’m personally watching the $1,000 zone as a potential magnet if downside pressure builds. Some may even expect a retest of the $900 range — not a prediction, just a scenario.
💬 What do you think? Are we headed for a deeper flush or is this just a trap before a breakout? Drop your thoughts ⬇️
#Ethereum #ETH #CryptoWeekly #TechnicalAnalysis #Trendline #BearishSetup

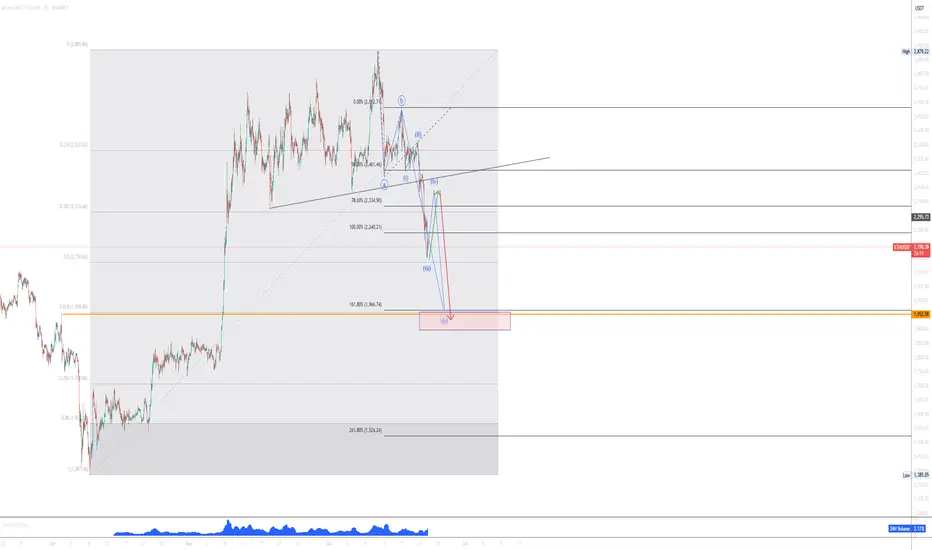
ETHEREUM Analysis (3D)First of all, pay close attention to the timeframe | it's a higher timeframe.
From the point where we placed the green arrow on the chart, Ethereum appears to have entered a bullish phase | specifically, a symmetrical pattern.
It currently seems to be in wave I of this symmetrical structure, which is the final wave. Wave I itself appears to be composed of three parts (ABC). At the moment, Ethereum seems to be in wave b of wave I.
We expect wave b of I to complete within the green zone, after which the price would move into wave c of I.
The price seems inclined to complete wave b of I near the bottom of the green zone.
Targets are marked on the chart.
In the green zone, it’s no longer reasonable to look for Sell/Short positions, especially when the price is approaching the bottom of the green area.
A weekly candle close below the green zone would invalidate this analysis.
For risk management, please don't forget stop loss and capital management
When we reach the first target, save some profit and then change the stop to entry
Comment if you have any questions
Thank You

Your Trading System Isn't the Problem. Your Discipline Is.📘 Your Trading System Isn't the Problem. Your Discipline Is.
Hard truth:
Your endless search for a new system is a smokescreen.
The best system in the world can't save you from poor discipline.
Here's why discipline matters more than your strategy:
You quit your system after a few losses, never allowing it to prove its value.
You deviate from your rules when emotions run high—wrecking consistency.
You're focused on shiny objects instead of sharpening the knife you already have.
🎯 The solution?
Commit to discipline. Track your adherence rigorously. Measure your success by consistency, not immediate outcomes.
TrendGo’s power isn’t just in clear signals—it's in enabling disciplined action.
🔍 Stop blaming your tools. Own your discipline.