ETHUST trade ideas
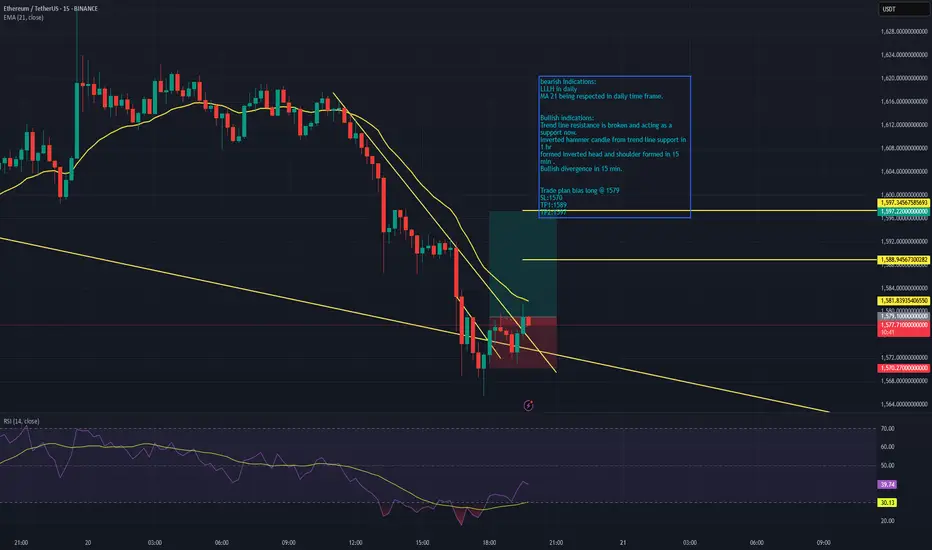
ETH -bullish indicationsbearish indications:
LLLH in daily
MA 21 being respected in daily time frame.
Bullish indications:
Trend line resistance is broken and acting as a support now.
Inverted hammer candle from trend line support in 1 hr
formed Inverted head and shoulder formed in 15 min .
Bullish divergence in 15 min.
Trade plan bias long @ 1579
SL:1570
TP1:1589
TP2:1597
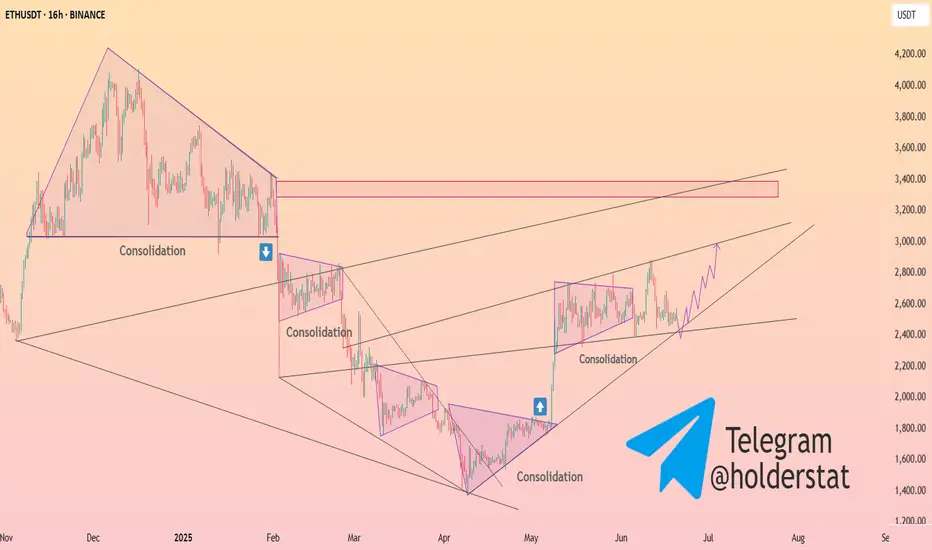
HolderStat┆ETHUSD ascending channel strengthBINANCE:ETHUSDT on the 16h chart is showing a robust uptrend, with price action contained within an ascending channel. Each consolidation has led to a breakout, and the current price is bouncing off the lower channel support. The pattern of higher lows and strong rebounds from support levels indicate that bulls are in control. The next resistance is at 3,200, and a breakout above this could open the way to 3,400 and beyond. The technicals support a bullish continuation as long as ETH holds above 2,400.
SHORT ETH🔷 Setup Summary: SFP + Key Volume Combo
1. Context:
Pattern: Double Top + SFP (Swing Failure Pattern)
Timeframe: Likely M15–H1 (possibly during Asian/European session)
Background: Price breaks previous high slightly (liquidity grab), then sharply reverses — a clear trap.
2. Confirmation:
A clear Key Volume candle appears at the top — signaling market maker action.
A strong rejection candle (pinbar or engulfing) confirms the SFP.
Price fails to hold above the new high — trap confirmed.
3. Entry Strategy:
Entry: After the SFP confirmation candle closes.
Stop Loss: Above the SFP high or Key Volume wick (a “valid” SL, not necessarily tight).
Take Profit:
Short-term: 3R (if trading intra-session).
Long-term: Target demand zone or Daily support if trend supports it.
4. Risk Management (per system guidelines):
Max risk per trade: 1–2% of account.
If setup invalidates: cut the loss immediately, don’t widen SL or overtrade.

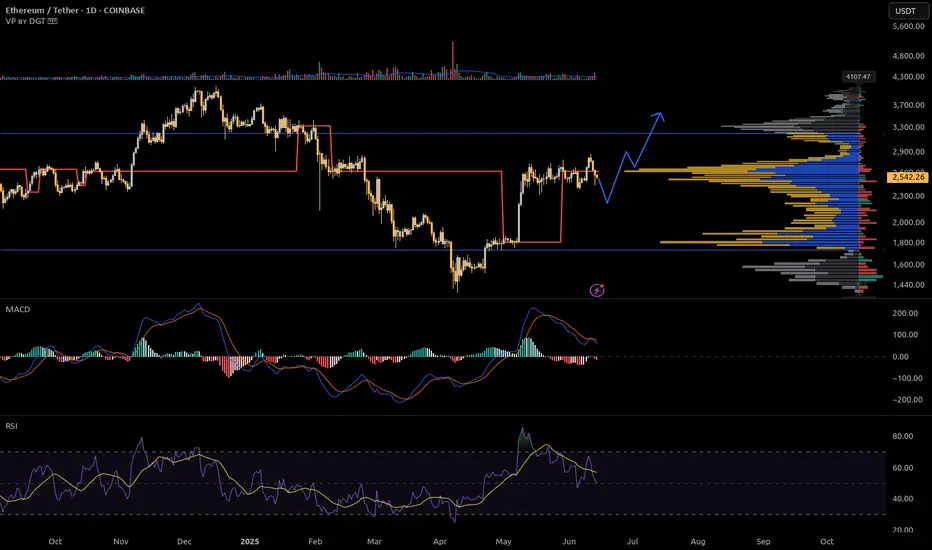
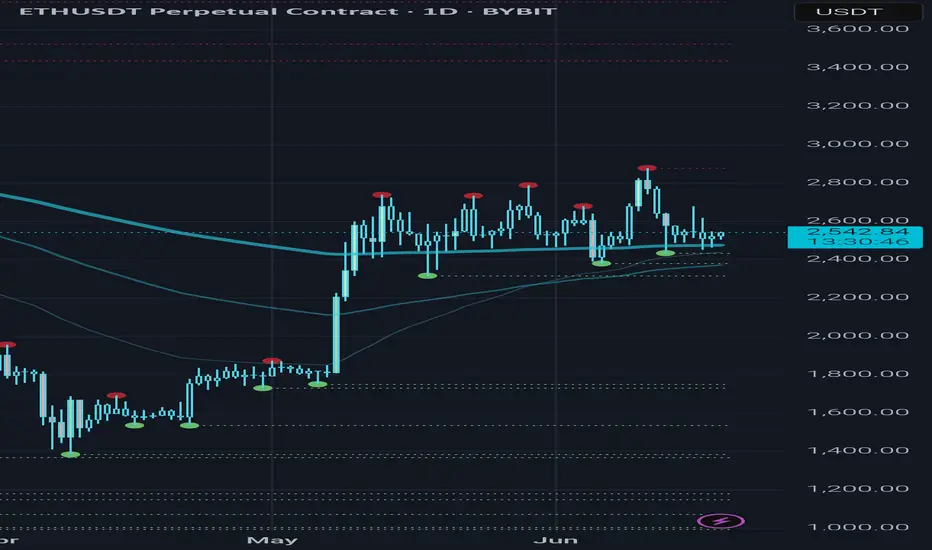
Ethereum Daily Chart = Coiled SpringSitting on the 200 EMA.
3x liquidity sweeps below — no breakdown.
Red dots stacking above = pressure cooker.
📉 Break $2.45K → dump
🚀 Break $2.7K → $3K squeeze
Big move coming. Don’t blink.
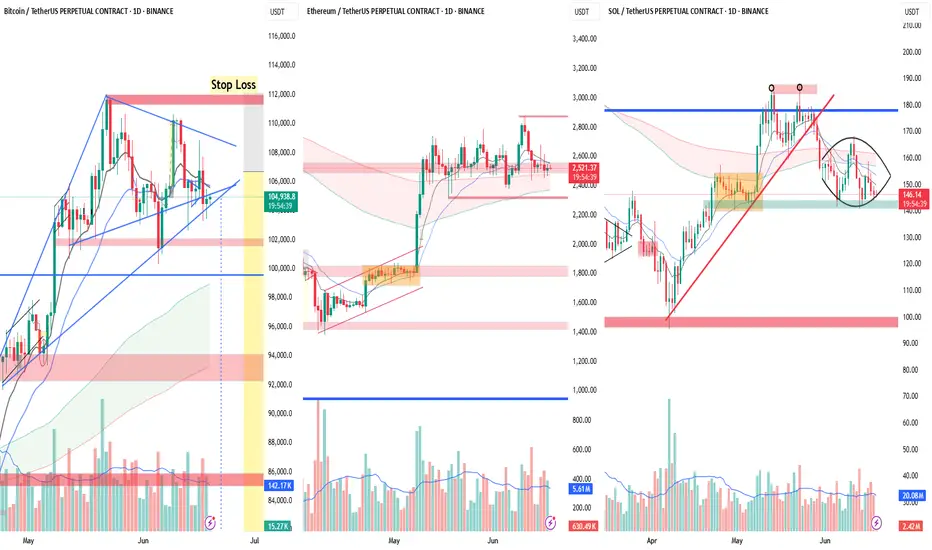
Crypto at a Crossroads: BTC, ETH & SOL – 3 Charts, 3 Messages📊 Market Overview:
The crypto market often moves together — but BTC, ETH, and SOL are telling 3 very different stories right now. From Bitcoin’s coiled spring to Ethereum’s indecision and Solana’s struggle — this divergence could define the next major trend.
1️⃣ Bitcoin (BTC): The Market’s Trigger
BTC is tightening in a Symmetrical Triangle after a powerful uptrend — a textbook Bull Pennant.
🔼 Lower highs + higher lows = pressure build-up
🔇 Volume drying up → classic pre-breakout setup
⚡ A decisive move (esp. above $ 108K) will likely lead the entire market
Bias: Bullish continuation likely, but prepare for either direction.
2️⃣ Ethereum (ETH): The Waiting Game
ETH is stuck in a rectangle range between $ 2,450–$ 2,800.
😐 Flat MAs = no short-term trend
📉 ETH is neutral → waiting for BTC to move first
Strategy: React to breakout or breakdown from range boundaries.
3️⃣ Solana (SOL): The Weakest Link
SOL shows clear signs of reversal and relative weakness.
⚠️ Double Top near $185 in May
🔻 Lost multi-month trendline
🛡️ Testing critical support at $ 140–145
🌀 Attempting a Rounding Bottom (accumulation?) but still below key MAs
Watch: Support must hold. Break below = major downside risk.
🎯 Trade Strategy:
If BTC Breaks Up (above $ 108K):
🚀 Long BTC → Targets: $ 118K–$ 120K
✅ Long ETH above $ 2,800
🧨 Aggressive Long SOL above $ 160 (trendline reclaim)
If BTC Breaks Down (below $ 104K):
⚠️ Short BTC → Targets: $ 100K, $ 98K
⚠️ Short ETH below $ 2,450
🚨 High-conviction Short SOL below $ 140 → Potential drop to $ 100 zone
❌ Invalidation:
📉 Bullish thesis invalid if BTC breaks below triangle
📈 Bearish invalidated if BTC breaks up (Stop loss above $112K)
🔚 Final Word:
BTC is the market’s steering wheel — ETH is parked, SOL is stalling.
⏳ The triangle is near apex. A breakout will ripple across all coins.
Which direction are YOU betting on? Bullish or Bearish? Drop your view below!
ETH/USDTETH remains in a consolidation phase. Attention is on the nearest liquidity zone — a sweep or reaction here could signal the next move. Failure to reclaim and hold above the $2600 level on the weekly close opens the door for a potential drop into the $2000–$2300 range, aligning with a possible manipulation phase before reversal.
Longs or shorts only considered upon clear confirmation and valid setup. No rush — let the market come to you.
ETH at critical levelsCRYPTOCAP:ETH is at the bottom of the structure, great risk-to-reward ratio. However, the bearish thesis needs to consider a dip to 2kish level. To make the DCA strategy work best, buying on dips is vital.
Full TA: Link in the bio

ETH/USDT – 6 Weeks of Doji: The Calm Before the Storm?⏳ Summary:
Ethereum has been moving sideways for 6 straight weeks, printing back-to-back doji candles — a rare phenomenon in any market. Price is trapped, pressure is building, and volatility is near its breaking point. History shows: after this much indecision, a violent breakout is almost inevitable.
🚨 What’s Happening?
6 consecutive weekly dojis — this kind of tight-range compression hasn’t been seen on ETH in years.
Price is squeezed between $ 2,500 support and $ 2,620 resistance.
Volume has dried up, and momentum is fading (RSI flat, wedge breakdowns on 4H/1D).
Bulls and bears are in a deadlock… and that never lasts long.
The longer the coil, the harder the snap.
🎯 Trading Roadmap (No Fluff):
📈 Bullish Breakout Trigger: Weekly candle close above $ 2,620 → Potential rally to $ 2,745 and $ 2,880 (Fib zones).
📉 Bearish Breakdown Trigger: Daily or weekly close below $ 2,500 → Expect a flush to $ 2,300 and $ 2,120 support levels.
🎯 Manage risk tight. This setup offers clean invalidation and powerful upside/downside potential.
📊 Why This Matters:
Markets don’t go silent for 6 weeks without a reason. ETH is gathering energy like a coiled spring — and once direction is decided, it can move fast and far. This is the kind of setup traders wait weeks to catch.
🤔 What Do You Think?
Is ETH quiet before the pump, or are bears waiting to break it down hard?
🗨️ Drop your thoughts, charts, or counter-setups below!

My ETH Game plan of this week.Eth is being supported multiple times from a support area. It is, in fact, in a rising channel; despite being rejected multiple times, it is still making higher highs.
I am still bullish as long as it is above the support area.
ETH: The Structure Remains BearishAs of now, the overall market structure for Ethereum still appears bearish.
Here's what I'm watching:
From the NY Open, I think there's a high possibility of a quick liquidity grab to the upside followed by a correction downward.
However, this sweep may not even happen. It will largely depend on geopolitical developments, particularly the Iran-Israel conflict, which remains a major market-moving factor.
I don’t know what kind of news could trigger this, but judging by the chart, there’s absolutely nothing bullish for now and honestly, it might even get uglier than it already was between Iran-Israel.
What’s below? A lot of liquidity.
On the chart, I’ve highlighted key downside targets:
Previous Day Low (PDL)
Previous Week Low (PWL)
One Day Fair Value Gap (1D FVG)
My personal expectation: a delivery of price into the 0.705 Fibonacci zone of the recent impulse.
This area also includes the Point of Control (POC) and completes the 1D FVG fill.
That’s where I’ll be looking for a potential bullish reversal.
Outlook for July
I'm still hopeful that the market tone shifts bullish in July.
Why? I expect a wave of positive narratives:
Trump’s proposed tariff adjustments
Multiple ETF approvals (especially altcoin-related)
Retail attention coming back
The setup is forming but for now, ETH remains under bearish pressure.
Stay tuned. Take care. More to come.

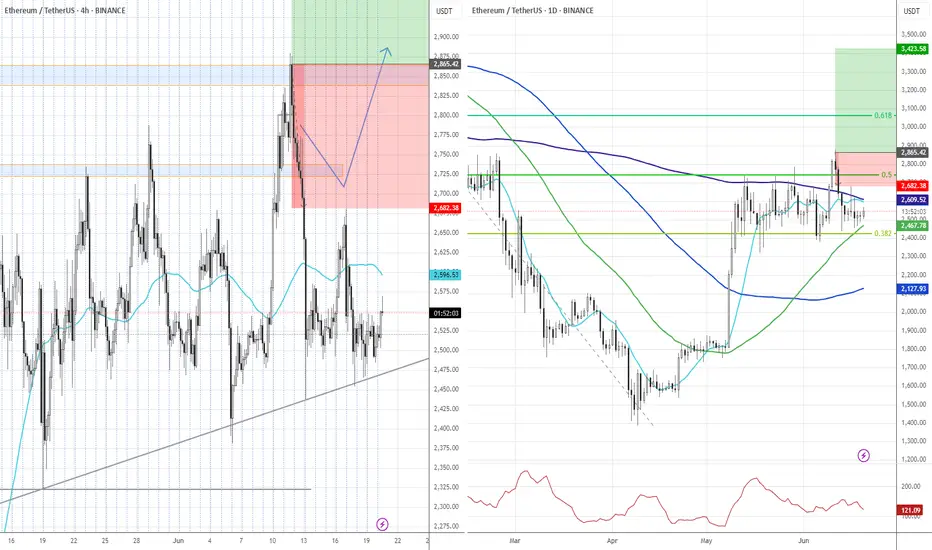
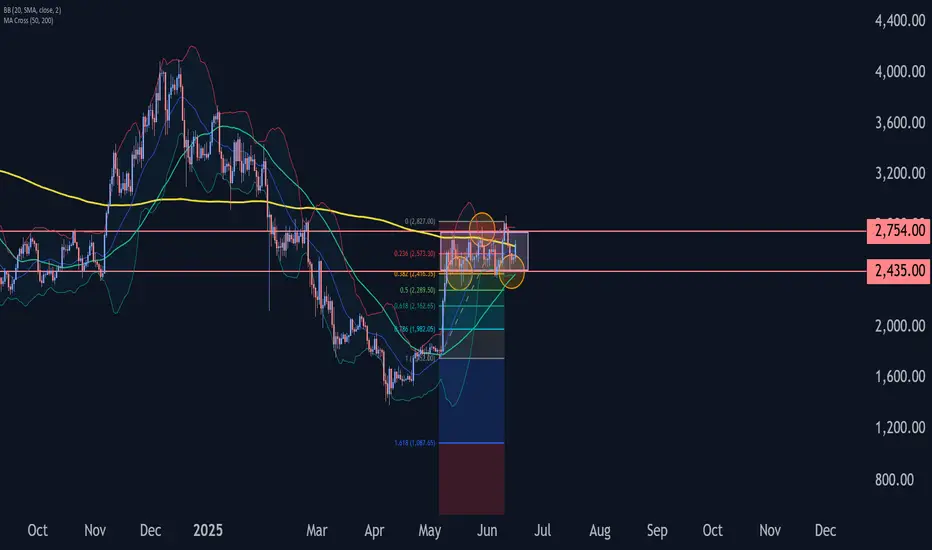
Ethereum Wave Analysis – 16 June 2025
- Ethereum moving inside sideways price range
- Likely to rise to the resistance level 2754.00
Ethereum cryptocurrency recently reversed up from the support zone between the support level 2435,00 (lower border of the active narrow sideways price range from May), lower daily Bollinger Band and the 38.2% Fibonacci correction of the upward impulse from May.
The upward reversal from this support zone continues the active minor impulse wave 3 of the intermediate impulse wave (3) from last month.
Ethereum can be expected to rise to the next resistance level 2754.00 (upper border of the active sideways price range).
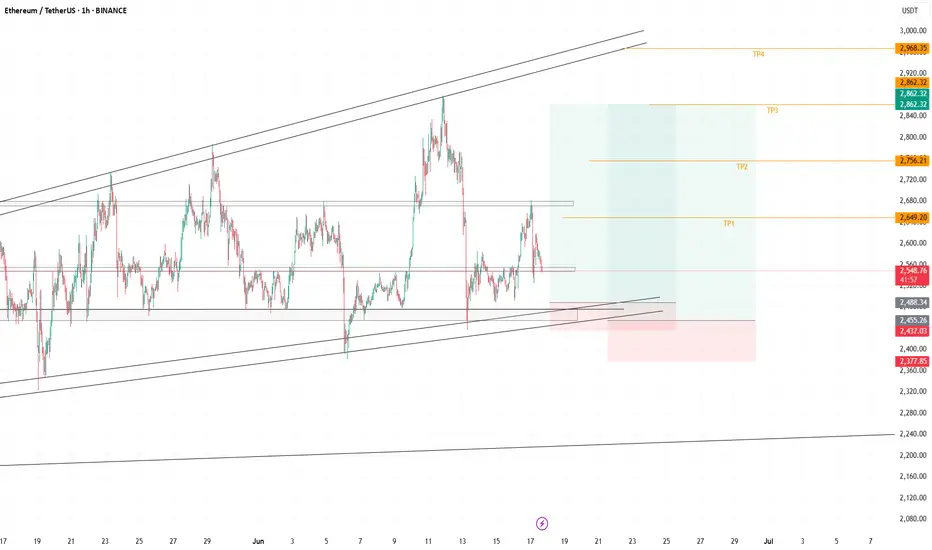
ETH Eyes Key Resistance — Bullish Structure Holds!🎯 Trading Plan:
Scenario 1 (Bullish Continuation):
Buy or hold as long as price holds above VWAP
Target move toward $3,000 –$3,430 (resistance zone)
If breakout above $3,430 — watch for acceleration
Scenario 2 (Rejection at Resistance):
Wait for confirmation of rejection (e.g., weekly SFP or bearish engulfing) in $3,000 –$3,430 zone
Consider short/hedge if rejection is confirmed, targeting a move back toward $2,600–$2,222
Invalidation:
Structure turns bearish only if price closes below $2,222
🔔 Triggers & Confirmations:
Uptrend intact as long as price is above VWAP
Confirmation required for shorts: look for SFP or clear reversal pattern at resistance
📝 Order Placement & Management:
🔼 Buy/Hold: While price is above $2,222
🛡️ Stop: Close below $2,222 (monthly close)
🎯 Targets: $3,150 → $3,430
🔻 Short/Hedge (optional): On confirmed weekly rejection at resistance
🎯 Short Target: $2,600–$2,222
🚨 Risk Warning:
Main structure is bullish; any shorts are strictly countertrend and require strong confirmation
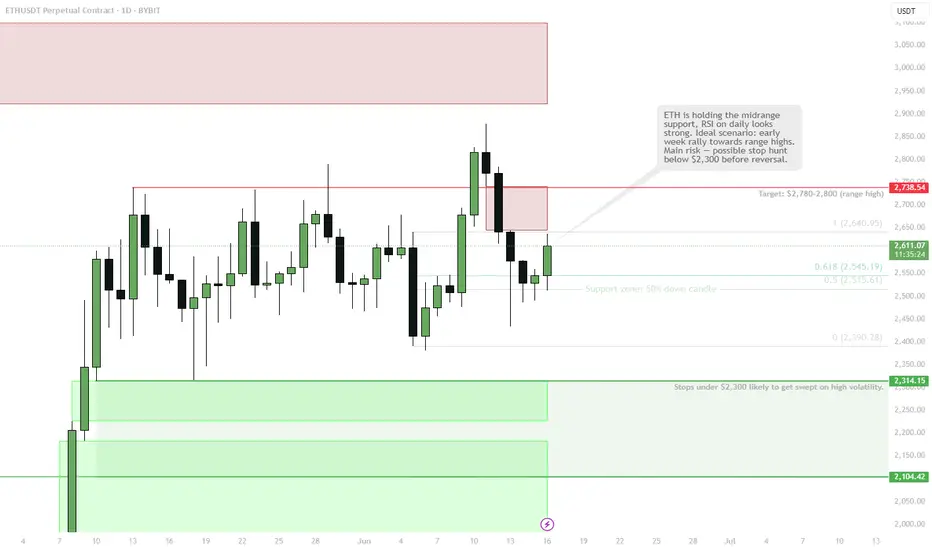
ETH is holding the midrange supportETH tagged 50% of the down candle that took out local lows — textbook support zone for new longs.
Main risk: stops under $2,300 probably get swept before real reversal — watch for fakeout.
Holding above $2,400 keeps the bullish thesis alive, next target $2,780–2,800.
As always — manage risk, don’t get caught on the wrong side of a sweep.
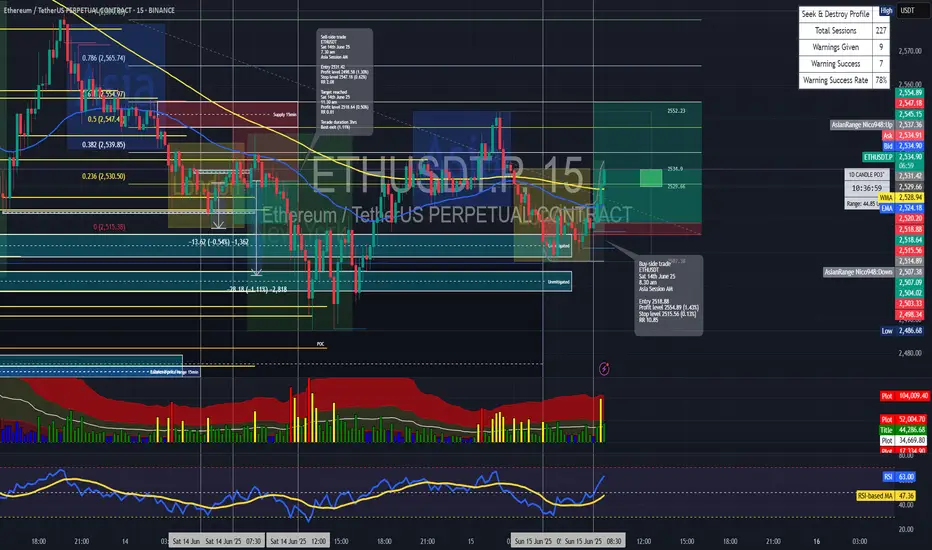
Long trade
15min ~ TF
🟢 ETHUSDT – Buyside Trade
Date: Saturday, 14th June 2025
Session: Asia Session AM
Time: 8:30 AM
Entry Timeframe: Intraday (short-term confirmation)
Trade Parameters
Entry: 2518.88
Take Profit: 2554.89 (+1.43%)
Stop Loss: 2515.56 (−0.13%)
Risk-Reward Ratio (RR): 10.85
🧠 Trade Reasoning
This entry was taken after ETHUSDT displayed strong bullish intent early in the Asia session, with price forming a liquidity sweep below local lows, quickly followed by a reversal candle and bullish order block on the lower timeframes.
Testing system on ETHlooked at 17 trades . 5 wins= 29.41% ,8 losses= 47.06%, 4 breakevens= 23.53%. average losing trade is 1% of account size and the average win is 5.14 times the risk==> 1:5.14 r:r .so every trade trade has a >50% chance of not losing and when it goes right it will hit hard, with the average winner is 5 times bigger than the loser. this is the worst performing pair that i have tested on so my confidence is boosted because i know that my edge is working in any market and the worst performing one is still profitable

Short trade Sell-side trade
ETHUSDT
Sat 14th June 25
7.30 am
Asia Session AM
Entry 2531.42
Profit level 2498.58 (1.30%)
Stop level 2547.18 (0.62%)
RR 2.08
Reason: Observing a previous failed sell-side trade, I decided to take another sell-side trade on this occasion. To add the trade was executed during the early Asia session, typically marked by lower liquidity and increased sensitivity to order flow.

ETH UPDATE 🛡️ Ethereum Holds the Line — Critical Support Zone Tested Again
Because Ethereum has plummeted over 14% since Wednesday, traders and long-term holders are worried. Bullish investors expected ETH to break over $3,000 and confirm a wider cryptocurrency rise days earlier.
However, global turmoil has slowed markets. Israel's assaults on Iran and retaliations shook global markets on Thursday, causing crypto asset volatility and risk-off.
Historical trends between August 2021 and early 2024 suggest that keeping $2,500 has led to rallies reaching $4,000. Rekt believes Ethereum must maintain consistency around this zone to prevent a deeper retreat and maintain bullish momentum.
ETH has held $2,500 over five weeks, proving its stability despite numerous testing. In the weeks ahead, altcoins and the crypto market will depend on whether Ethereum can maintain this footing again.
Ethereum fell sharply from $2,830 this week to $2,556. On the daily chart, ETH has been rangebound between $2,500 and $2,830 for weeks. Ethereum has held above the 50-day and 100-day moving averages, which are rising, despite international threats.
The red 200-day moving average at $2,642 has provided resistance. A retracement followed ETH's short break above this level, which it failed to keep. Recent volumes have increased due to heightened attention and emotive price responses in the Israel-Iran conflict.
The $2,500–$2,520 support zone is important. This region has been a floor before and might rocket bulls if they recover control. A clear fall below $2,500 might turn sentiment negative and lead to $2,300.
ETH/USDT Technical Overview – June 14, 2025📝 ETH/USDT Technical Overview – June 14, 2025
Timeframe: 1D (Daily)
Exchange: Bybit Spot
Current Price: $2,538.97
Daily Change: -1.55%
🔍 Market Structure Overview:
Primary Trend: Still bearish on the macro (lower highs from November to April).
Change of Character (CHoCH): Detected around mid-April → first signal of bullish intent.
Short-term Trend: Bullish structure formed from April to early June (marked "UP TREND").
Recent Break: Price has broken the bullish trendline and is currently pulling back.
🧠 Smart Money Concepts:
Fair Value Gap (FVG):
Noted below the current price zone – acting as a potential draw for liquidity. Price may fill this imbalance before deciding on further direction.
CHoCH Confirmation:
The change in character initiated a shift, but without a BOS (Break of Structure) above $3,034, macro bearish bias remains intact.
🛠️ Key Levels:
Type Price ($) Notes
Resistance 3,034.26 Key swing high, trendline confluence
Support 2,397.35 Minor support
Support 2,313.92 Local liquidity zone
Support 2,200–2,104 Strong demand zone + FVG area
Support 1,537.55 Major historical support
🔮 Potential Scenarios:
📉 Bearish Scenario:
Continuation of rejection from downtrend resistance.
Pullback into the FVG around $2,200–$2,100.
Potential bullish reaction from there.
If broken, next major support lies around $1,537.55.
📈 Bullish Scenario:
Support holds at $2,313–$2,200, bounce begins.
Break and close above $2,800–$3,034 would confirm a macro trend shift.
⚠️ Bias Today:
Neutral to Bearish
Until we see a strong bullish reaction from the FVG or a reclaim of the trendline, pressure remains to the downside.

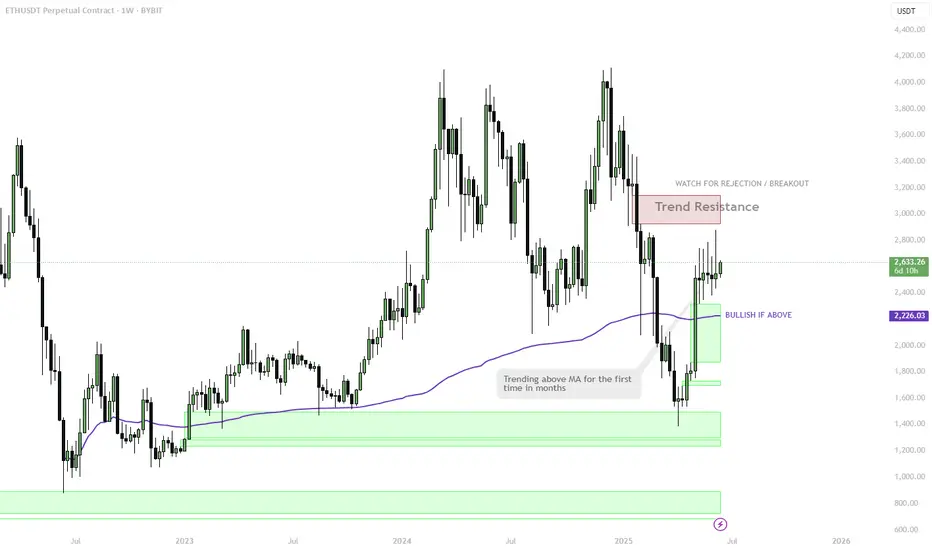
ETH - AnalysisEvery time Ethereum has broken through $2,800,
it triggered a massive move.
Over the past two years, this level has acted as key support or resistance 7 times.
Once we break through and get a clean, sustained close above, the next major rally is likely to follow.
Keep a close eye on this price level — it will be the turning point.
LFG

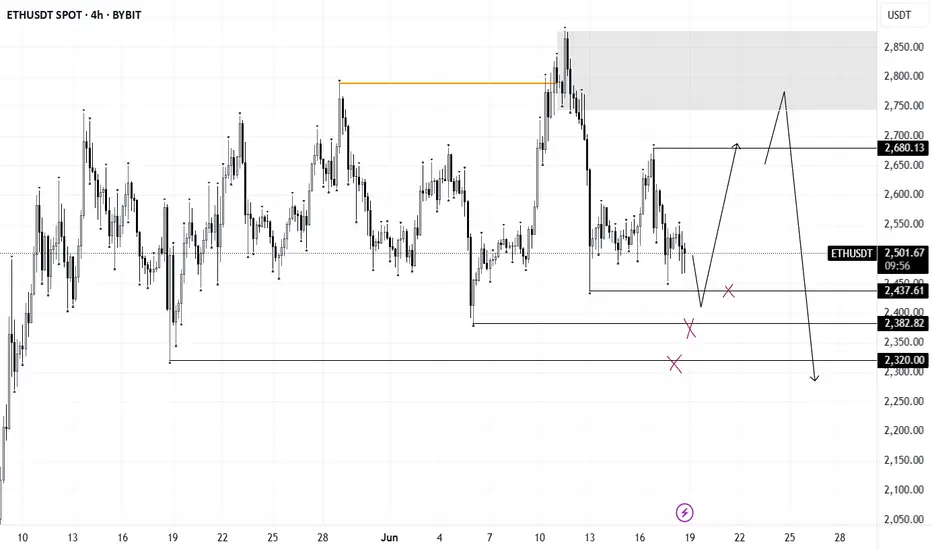
Eth longSimple idea here, if BTC gets stuck between the weekly range, then maybe ETH gets some traction.
There hasn't been a meaningful pullback since the last move up so we may see that move down soon or we follow BTC and move straight up fairly quickly after a shallow move down to sweep the lows
That whats I'm illustrating here, small sweep of the recent lows and then a move up to previous highs