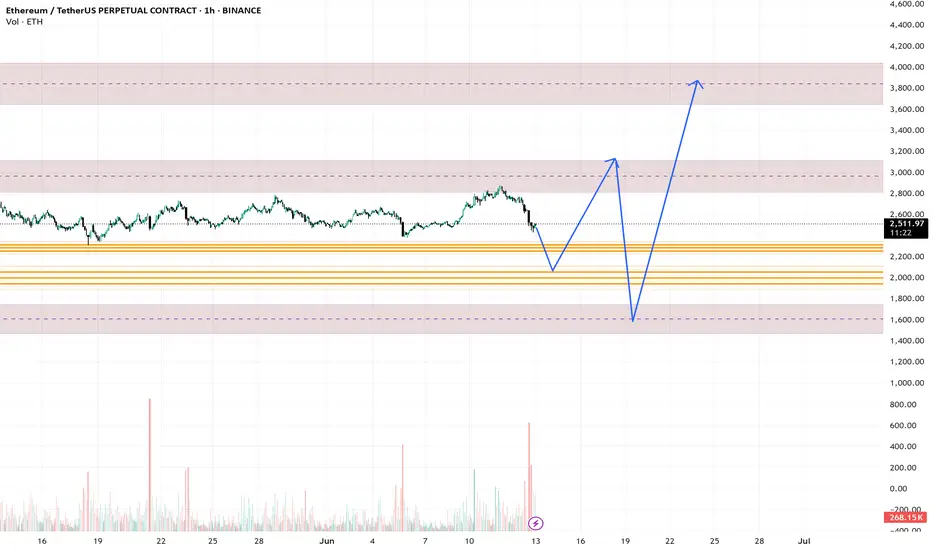
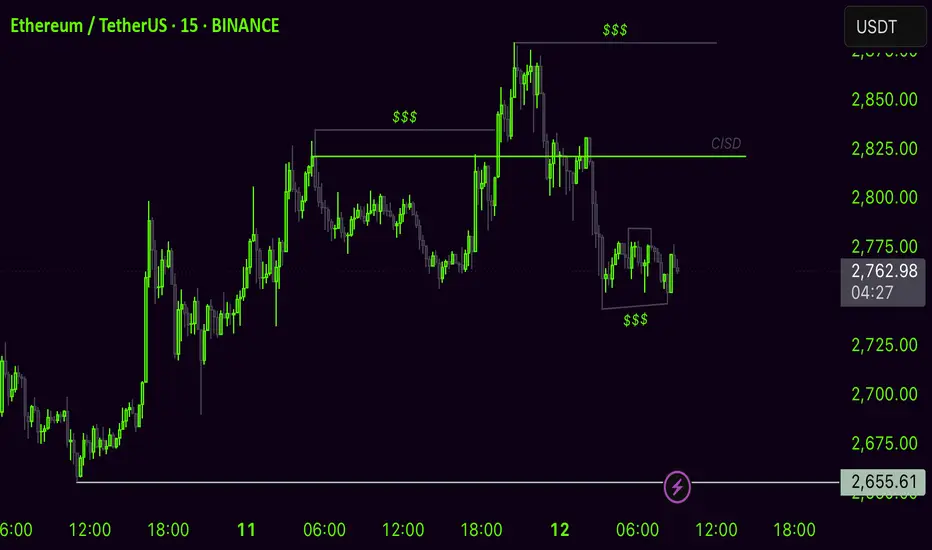
Eth longSimple idea here, if BTC gets stuck between the weekly range, then maybe ETH gets some traction.
There hasn't been a meaningful pullback since the last move up so we may see that move down soon or we follow BTC and move straight up fairly quickly after a shallow move down to sweep the lows
That whats I'm illustrating here, small sweep of the recent lows and then a move up to previous highs
ETHUST trade ideas
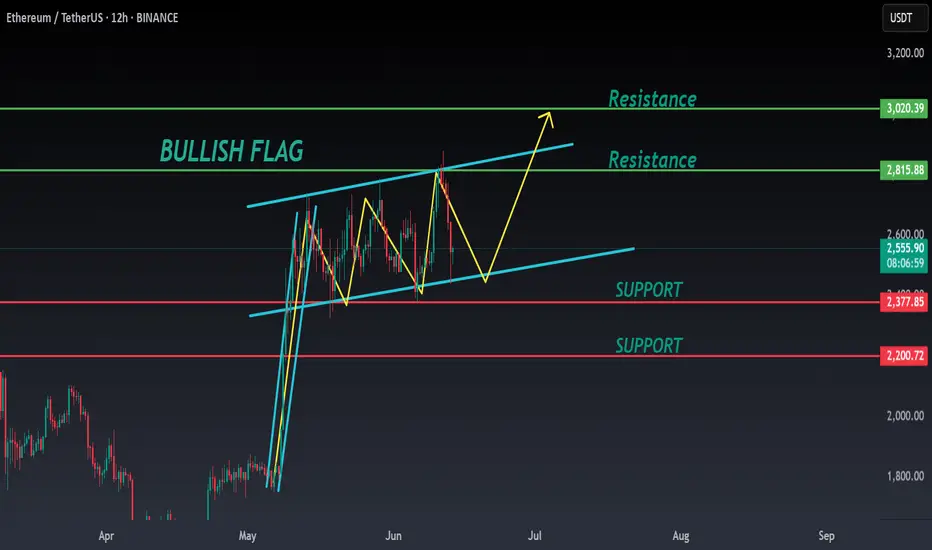
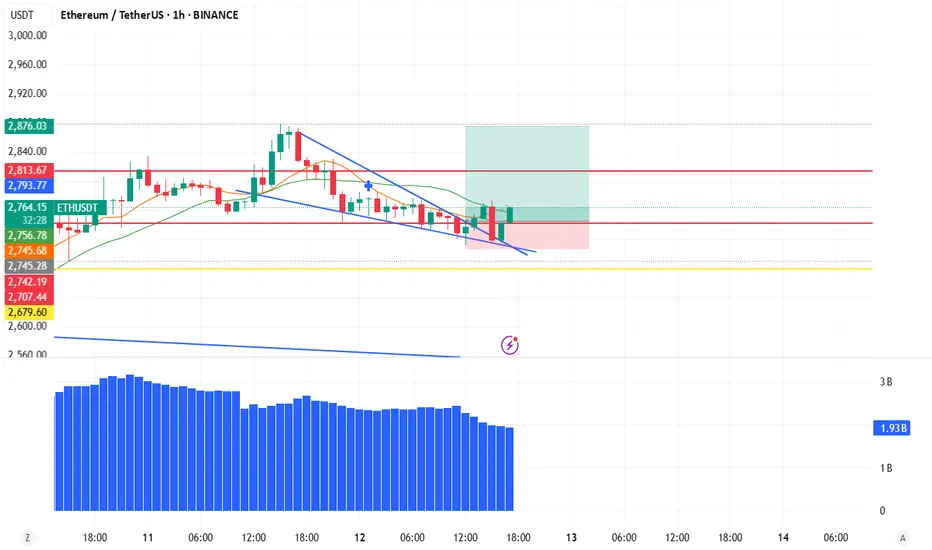
ETH ANALYSIS📊 #ETH Analysis : Update
✅As we said earlier, #ETH performed same. Now we can see that #ETH is trading in a bullish flag pattern and its a bullish pattern. We could expect around 10% bullish move if it sustain above its major support.
👀Current Price: $2555
🚀 Target Price: $2815
⚡️What to do ?
👀Keep an eye on #ETH price action and volume. We can trade according to the chart and make some profits⚡️⚡️
#ETH #Cryptocurrency #TechnicalAnalysis #DYOR
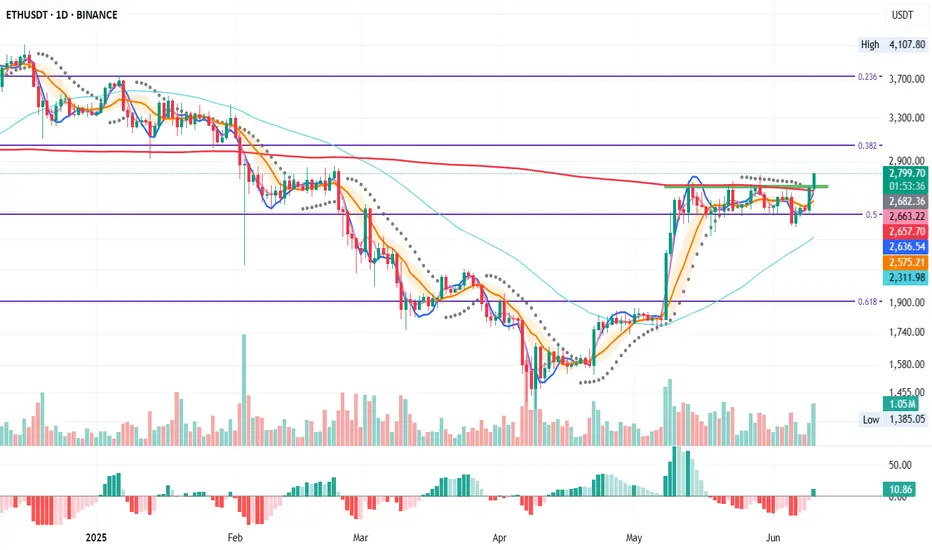
ETH 3D – Between Panic and Balance
When panic hits, zoom out and try to find balance.
ETHUSDT on the 3D timeframe just had its strongest rejection from the 200MA in this rejection series that started on May 13—exactly one month ago.
Price is now once again retesting the 0.5 Fib, continuing the same retesting pattern that began on May 13.
Touching the 200MA often triggers profit-taking from traders.
On the macro side, recent events are causing panic and prompting sell-offs.
Now let’s see if hitting the 0.5 Fib will bring buyers back in.
Looking at the volume bars from the past month, buying volume is increasing while selling volume is declining . This could suggest that in this choppy range, sellers are stepping back while buyers are starting to build strength.
MLR = SMA = BB center, confirming the current sideways environment.
The 50MA hasn’t even started to flatten—it’s still pointing down.
Always take profits and manage risk.
Interaction is welcome.

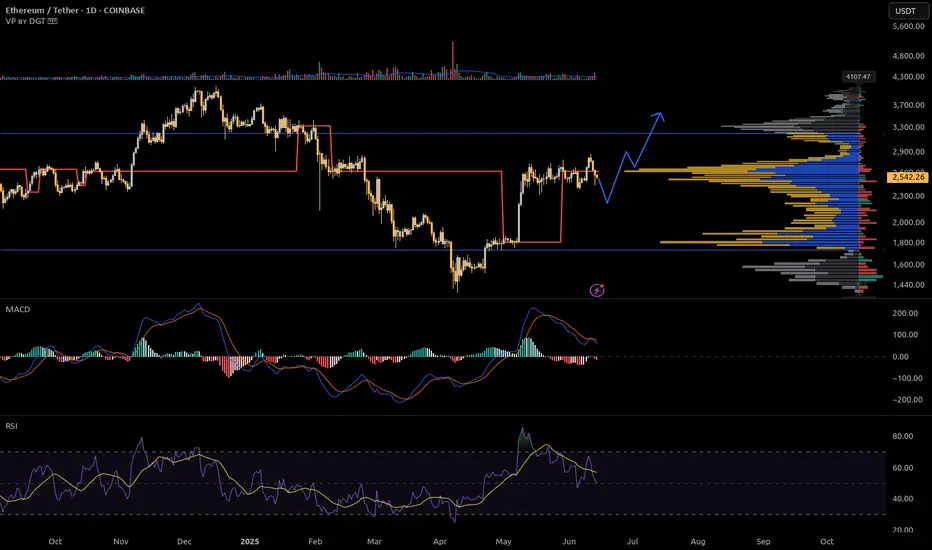
ETHUSDTIt will go to 2000 FVG after consolidating I might go back to 3000.
It probably will not come to 1600. More likely Go to 3000.
ETH - ReTestETH - Break out + ReTest
ETH broken out and Re Testing the previous resistance. Hopefully resistance becomes support!
Up only from here!
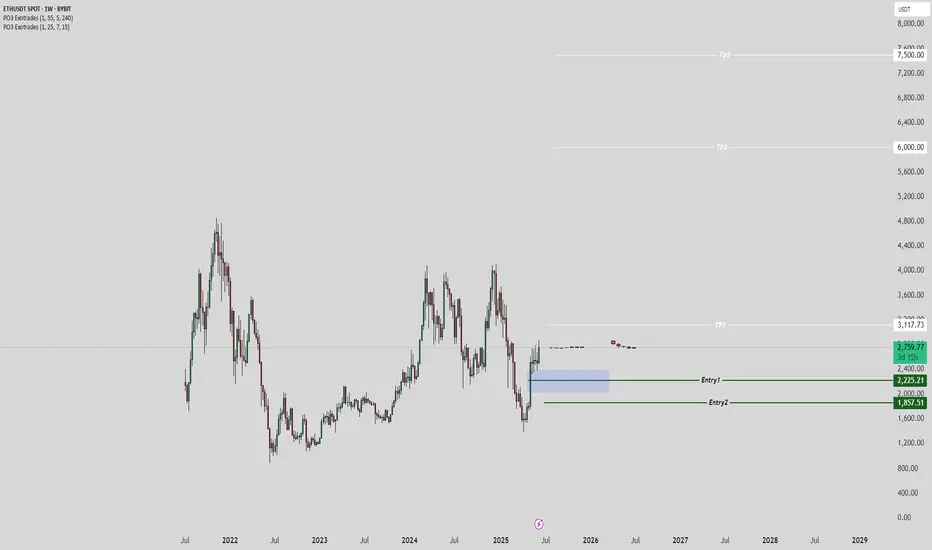
Ethereum's Road to $7500 – Strategic Entries & Profit Optimizati🔵 Entry Zone: My first position is placed at $2225.5, aligning with a strong support level, while a secondary entry at $1857.5 serves as an additional safeguard against unexpected market swings—lowering my average purchase price and protecting capital.
💰 Profit-Taking Strategy: For low-risk traders, securing a 40% profit from the first entry is a prudent move to lock in gains early. However, my long-term target remains ambitious.
🚀 Main Target: Based on valuation models and fundamental news, Ethereum’s upside potential points toward $7500. However, I personally plan to secure 90% of my holdings at $6000, ensuring strong profit realization while leaving room for further upside.
This setup balances risk management, smart positioning, and strategic profit optimization. Let’s see how ETH’s trajectory unfolds!
Entry1: 2225.5
Entry 2: 1857.5
If your second entry is successful, you are required to withdraw 50 to 70 percent of your capital to maintain your capital. I will definitely update this setup.
Posible short scalp im seeing on eth Previous High SSL been taken im seeing simple standard deviation on 1HTF
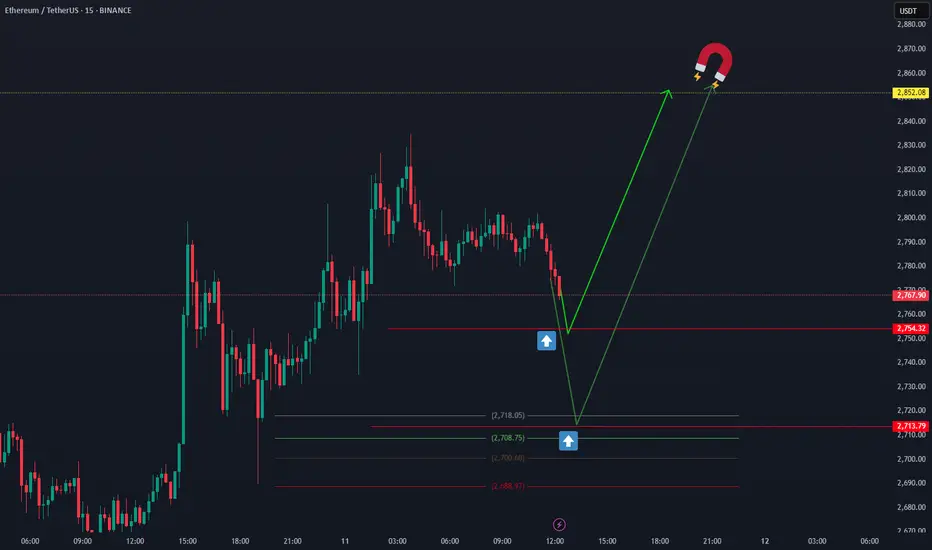
ETHUSDTEthereum could move from these two price areas to 2852.08,
It seems like a definite move at that price. BINANCE:ETHUSDT
ETHUSD FAV CRYPTOChart is More Detail in description. Road to ATH.
Crypto Adoption being done Globally
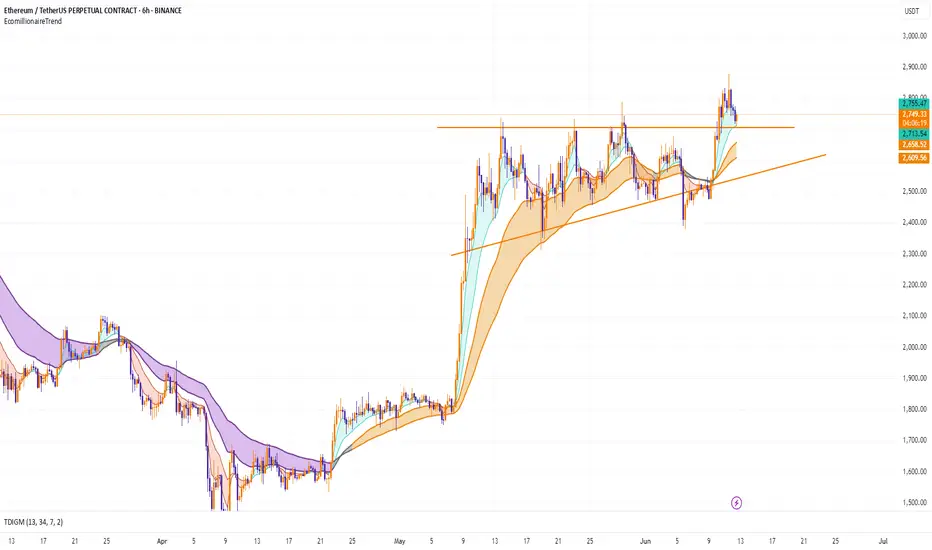
HolderStat┆ETHUSD move in accumulation zoneHolding CRYPTOCAP:ETH in the range of 2,520 - 2,750 formed an accumulation zone. Breakout of this range gives an opportunity for growth of 3,000+

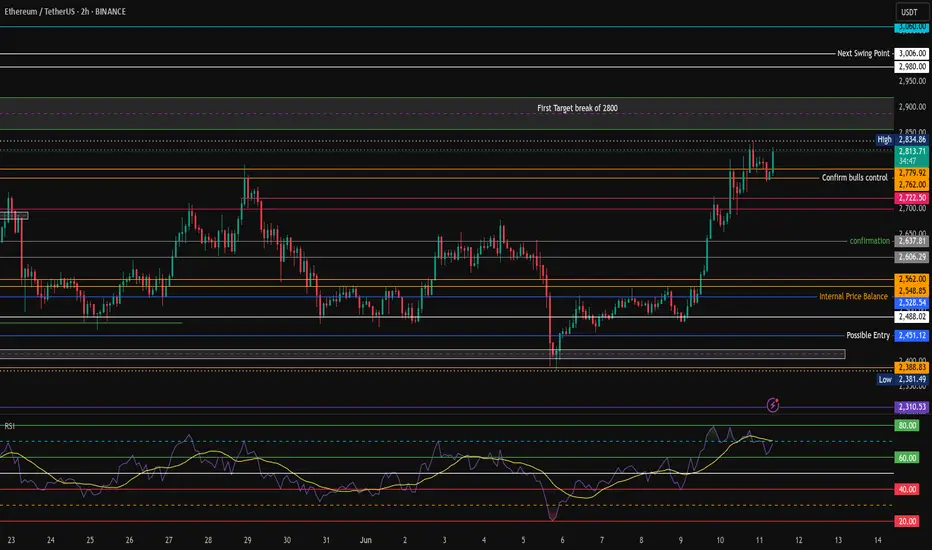
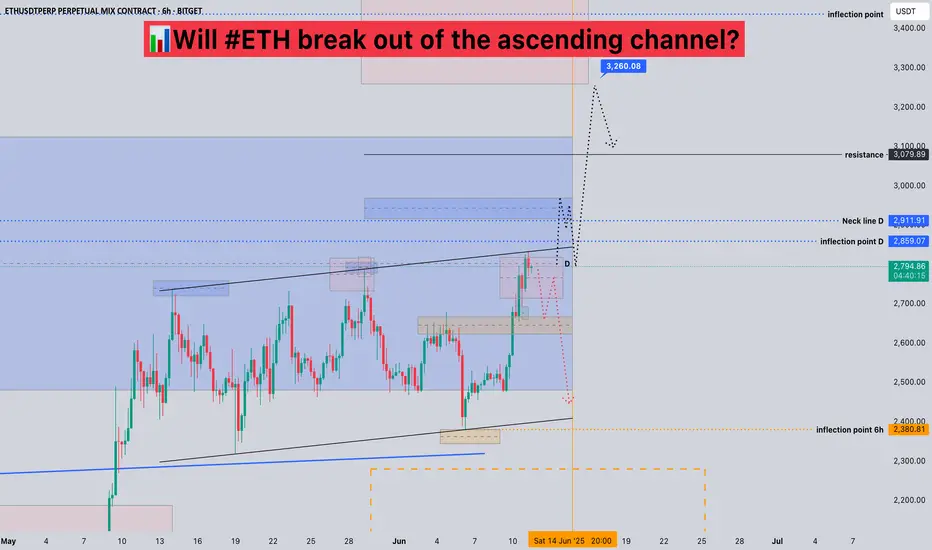
Will #ETH break out of the ascending channel?📊Will #ETH break out of the ascending channel?
🧠From a structural perspective, we are currently in the resistance zone at the daily level, so we have digested the selling pressure here by sideways consolidation. Because the selling pressure here is large, we still need to remain cautious.
➡️From a graphical perspective, we are currently blocked at the upper edge of the ascending channel, so we need to be vigilant about the risk of a pullback at any time. If we continue to break upward, then we need to pay attention to trading opportunities after the support and resistance conversion.
⚠️Even if it breaks upward, the nearby 2911 is also resistance. If it breaks upward again, then the resistance worth our attention is around 3300.
Let's see 👀
🤜If you like my analysis, please like 💖 and share 💬 BITGET:ETHUSDT.P

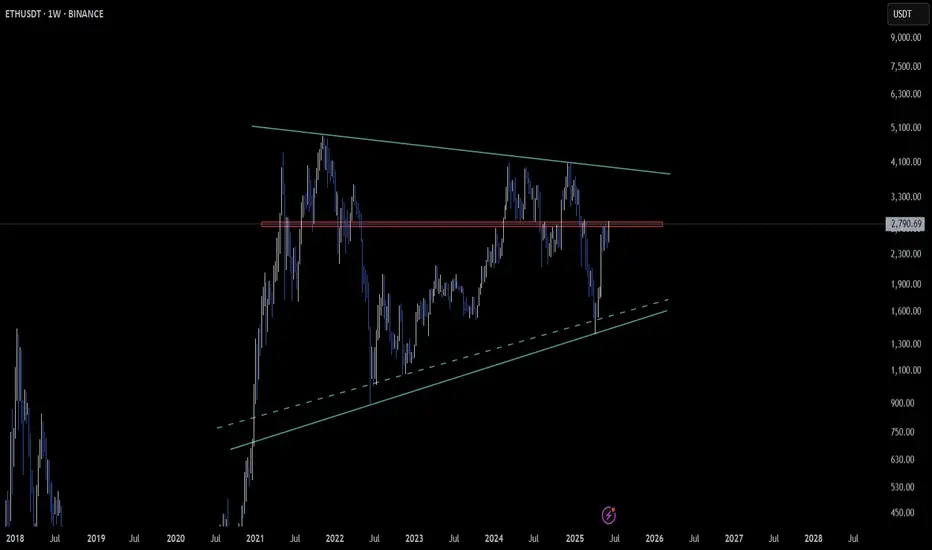
ETH Building a Bullish Base – Weekly Pennant in Play
CRYPTOCAP:ETH is sculpting a bullish pennant on the weekly timeframe 📈, gathering strength for what could be a fresh surge.
Price is consolidating just below the $2800–$2820 zone — a critical area to watch for a breakout and confirmation of a bullish shift.
A decisive move above this zone could open the door for a new wave of upside momentum 🔥.
For now, patience is key: let this weekly structure reveal its true intentions! 🌟
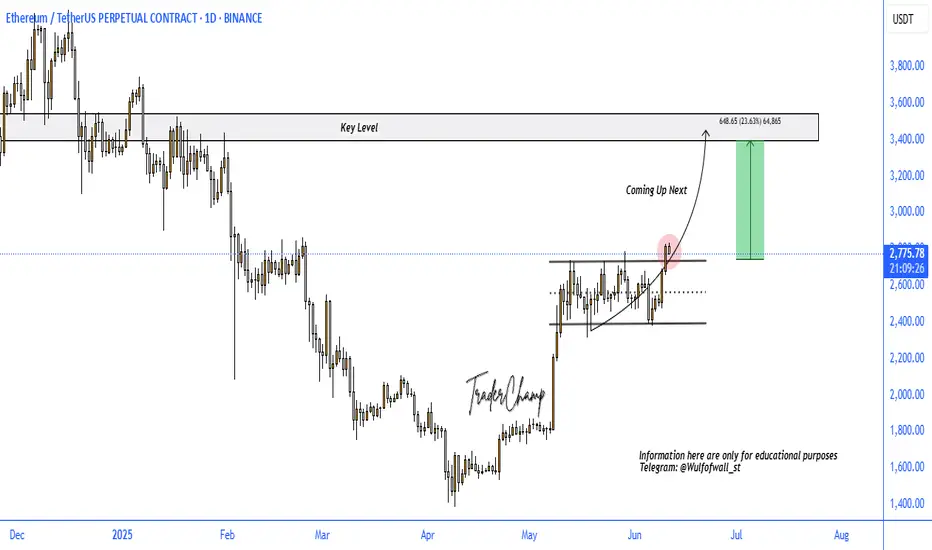
ETH BULLISH SETUPEthereum has recently broken out bullishly on higher timeframes, signaling a potential move toward the key resistance zone around $3,460. This level holds significant technical importance. The breakout above the hourly flag pattern confirms bullish momentum. As long as price holds above $2,300, the setup remains valid. A drop below this level would invalidate the current bullish outlook.
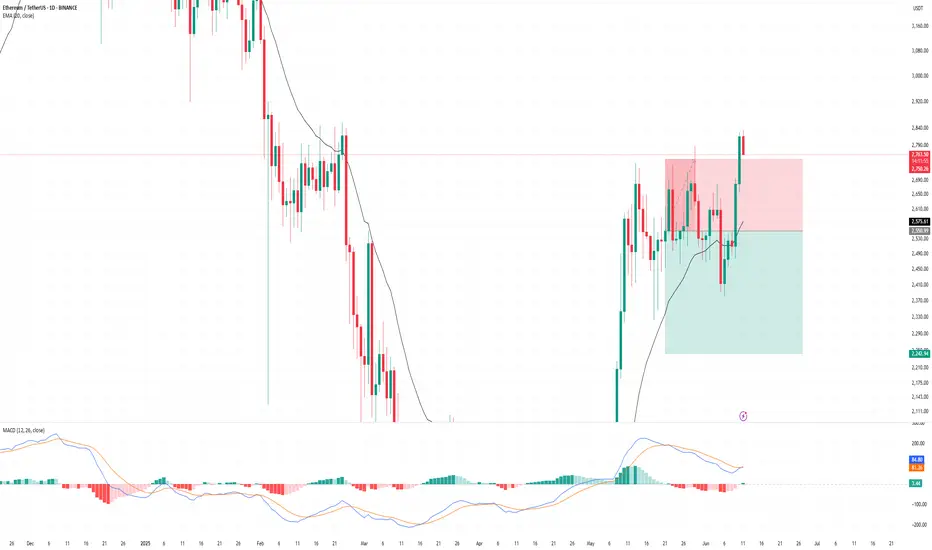
ETH Daily Close Signals Entry
On the daily, ETH is closing above both the 200MA and the previous tops. PSAR on the original system has flipped, though the free-to-use version hasn’t yet.
This is a trading idea. If you choose to allocate real capital, be prepared for the possibility of loss. But if you trust the system enough to allocate capital, trust that the PSAR has flipped and today’s close marks the entry.
It’s exactly how the system defines a valid setup:
Daily close above the 200MA, with MLR > SMA > BB center.
The 12H timeframe acts as confirmation from the lower TF, and the 4H is already green and ripping.
So buckle up—this could be a ride worth taking.
Always take profits and manage risk.
Interaction is welcome.
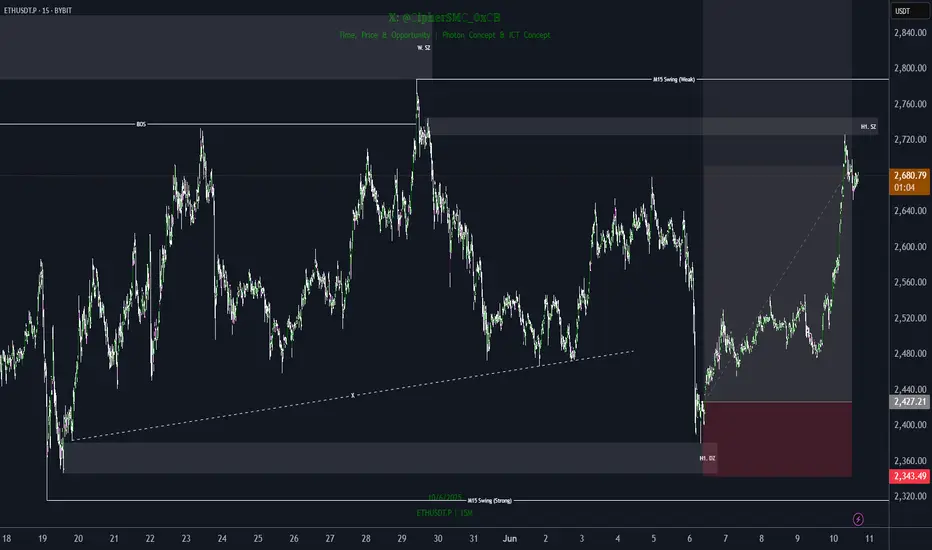
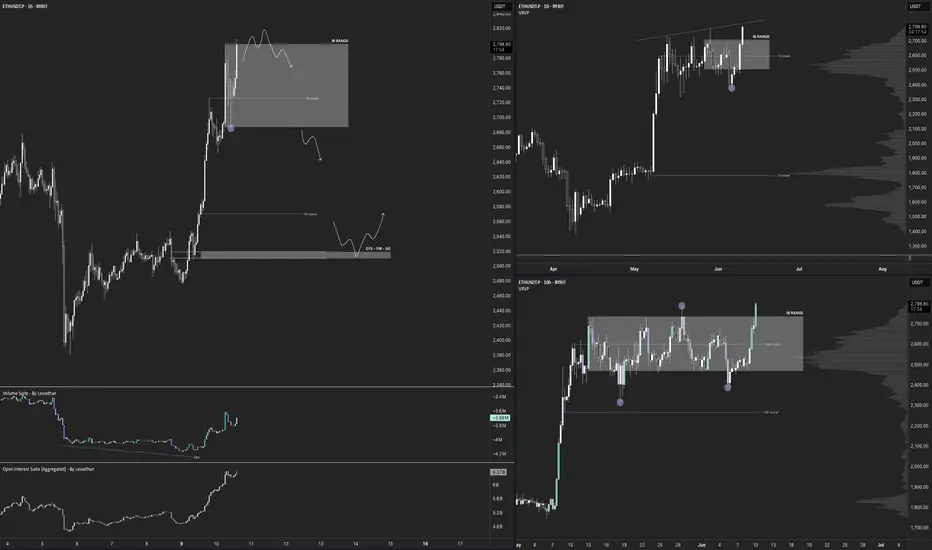
$ETH - Top DownBYBIT:ETHUSDT.P Top Down (10/06/25)
V-Levels Bias
Weekly = Bullish
Daily - Bullish
10-Hour = Bullish
1-Hour = Bullish
V-Levels Momentum
Weekly = Bearish FA
Daily = Neutral
10-Hour = Neutral
1-Hour = IB Range (Neutral)
DeCode Market Breakdown
Macro Context
Weekly Chart
Strong bullish MS, printing clean HHs and HLs.
Price has rejected from the same V-Level multiple times.
Rejections are paired with high relative volume and aggressive selling footprints → indicates strong passive interest above.
This area is not ideal for aggressive long entries.
Daily Chart
Still in bullish structure, holding above key POCs and range lows.
The Failed Auction at IB lows has added fuel for upside momentum.
However, we’re trading right into a potential liquidity pocket just below resistance.
Context calls for a wait-and-see approach: either clear breakout or rejection confirmation.
Intraday Picture (10H & 1H)
10H Chart
Still within an Inside Bar (IB) range.
FA at range lows suggests momentum continues upward — but we are at the top of the range.
Key risk: trap above range highs → ideal area for shorts if we get absorption and selling imbalance.
1H Chart
Market is rotating inside the current IB range.
No breakout confirmed yet.
Best short setup: Rejection from IB Highs + Absorption on CVD / Footprint charts.
Breakdown scenario: Short on range low breakdown with volume confirmation.
Longs: Only valid if HTFs confirm breakout → then look for bullish retest or mid-retest entries.
⸻
Summary & Trade Plan
Big Picture: Still bullish, but this isn’t the area to long blindly.
Short Setup 1: Rejection from IB Highs with clear absorption + imbalance.
Short Setup 2: Breakdown below IB Range Lows with volume follow-through.
Long Setup: Wait for HTF confirmation of breakout. If confirmed → retest of prior resistance as support.
Final Notes
This is where traders get chopped. HTF resistance meets LTF momentum.
Let price prove itself. Let volume confirm the move.
No breakout = no long. No trap = no short.
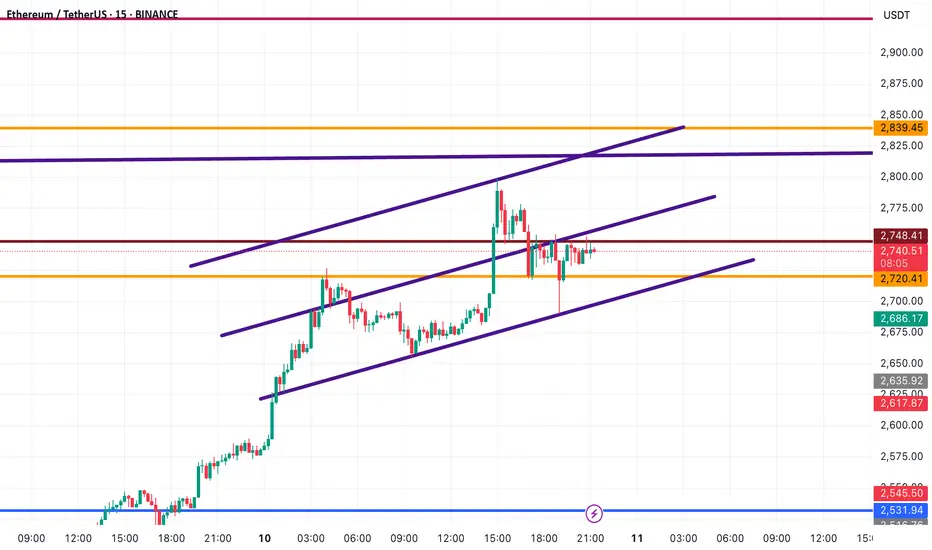
ETH Midline Break Could Be Key!🚨 ETH Midline Break Could Be Key!
Keep a close eye on this channel and its midline — they’ve been highly respected by price action.
If Ethereum breaks above the midline, we could see momentum push price toward the upper boundary of the channel.
This setup could offer great risk-reward opportunities for smart entries.
Don’t trade blind — watch the levels that matter!
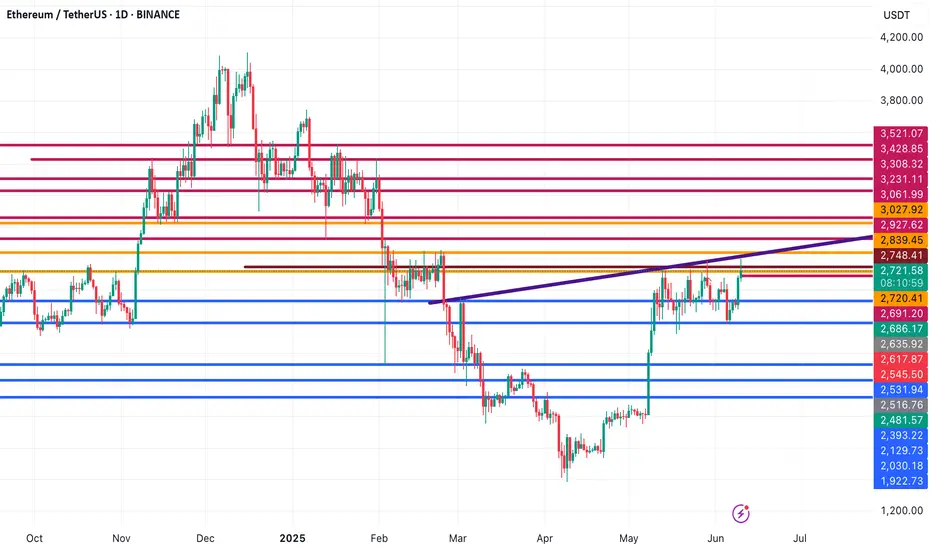
ETH/USDT High Time Frame Analysis | Major Zones📈 ETH/USDT High Time Frame Analysis | Major Zones You Need to Watch
This is a quick Ethereum update on the daily chart, focusing on the key support and resistance levels. These zones have consistently acted as strong reaction points — so don’t ignore them in your trading setup.
🟢 Bullish Scenario: Breakout in Progress?
Ethereum is currently testing the $2,748 resistance.
If price can break and close above this level, the next challenges are:
🔼 The descending trendline
🔼 $2,839 — a major historical resistance
A confirmed breakout above both could send ETH toward:
$2,927
$3,061
Watch for strong volume and candle confirmations on higher time frames.
🔻 Bearish Scenario: Rejection from Resistance
If ETH gets rejected from $2,839, expect a potential pullback to:
$2,748 as the first support
$2,535 as the next key level to hold
These areas could offer bounce opportunities — or trigger deeper corrections if broken.
🧠 Pro Tip:
Smart traders prepare for both scenarios. Use these zones to plan precise entries and exits — and always wait for candle confirmation before making moves.
📌 Follow for more accurate levels, chart clarity, and real-time setups.
Let's master the market — one level at a time! 🚀
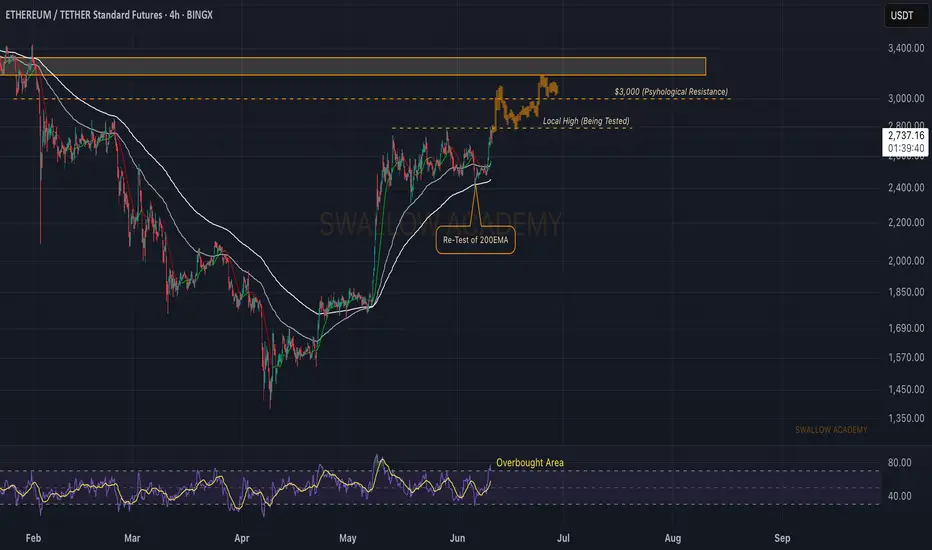
Ethereum (ETH): Testing Local High, Looking For Bullish MoveEthereum is showing some strong signs of upward movement, where we are testing the local high area after a successful retest of the 200EMA.
We are looking for a breakout from here, which would then give us a good movement to upper zones toward the $3000 area.
Swallow Academy