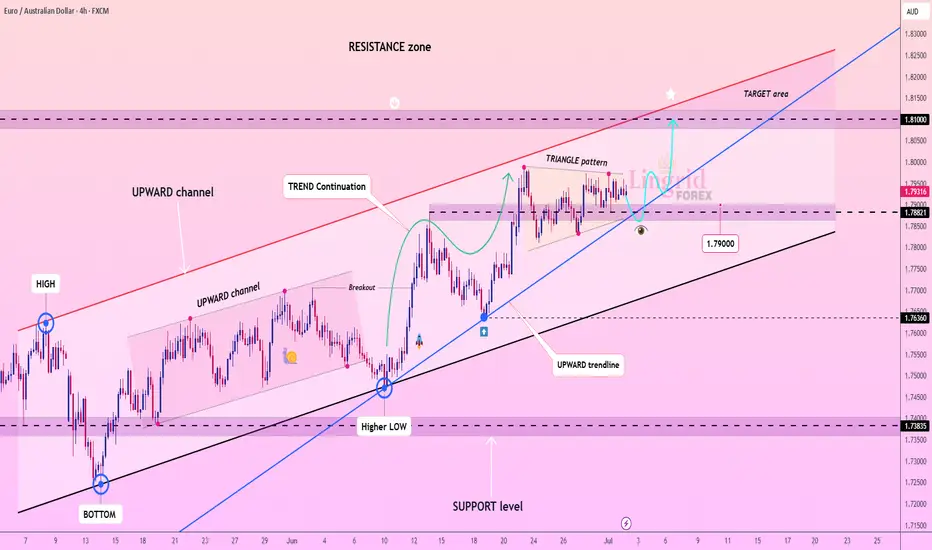
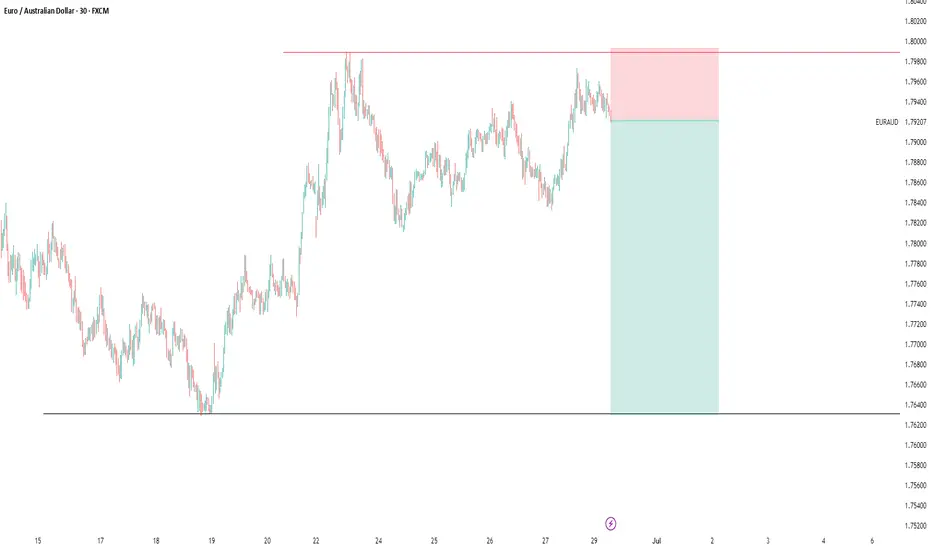
Lingrid | EURAUD Trend Continuation Pattern FX:EURAUD is maintaining bullish momentum within a broad upward channel after bouncing from the 1.7900 support zone and forming a triangle continuation pattern. Price is coiling just below the 1.8000 handle and the red resistance boundary of the channel. A confirmed breakout above 1.8000 could open the path toward the 1.8100 target area, extending the broader bullish structure.
📈 Key Levels
Buy zone: 1.7880–1.7900
Sell trigger: breakdown below 1.7880
Target: 1.8100
Buy trigger: breakout and retest of 1.8000–1.8020 zone
💡 Risks
Rejection from 1.8000 resistance could trigger a pullback
Break below the blue trendline may invalidate bullish setup
Low momentum breakout may stall below 1.8050
If this idea resonates with you or you have your own opinion, traders, hit the comments. I’m excited to read your thoughts!
EURAUD trade ideas
#EURAUD: Two Swing Bullish Entry Worth Thousands Pips! EURAUD is currently at a critical level, and the price isn’t yet decided for the next move. However, the current price behaviour suggests strong bullish volume presence in the market. There are two areas to buy from. The first is activated, and we think price could just be starting the next bull run from this point. The second entry is a safe point if price does decide to drop further and fill up the daily Fair Value Gap.
We wish you the best in trading.
If you want to support us, you can do the following:
- Like the idea
- Comment on the idea
- Share the idea
If you have any questions or concerns about the analysis or trading in general, please let us know in the comment box.
Team Setupsfx_
❤️🚀
EUR_AUD LOCAL SHORT|
✅EUR_AUD is going up now
But a strong resistance level is ahead at 1.8018
Thus I am expecting a pullback
And a move down towards the target of 1.7900
SHORT🔥
✅Like and subscribe to never miss a new idea!✅
Disclosure: I am part of Trade Nation's Influencer program and receive a monthly fee for using their TradingView charts in my analysis.
On the 45M, price is breaking out of the channel.On the 45M, price is breaking out of the channel, if it pulls back to a demand area, I’ll confirm a possible buy entry in line with my zones.
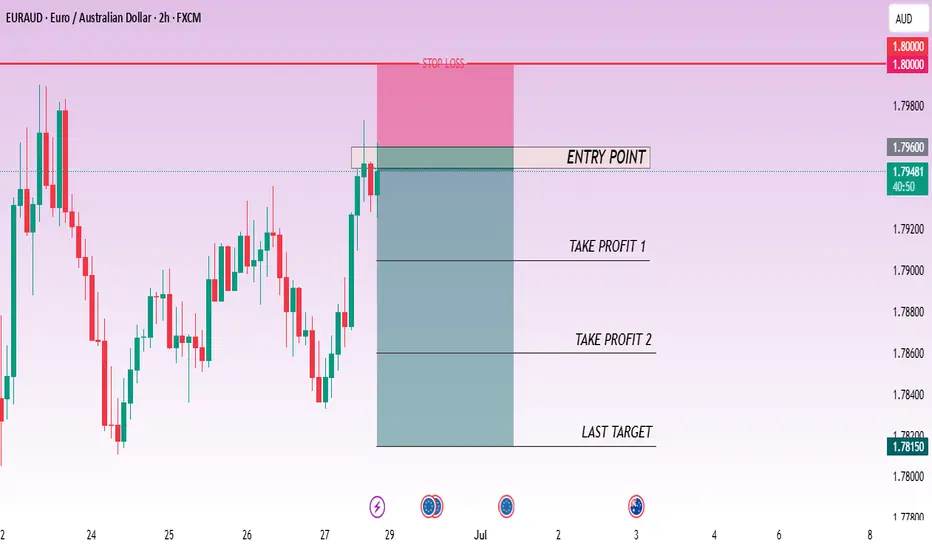
CHECK EURAUD SIGNAL READ CAPTAINsell Setup)
Entry Zone: Around 1.79600\1.79500
Stop Loss: 1.80000
Take Profits:
TP1: ~1.79050
TP2: ~1.78600
Final Target: 1.78150
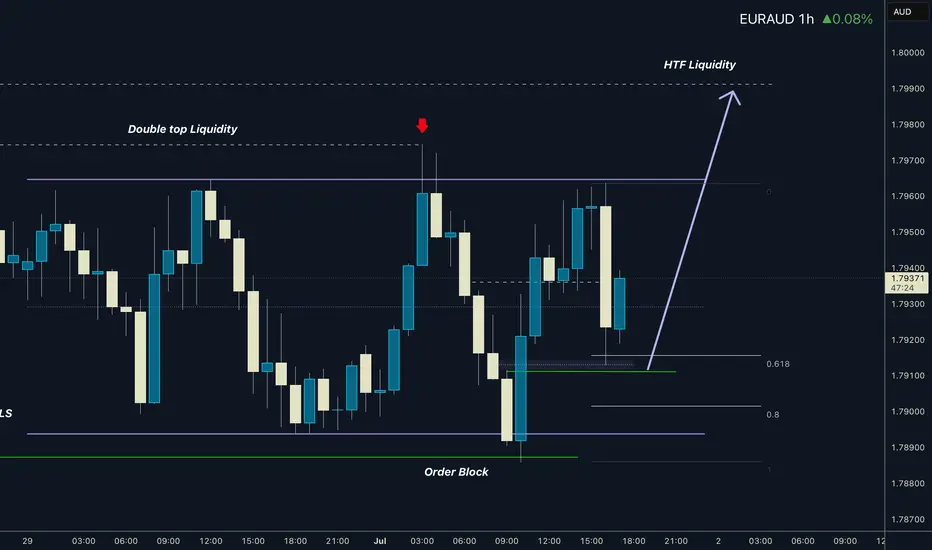
EURAUD I Monday CLS I Model 2 I Double TOP LQHey, Market Warriors, here is another outlook on this instrument
If you’ve been following me, you already know every setup you see is built around a CLS Footprint, a Key Level, Liquidity and a specific execution model.
If you haven't followed me yet, start now.
My trading system is completely mechanical — designed to remove emotions, opinions, and impulsive decisions. No messy diagonal lines. No random drawings. Just clarity, structure, and execution.
🧩 What is CLS?
CLS is real smart money — the combined power of major investment banks and central banks moving over 6.5 trillion dollars a day. Understanding their operations is key to markets.
✅ Understanding the behavior of CLS allows you to position yourself with the giants during the market manipulations — leading to buying lows and selling highs - cleaner entries, clearer exits, and consistent profits.
📍 Model 1
is right after the manipulation of the CLS candle when CIOD occurs, and we are targeting 50% of the CLS range. H4 CLS ranges supported by HTF go straight to the opposing range.
"Adapt what is useful, reject what is useless, and add what is specifically your own."
— David Perk aka Dave FX Hunter ⚔️
👍 Hit like if you find this analysis helpful, and don't hesitate to comment with your opinions, charts or any questions.
EURAUD Swing BuyEURAUD gathers strength for a possible swing move to the upside. An evident bullish flag pattern has emerged, it is all about getting the right entry
EURAUD: Aussie Strength Supported by Peace in the Middle EastEURAUD: Aussie Strength Supported by Peace in the Middle East
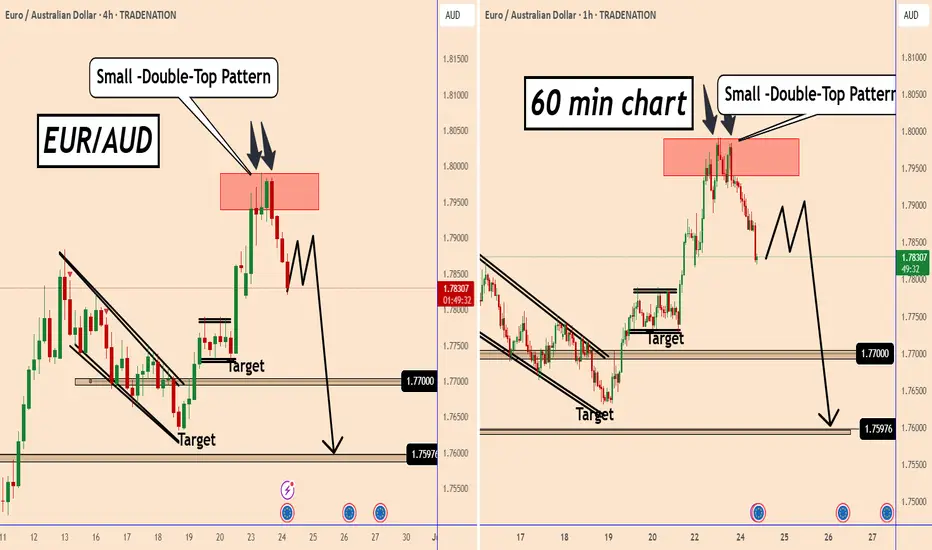
EURAUD confirmed a small double top pattern, and news of a ceasefire in the Middle East between Israel and Iran gave the Aussie a boost.
All the candles have been read so far, showing that the AUD has come back stronger.
Given that it has been overbought for a long time, it's expected that a small pause will occur before EURAUD can fall further.
The first target I am looking at is near 1.7740 and 1.7650.
You may find more details in the chart!
Thank you and Good Luck!
❤️PS: Please support with a like or comment if you find this analysis useful for your trading day❤️
Disclosure: I am part of Trade Nation's Influencer program and receive a monthly fee for using their TradingView charts in my analysis.
EURAUD -0.7% Short and AUDUSD MistakeA short position taken on EURAUD for a small loss after manually closing before swaps. I have also included a breakdown of a +4% AUDUSD long I was looking at taking but a small error on my behalf that caused me to stay out of the trade. Full explanation as to why I executed on this position and made the decision to manually close at the level I did.
Any questions you have just drop them below 👇

EURAUD sell signal. Don't forget about stop-loss.
Write in the comments all your questions and instruments analysis of which you want to see.
Friends, push the like button, write a comment, and share with your mates - that would be the best THANK YOU.
P.S. I personally will open entry if the price will show it according to my strategy.
Always make your analysis before a trade
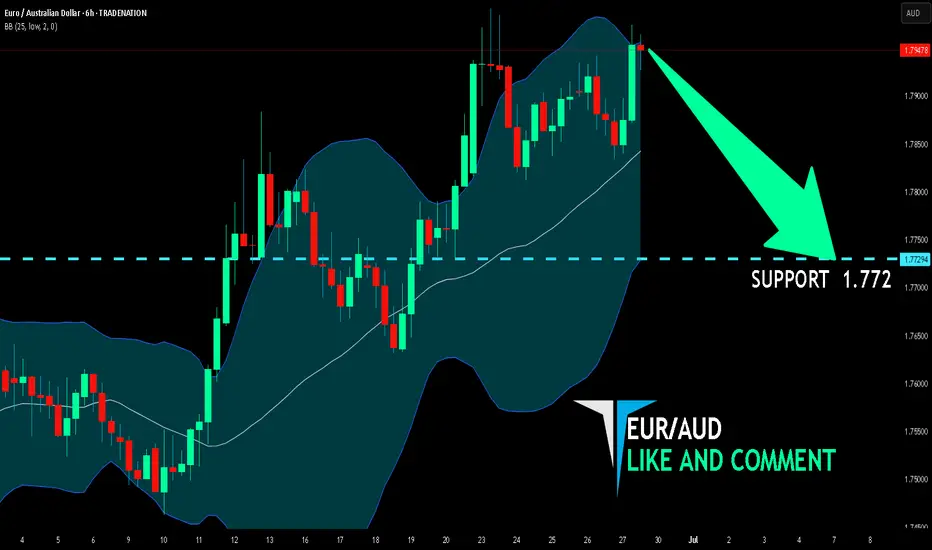
EUR/AUD BEST PLACE TO SELL FROM|SHORT
Hello, Friends!
We are going short on the EUR/AUD with the target of 1.772 level, because the pair is overbought and will soon hit the resistance line above. We deduced the overbought condition from the price being near to the upper BB band. However, we should use low risk here because the 1W TF is green and gives us a counter-signal.
Disclosure: I am part of Trade Nation's Influencer program and receive a monthly fee for using their TradingView charts in my analysis.
✅LIKE AND COMMENT MY IDEAS✅
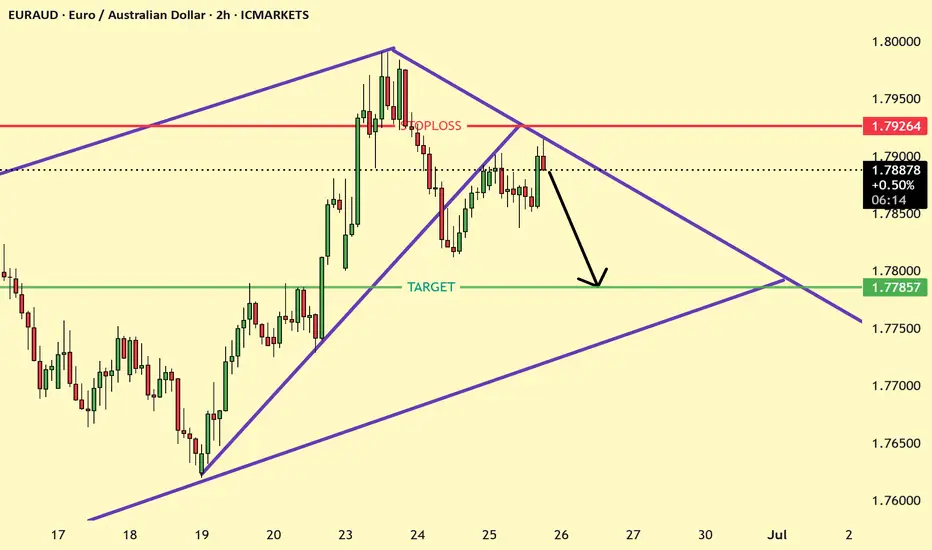
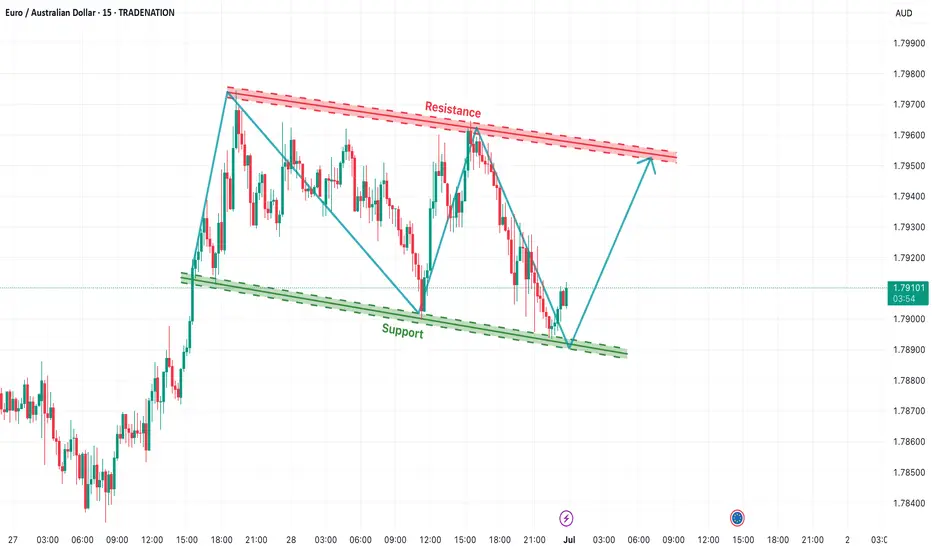
Potential Bearish Reversal from Rising Wedge BreakdownThe EUR/AUD 2-hour chart illustrates a rising wedge pattern that has recently broken to the downside, suggesting bearish momentum. After a failed retest near the 1.79264 resistance (also marked as stop-loss), the price appears to be rejecting lower highs. The black arrow indicates a projected bearish move toward the lower wedge trendline, around the 1.77500 region. This setup supports a short bias unless the price breaks above the red resistance line.
EURAUD - Nice short opportunity (big risk to reward)Don't normally trade these crosses but ever so often they present themselves with bigger structure opportunities that make it worth to take the trade. Oh boy you will need a lot of patience if you are going to trade this!
Anyways, the levels are on the chart. We just took this too. If it goes to target it's gonna take ages...
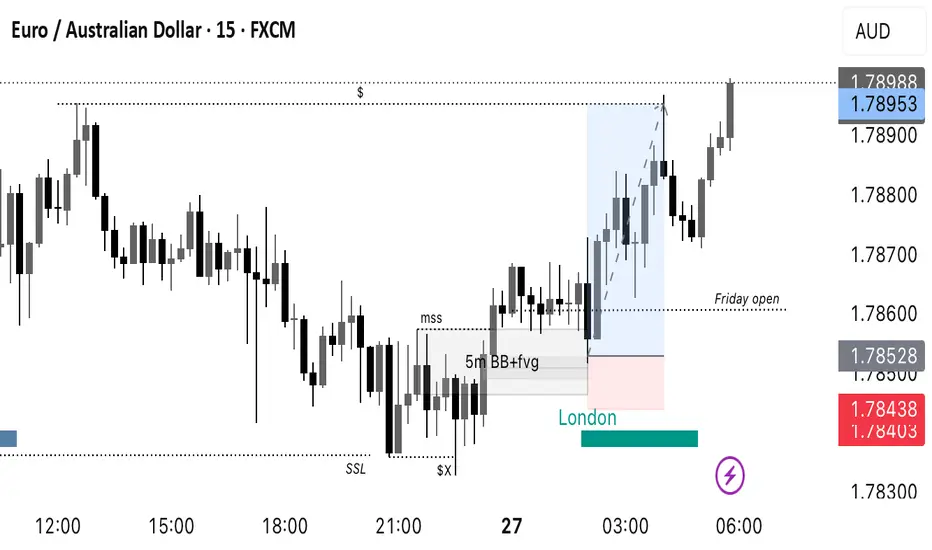
Utilising ICT’s Breaker BlocksBreaker blocks or simply called breakers are failed order blocks which are being retested same way with the break and retest entry pattern.
However I simply don’t trade this pattern whenever it presents itself on the charts.
There are certain conditions that has to be met before I seek to enter.
1. Firstly, prior to the order block(turned break block) being failed I need to see a grab of liquidity(either buy side or sell side liquidity depending on our directional bias which is the draw on liquidity).
2. After the grab of liquidity I expect to see a clean failure of the order block. Price has to push through the order block with momentum.
3. I expect to find a fair-value-gap as a result of that clean break within that failed order block (turned breaker block).
4. With these 3 factors in place I would not consider to enter if this setup does not occur at key levels. Which could be at the liquidation of an old higher timeframe swing low or high, higher timeframe fair-value-gap or inverted fair-value-gap, or a higher timeframe order block. This is to help understand market structure and direction.
5. Lastly, the above 4 factors needs to align with the I.C.T kill zones. I preferably prefer the London morning session 2am to 5am New York time.
Having these factors in complete alignment, my target is usually at the 50% mark of the Fibonacci or a key internal level (internal liquidity for example swing high/low, fair-value-gap etc) close to the 50% mark.
The chart picture above is an example of the breaker block entry model on EurAud during the London morning session.
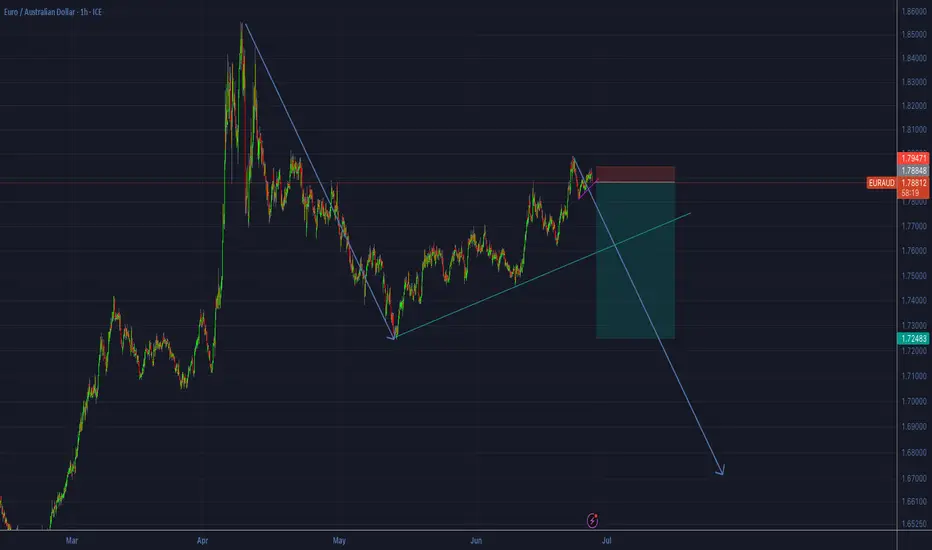
EURAUD: Possible Swing Movement of 660 pips expected! FX:EURAUD on daily candles of last few days breakthrough and now dropping back to demand zone where we expect price to bounce strongly and at least we expect target one to accomplished by end of January. While target two and three remain a long away from our current price area. Stop Loss should be below the strong wick of daily candle.
From fundamentals side AUD will be weaken and EURO can be bullish for next few months, taking entry will require a strict risk management as this is a swing trade, do not expect to achieve the target in couple of hours or days.
Good luck and trade safe.

#EURAUD: Daily Timeframe Suggest Major Price Correction! EURAUD is currently implementing a significant correction, which could potentially be advantageous for swing traders like ourselves. This correction presents an opportunity to execute swing trades.
There are two potential entry points for swing trades: a risky trade and a safer trade option.
Best of luck and trade safely!
Warm regards ❤️
Team Setupsfx_

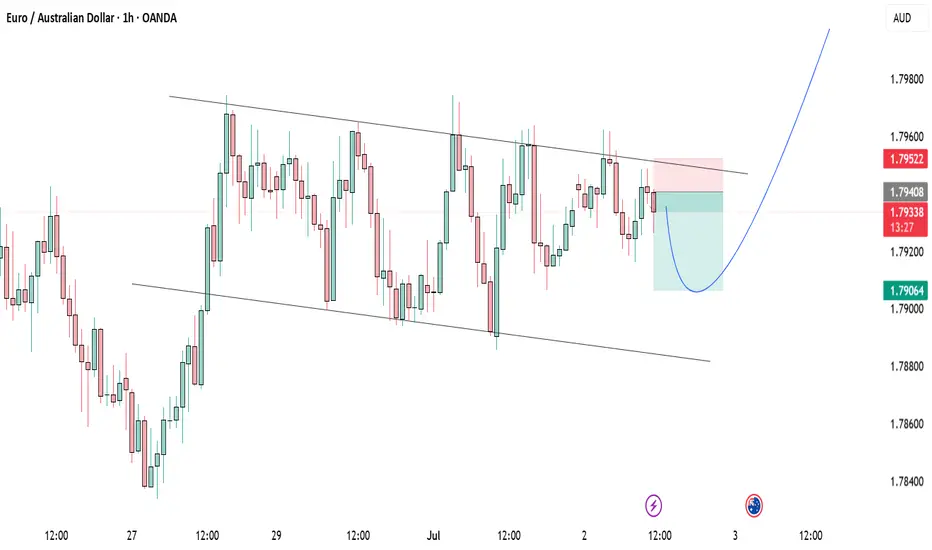
EUR/AUD Falling Channel Reversal SetupThe EUR/AUD pair is currently trading inside a well-respected falling channel structure on the 15-minute timeframe. Price action has been bouncing between a descending resistance trendline and a sloping support zone, confirming the integrity of the pattern. The pair recently rebounded from the lower boundary of the channel, indicating potential short-term bullish momentum ahead.
This setup highlights a typical channel reversal bounce, offering a high-probability trading opportunity if the pair maintains upward pressure.
📈 Bullish Scenario – Intraday Channel Rebound
The price has touched the support line near 1.7885 and is now climbing higher.
Based on previous cycles, price tends to move from support to resistance within this channel.
A bounce from this level may lead to a move toward the upper channel resistance zone around 1.7960–1.7970.
The blue arrows illustrate the expected zig-zag movement within the channel.
📉 Bearish Scenario – If Support Fails
If the price breaks below 1.7880, it would indicate a channel breakdown, invalidating the bullish setup.
Such a move could lead to fresh downside targets near 1.7850 or lower, continuing the micro downtrend.
🎯 Intraday Trade Plan
Buy Setup (Reversal Play):
Entry: 1.7895–1.7905 (after candle confirmation on support)
SL: Below 1.7875
TP: 1.7950–1.7970 (channel top)
Sell Setup (on rejection or breakdown):
Entry: Near 1.7960 resistance or breakdown below 1.7880
SL: Above 1.7980
TP: 1.7850 and below
🧭 Technical Outlook Summary
Pattern: Falling Channel
Bias: Short-term bullish (reversal from support)
Key Zones: 1.7885 support | 1.7960 resistance
Watch for breakout beyond channel for directional confirmation
=================================================================
Disclosure: I am part of Trade Nation's Influencer program and receive a monthly fee for using their TradingView charts in my analysis.
=================================================================
EURAUD: Weak Market & Bearish Continuation
The charts are full of distraction, disturbance and are a graveyard of fear and greed which shall not cloud our judgement on the current state of affairs in the EURAUD pair price action which suggests a high likelihood of a coming move down.
Disclosure: I am part of Trade Nation's Influencer program and receive a monthly fee for using their TradingView charts in my analysis.
❤️ Please, support our work with like & comment! ❤️
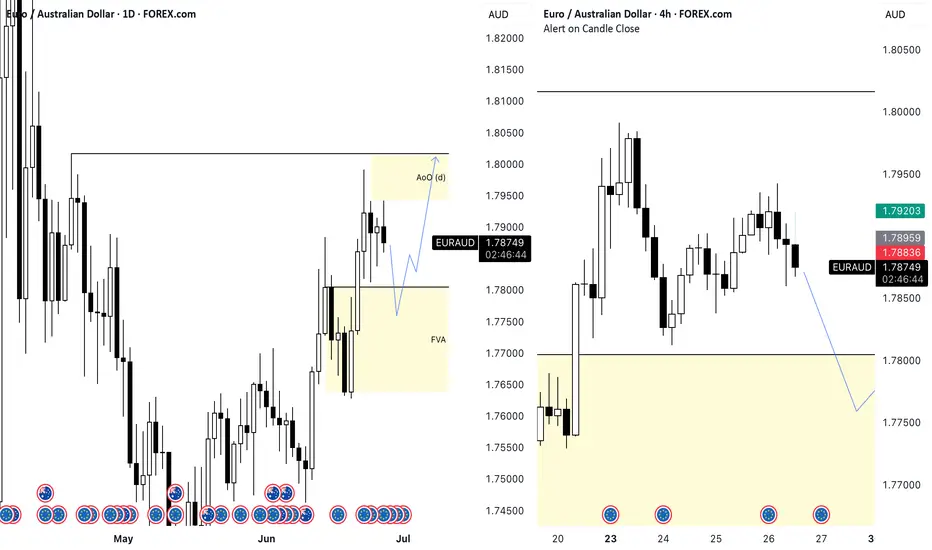
AoO Series No.2 - follow upThe development on the 4H time frame suggests that price would like to retrace to the D FVA before continuing higher. However, we do not want to get involved in shorts yet. We just observe the retracement.
A good reaction from the FVA could give us a nice entry to continue higher.
EURAUD → Breakout and consolidation above key supportOANDA:EURAUD is trying to consolidate above the key support zone of 1.76 - 1.77. Within the uptrend, bulls have a fairly good chance.
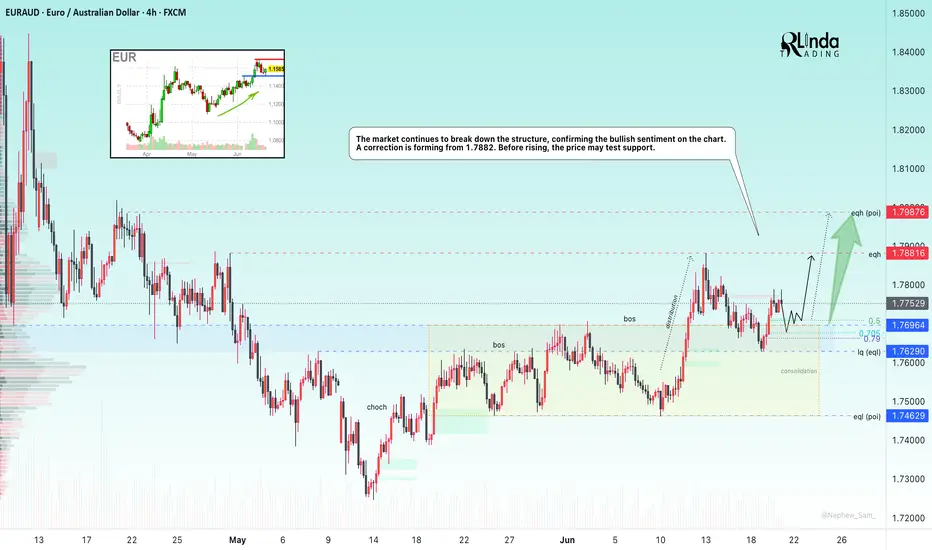
The market continues to break of structure, confirming the bullish sentiment on the chart. A correction is forming from 1.7882. Before rising, the price may test support. The currency pair is supported by its own bullish trend and the falling dollar (especially against the backdrop of economic problems with the USD (DXY)).
Technically, the currency pair looks quite positive. After the formation of another ‘bos’, we are seeing a correction to the Fibonacci zone of 0.7 and support at 1.7696. If, during the retest, the bulls manage to hold their ground above the key support level, growth may continue in the medium term.
Support levels: 1.7696, 1.7629, 1.7463
Resistance levels: 1.7882, 1.7988
Locally, a reversal pattern is forming relative to the specified zone (as part of a correction). We need to wait for confirmation (price consolidation above the level). The potential within the bullish trend is quite large, and in the medium and long term, the price may test 1.85.
Best regards, R. Linda!
EURAUD Energy buildup - coiling pattern The EURAUD currency pair maintains a bullish bias, underpinned by the prevailing upward trend. Recent sideways consolidation in intraday price action suggests a potential continuation pattern within the broader uptrend.
The key level to watch is 1.7880, marking the lower boundary of the recent consolidation range. A corrective pullback toward this level, followed by a bullish bounce, could trigger a fresh rally targeting resistance levels at 1.8020, then 1.8060, and potentially 1.8090 over the medium term.
Conversely, a decisive breakdown below 1.7880, confirmed by a daily close beneath this support, would invalidate the current bullish outlook. This would expose the pair to deeper retracement targets near 1.7840, followed by 1.7810.
Trend Bias: Bullish above 1.7880
Key Support: 1.7880, 1.7840, 1.7810
Key Resistance: 1.8020, 1.8060, 1.8090
Conclusion:
EURAUD remains technically constructive while holding above 1.7880. Traders should monitor this level for bullish continuation signals. A bounce from this zone could reinforce the uptrend, while a break and close below it would shift momentum and open the door for a deeper corrective move.
EURAUD BUY TRADE PLAN 2🔥 **EUR/AUD TRADE PLAN 🔥**
📅 **Date:** 02 July 2025
📋 **Plan Overview**
| Parameter | Details |
| ---------- | ------------------------------ |
| Type | Intra-day conditional breakout |
| Direction | Buy stop (breakout plan) |
| Status | Pending conditional trigger |
| R\:R | 3:1 (minimum) |
| Confidence | ⭐⭐⭐⭐ (85%) |
---
📈 **Market Bias & Trade Type**
Bias: Bullish continuation
Type: Breakout (stop-order conditional plan)
EUR/AUD is consolidating below a key breakout level (\~1.7965–1.7980) after a clean HTF bullish structure. D1 and H4 both show continuation bias; price is coiling beneath resistance.
---
🔰 **Confidence Level**
⭐⭐⭐⭐ (85%)
* D1/H4 bullish BOS + HTF structure: 35%
* Consolidation below resistance with compression: 30%
* Macro alignment (EUR supported by relative strength, AUD neutral): 20%
* Volume profile (build-up near top of range): 15%
---
📍 **Entry Zones**
🟩 **Primary (Breakout Stop):** Buy Stop @ 1.7983 (+3 pip buffer above 1.7980 range high)
❗ **Stop Loss**
SL: 1.7910 (below last H1 swing low inside structure + ATR buffer)
🎯 **Take Profit Targets**
🥇 TP1: 1.8030 (first liquidity sweep + minor HTF resistance)
🥈 TP2: 1.8080 (measured move target + H4 resistance)
🥉 TP3: 1.8120 (extension level, trail runner if breakout accelerates)
📏 **Risk\:Reward**
~3:1 to TP2
---
🧠 **Management Strategy**
* Risk 1% of account (adjust lots accordingly)
* Move SL to breakeven after TP1
* Scale: 50% TP1, 30% TP2, 20% trail for TP3
---
⚠️ **Confirmation Checklist**
✅ H4/H1 candle body close above 1.7980
✅ Volume spike on breakout
✅ London/NY session execution
✅ No major rejection wick at break
---
⏳ **Validity**
H1 setup → 12–18 hours (expires end of NY session 03 July 2025)
---
❌ **Invalidation**
* Clean return below 1.7910 = structure failure, plan voided
* HTF bearish BOS against
---
🌐 **Fundamental & Sentiment Snapshot**
* ECB stance: Hawkish / AUD macro neutral
* Sentiment score: +6 (EUR macro edge + technical structure)
* No red flag macro contradiction
* No opposing liquidity pool within immediate ATR
---
📋 **Final Trade Summary**
➡ Conditional buy stop breakout at 1.7983 if confirmation hits
➡ SL 1.7910, TP1 1.8030 / TP2 1.8080 / TP3 1.8120
➡ Risk 1%, clean confirmation required
---
✅ **NOTE:**
⚠ This plan is conditional: no risk applied unless break and confirmation occur.
The 4 Pillars of Price Action Trading Explained!!!!!All the information you need to find a high probability trade are in front of you on the charts so build your trading decisions on 'the facts' of the chart NOT what you think or what you want to happen or even what you heard will happen. If you have enough facts telling you to trade in a certain direction and therefore enough confluence to take a trade, then this is how you will gain consistency in you trading and build confidence. Check out my trade idea!!
tradingview.sweetlogin.com
