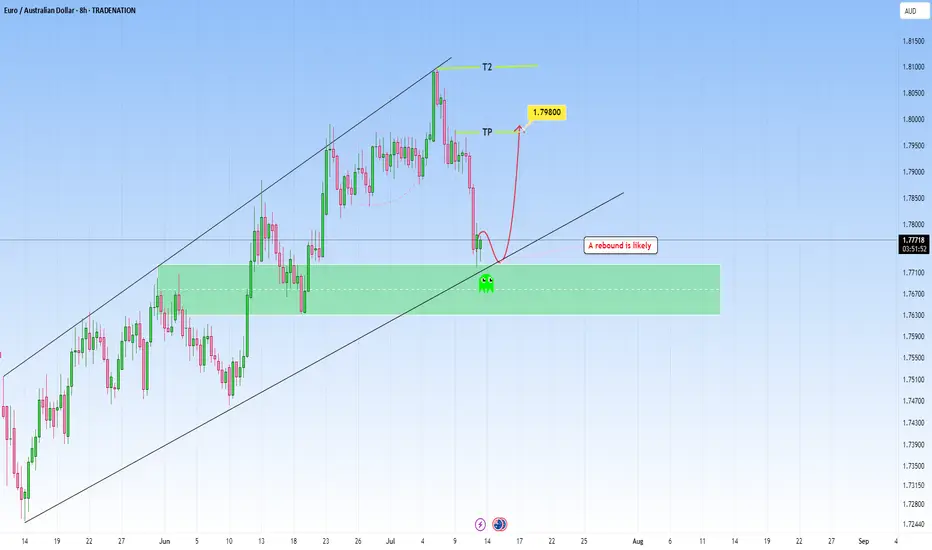
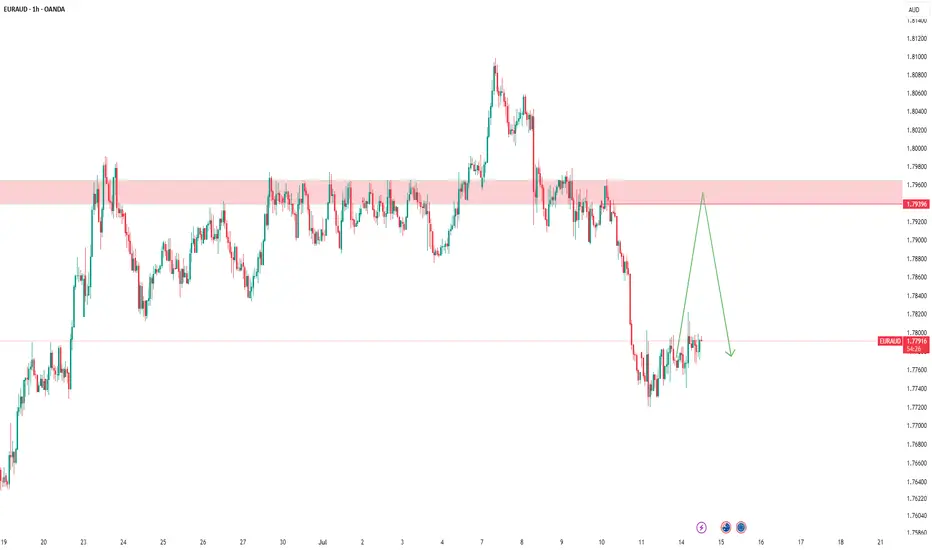
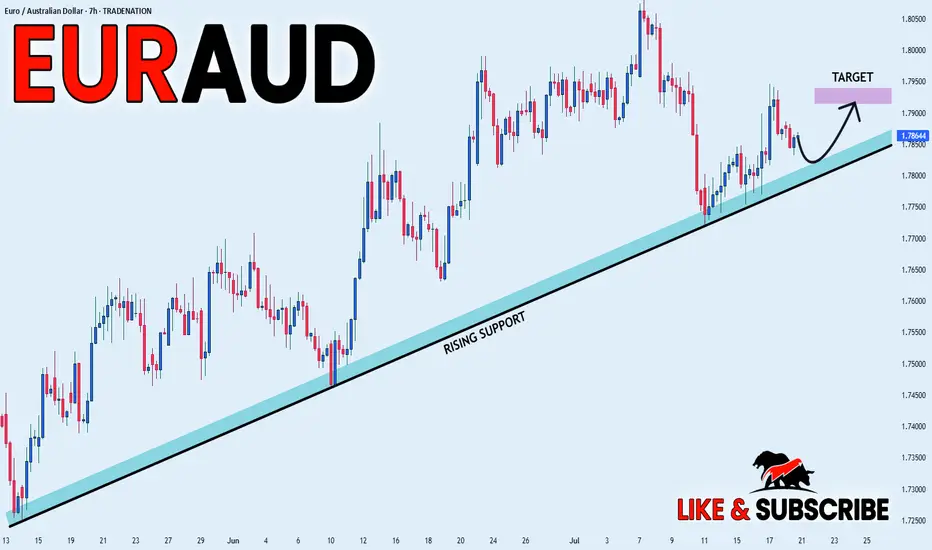
EURAUD: Rebound to 1.798 is high probabilityI am watching for a reversal here EURAUD as marked on my chart, expecting a rejection with a upside target at around 1.798.
This are is where it can become a decision point, either price finds support and bounces, or it breaks below, and that’s when we might see the move start to extend lower.
If we get a decisive move upside, my next area of interest is marked as T2. From there we can expect either potential accumulation or another reaction, depending on broader market sentiment at the time.
Just sharing my thoughts for the charts, this isn’t financial advice. Always confirm your setups and manage your risk properly.
Disclosure: I am part of Trade Nation's Influencer program and receive a monthly fee for using their TradingView charts in my analysis.
EURAUD trade ideas
Sell euraudMonthly sell structure valid
Now daily support trend line breaks and candel close below the trend and market making lower low
Just wait to break the fresh lower high

Possibility of a sell trigger being activated.If the channel breaks downward with a standard and confirmed candle, it could be a good position to take down to the 1.75000 level.

The 4 Pillars of PRICE ACTION - Explained!!!!!All the information you need to find a high probability trade are in front of you on the charts so build your trading decisions on 'the facts' of the chart NOT what you think or what you want to happen or even what you heard will happen. If you have enough facts telling you to trade in a certain direction and therefore enough confluence to take a trade, then this is how you will gain consistency in you trading and build confidence. Check out my trade idea!!
tradingview.sweetlogin.com

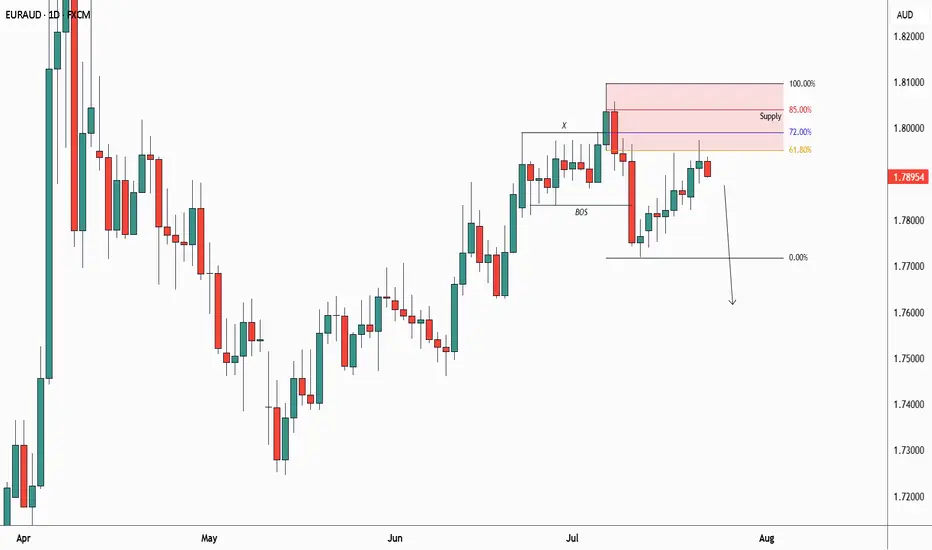
EURAUD: Waiting for the FVG Tap and Confirmation to ShortPrice ran previous liquidity and dropped aggressively, creating a clean FVG.
I’m now watching for price to retrace into that imbalance and form a strong bearish candle. If it does, I’ll be looking to short down
Clean structure. Just waiting for confirmation.

EURAUD Set To Fall! SELL!
My dear followers,
I analysed this chart on EURAUD and concluded the following:
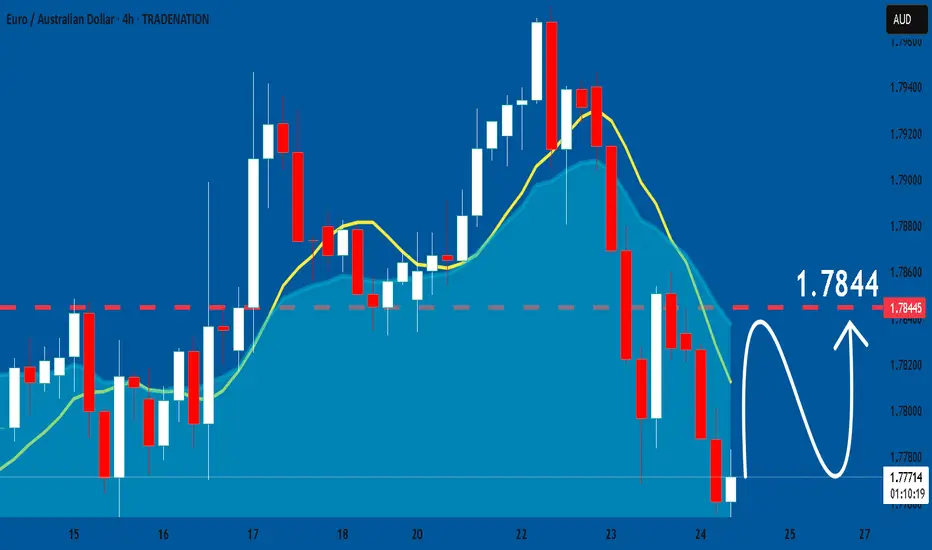
The market is trading on 1.7917 pivot level.
Bias - Bearish
Technical Indicators: Both Super Trend & Pivot HL indicate a highly probable Bearish continuation.
Target - 1.7840
Safe Stop Loss - 1.7966
About Used Indicators:
A super-trend indicator is plotted on either above or below the closing price to signal a buy or sell. The indicator changes color, based on whether or not you should be buying. If the super-trend indicator moves below the closing price, the indicator turns green, and it signals an entry point or points to buy.
Disclosure: I am part of Trade Nation's Influencer program and receive a monthly fee for using their TradingView charts in my analysis.
———————————
WISH YOU ALL LUCK
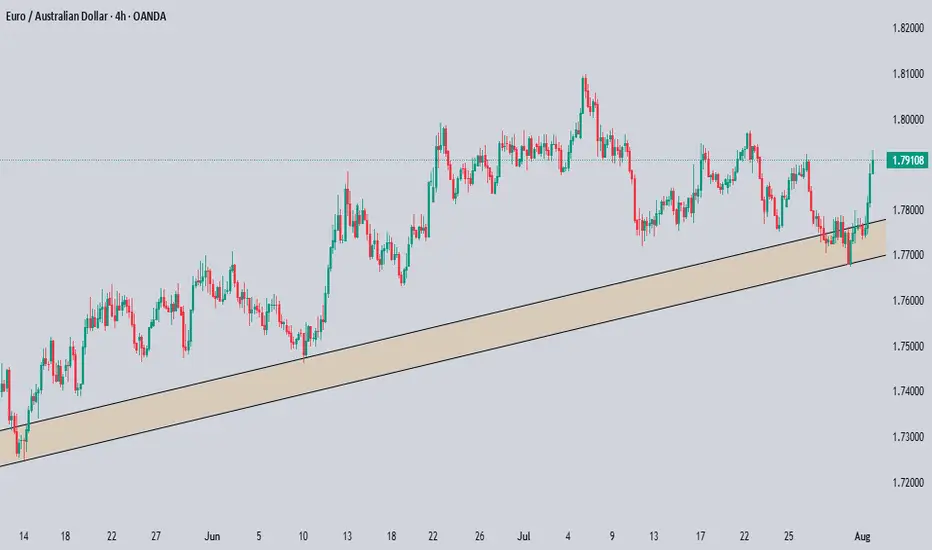
EURAUD ForecastOANDA:EURAUD is poised to confirm a bearish Head & Shoulders pattern.
The price could move higher today on hopes that the ECB can share some positive news on the economy and interest rates.
The European Central Bank is expected to keep interest rates unchanged, ending a seven-year streak of cuts.
If the price manages to break below the neckline of the pattern, it will open the door for further declines.

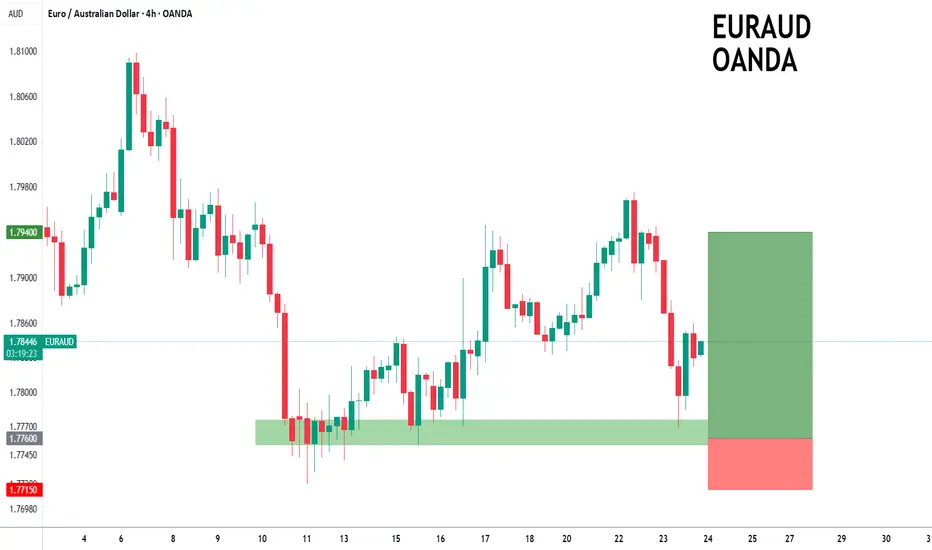
EURAUD to find buyers at previous support?EURAUD - 24h expiry
The primary trend remains bullish.
We are trading at oversold extremes.
Preferred trade is to buy on dips.
Risk/Reward would be poor to call a buy from current levels.
Bespoke support is located at 1.7760.
We look to Buy at 1.7760 (stop at 1.7715)
Our profit targets will be 1.7940 and 1.7960
Resistance: 1.7840 / 1.7900 / 1.7950
Support: 1.7750 / 1.7720 / 1.7700
Risk Disclaimer
The trade ideas beyond this page are for informational purposes only and do not constitute investment advice or a solicitation to trade. This information is provided by Signal Centre, a third-party unaffiliated with OANDA, and is intended for general circulation only. OANDA does not guarantee the accuracy of this information and assumes no responsibilities for the information provided by the third party. The information does not take into account the specific investment objectives, financial situation, or particular needs of any particular person. You should take into account your specific investment objectives, financial situation, and particular needs before making a commitment to trade, including seeking, under a separate engagement, as you deem fit.
You accept that you assume all risks in independently viewing the contents and selecting a chosen strategy.
Where the research is distributed in Singapore to a person who is not an Accredited Investor, Expert Investor or an Institutional Investor, Oanda Asia Pacific Pte Ltd (“OAP“) accepts legal responsibility for the contents of the report to such persons only to the extent required by law. Singapore customers should contact OAP at 6579 8289 for matters arising from, or in connection with, the information/research distributed.
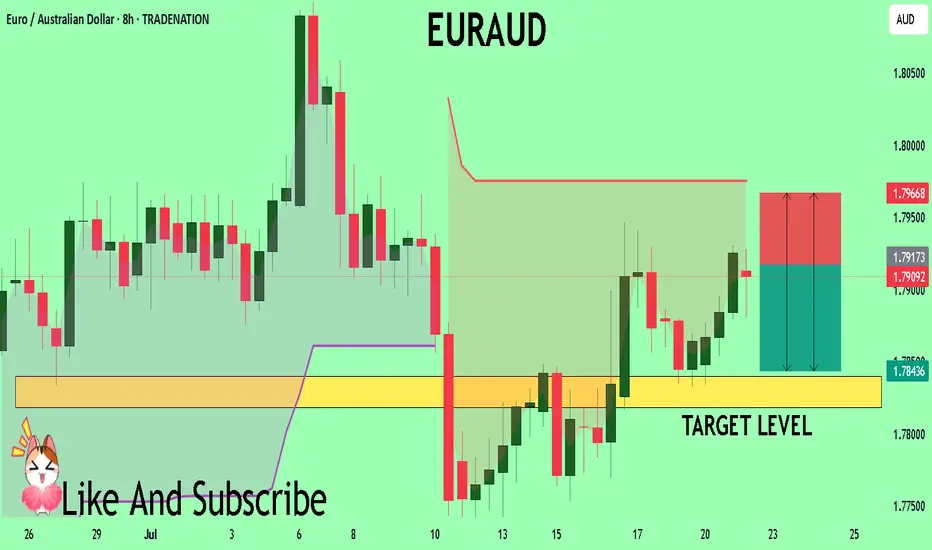
EURAUD: Bullish Forecast & Outlook
Our strategy, polished by years of trial and error has helped us identify what seems to be a great trading opportunity and we are here to share it with you as the time is ripe for us to buy EURAUD.
Disclosure: I am part of Trade Nation's Influencer program and receive a monthly fee for using their TradingView charts in my analysis.
❤️ Please, support our work with like & comment! ❤️
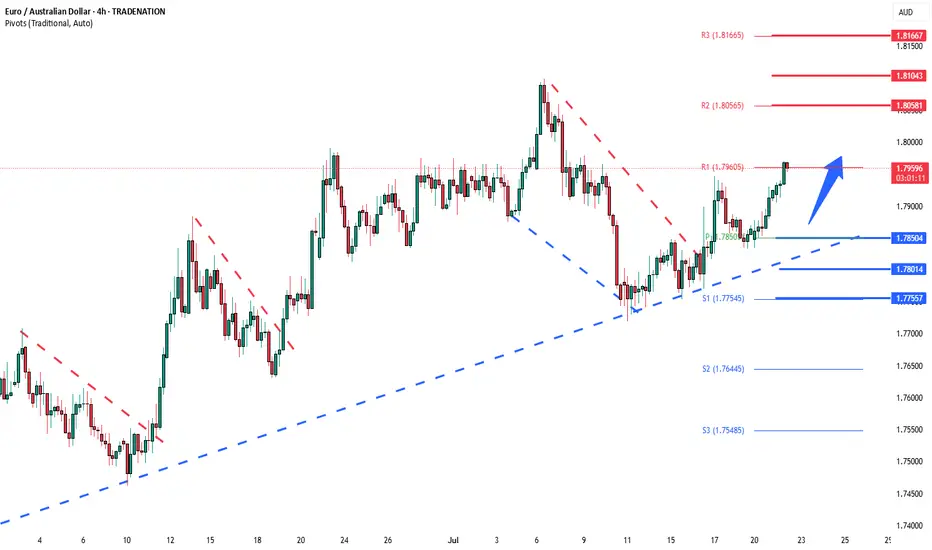
EURAUD Bullish breakout supported at 1.7650The EURAUD remains in a bullish trend, with recent price action indicating a continuation breakout within the broader uptrend.
Support Zone: 1.7850 – a key level from previous consolidation. Price is currently testing or approaching this level.
A bullish rebound from 1.7850 would confirm ongoing upside momentum, with potential targets at:
1.8060 – initial resistance
1.8100 – psychological and structural level
1.8165 – extended resistance on the longer-term chart
Bearish Scenario:
A confirmed break and daily close below 1.7850 would weaken the bullish outlook and suggest deeper downside risk toward:
1.7800 – minor support
1.7755 – stronger support and potential demand zone
Outlook:
Bullish bias remains intact while the EURAUD holds above 1.7850. A sustained break below this level could shift momentum to the downside in the short term.
This communication is for informational purposes only and should not be viewed as any form of recommendation as to a particular course of action or as investment advice. It is not intended as an offer or solicitation for the purchase or sale of any financial instrument or as an official confirmation of any transaction. Opinions, estimates and assumptions expressed herein are made as of the date of this communication and are subject to change without notice. This communication has been prepared based upon information, including market prices, data and other information, believed to be reliable; however, Trade Nation does not warrant its completeness or accuracy. All market prices and market data contained in or attached to this communication are indicative and subject to change without notice.
EURAUD Short IdeaPrice is currently correcting and may possibly make a bearish move. Still, needs a confirmatory entry at lower time frame as this is a daily time frame set-up.
EURUAD is in the Buy directionHello Traders
In This Chart EUR/AUD 4 HOURLY Forex Forecast By FOREX PLANET
today EUR/AUD analysis 👆
🟢This Chart includes_ (EUR/AUD market update)
🟢What is The Next Opportunity on EUR/AUD Market
🟢how to Enter to the Valid Entry With Assurance Profit
This CHART is For Trader's that Want to Improve Their Technical Analysis Skills and Their Trading By Understanding How To Analyze The Market Using Multiple Timeframes and Understanding The Bigger Picture on the Charts
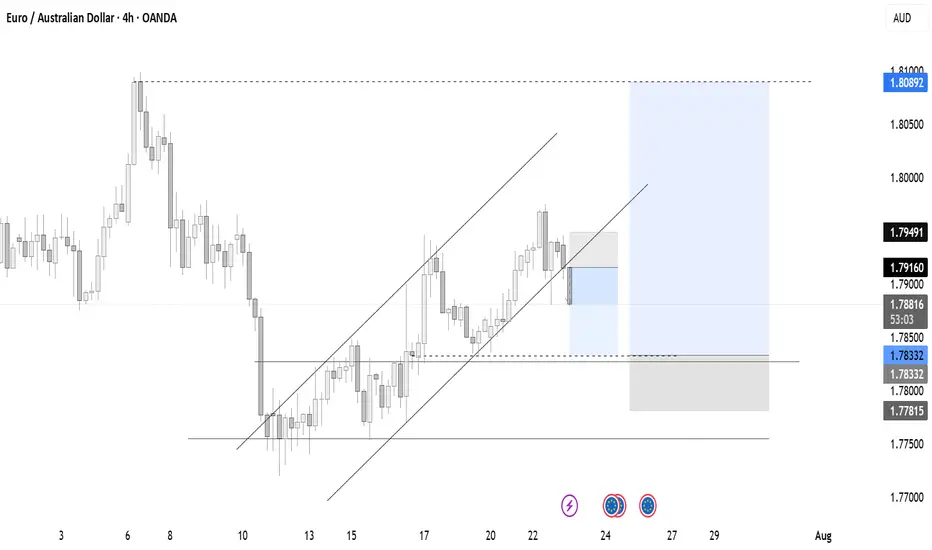
EURAUD – Planning Ahead, Not PredictingAs usual, I have marked my level.
🎯 I’m waiting for the price to reach it and if a valid sell signal appears, I will enter a short position.
If the level is broken cleanly,
I’ll wait for a pullback and enter a buy trade.
We are just traders, not predictors.
We have no impact on the market —
we are just a tiny part of a huge system.
🧠 So I never say: “Price will come here, then must fall.”
That’s not my mindset.
My belief is simple:
Manage risk, be prepared for everything.
One trade won’t make me rich,
and I won’t let one trade destroy me.
📌 Stop-loss is the first and last rule.
Trading without a stop-loss is just gambling.
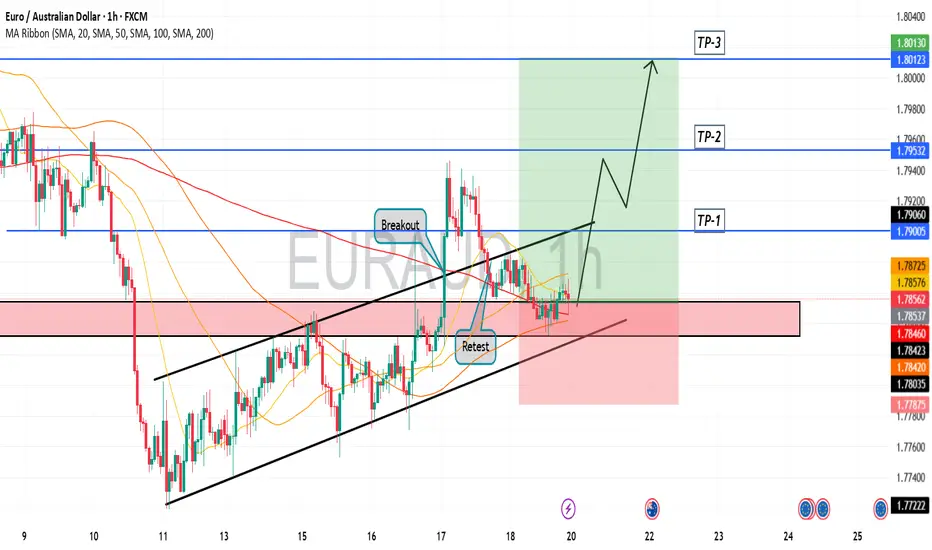
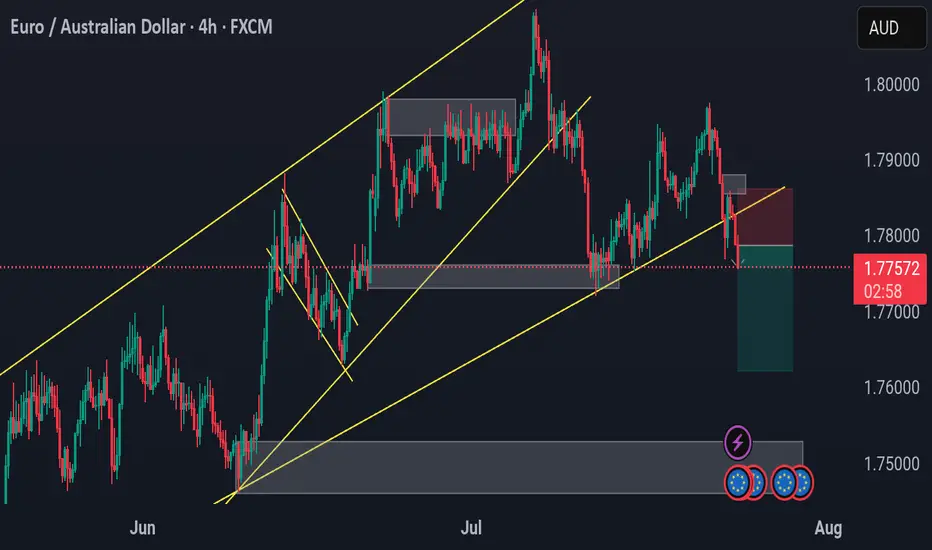
EURAUD SELL EURAUD SELL
🕒 4H Chart | FXCM Feed
Price has broken out of the ascending channel and is now rejecting a key supply zone with a clean break and retest. We anticipate continued bearish movement.
🔹 Sell Entry: 1.77675
🔹 Stop Loss: 1.78500 (−82.5 pips)
🔹 Take Profit 1: 1.76500 (+117.5 pips)
🔹 Take Profit 2: 1.75500 (+217.5 pips)
🔹 Take Profit 3: 1.74500 (+317.5 pips)
📊 Risk:Reward Ratios:
TP1 ≈ 1.42R
TP2 ≈ 2.63R
TP3 ≈ 3.85R
📎 Confluences:
✔️ Ascending channel break
✔️ Bearish retest of structure
✔️ Supply zone reaction
✔️ Clean downside space into demand zone
🔔 Partial profits at TP1 or SL to BE is advised. Let runners play if price flows cleanly.
📅 Signal Date: July 24, 2025
📢 @PulseTradesFX
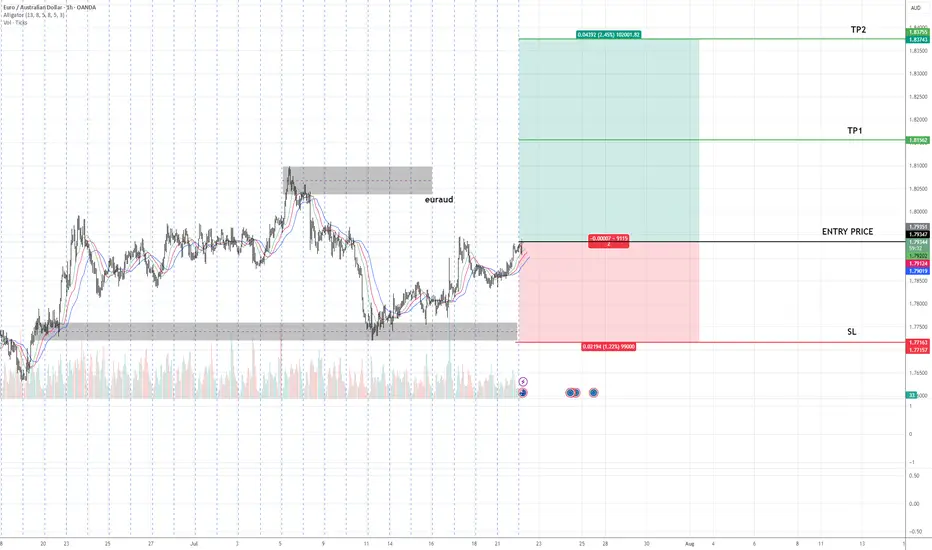
EURAUD Buy Setup – Advanced Analysis Entry: As marked on chart
🎯 TP1: As highlighted on chart
🎯 TP2: As highlighted on chart
🛑 SL: As defined on chart
📊 Technical Insight:
Price has completed a higher low formation, indicating the potential start of a new uptrend phase.
The market has shown an accumulation phase followed by a breakout above minor resistance, suggesting strong demand at current levels.
Volume analysis supports the breakout, with increased participation on bullish pushes and decreasing volume on retracements, confirming healthy trend dynamics.
📍 As long as price holds above the stop loss zone, we expect continuation towards TP1 and TP2 in line with the primary trend.
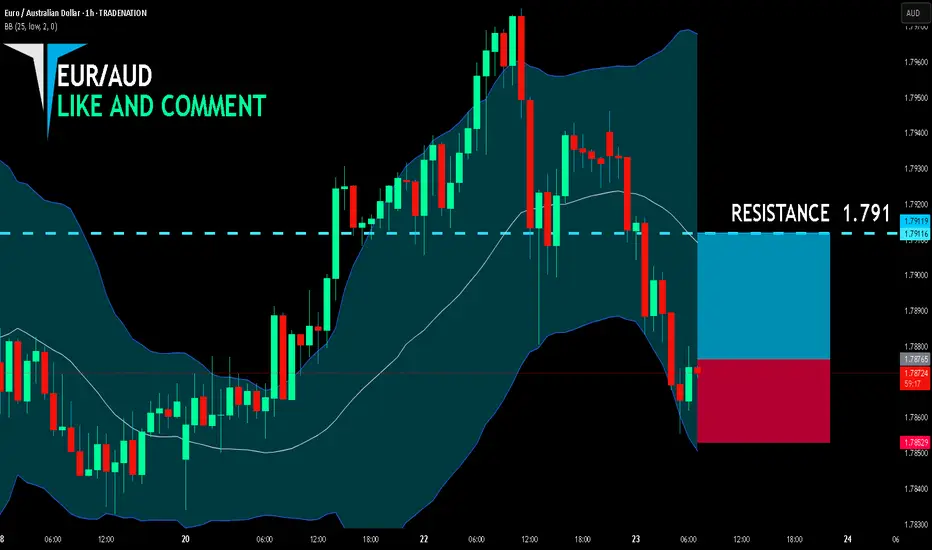
EUR/AUD BUYERS WILL DOMINATE THE MARKET|LONG
EUR/AUD SIGNAL
Trade Direction: long
Entry Level: 1.787
Target Level: 1.791
Stop Loss: 1.785
RISK PROFILE
Risk level: medium
Suggested risk: 1%
Timeframe: 1h
Disclosure: I am part of Trade Nation's Influencer program and receive a monthly fee for using their TradingView charts in my analysis.
✅LIKE AND COMMENT MY IDEAS✅
EURAUD Mixed MoodEUR market is currently super bullish, however a bearish flag hinders further buys. We await the bearish flag to complete before we place buy positions.
Sell EURAUDEURAUD sell scenario considering a bearish flag pattern. Sell towards 1,78333 but stop at 1,78777.

EURAUD 4H cup and handleEURAUD 4H cup and handle formed and possibly breaking out to the upside. Price recently found support off the daily 50ema (overlayed on this 4h chart) and is holding above the daily 10 & 20EMAs (overlayed).
I'm a cat not a financial advisor.

EUR_AUD WILL GROW|LONG|
✅EUR_AUD is trading in an uptrend
With the pair set to retest
The rising support line
From where I think the growth will continue
LONG🚀
✅Like and subscribe to never miss a new idea!✅
Disclosure: I am part of Trade Nation's Influencer program and receive a monthly fee for using their TradingView charts in my analysis.
The 7 Secrets Of Trading MasteryIn this video we are going to talk about:
Buy Limit Orders
Sell Limit Orders
Reversal Patterns
Double Tops
Double Bottoms
Using The Rocket Booster Strategy
The Power Of Risk Management
Watch this video on CAPITALCOM:EURAUD in order for you to learn more
take care and trade safe.
Rocket Boost This Content To Learn More
Disclaimer;Trading is risky please a simulation ion trading account
before you trade with real money
also learn risk management and profit taking strategies.

EURAUD BULLISH MOVE CONTINUESOur analysis is based on a multi-timeframe top-down approach and fundamental analysis.
Based on our assessment, the price is expected to return to the monthly level.
DISCLAIMER: This analysis may change at any time without notice and is solely intended to assist traders in making independent investment decisions. Please note that this is a prediction, and I have no obligation to act on it, nor should you.
Please support our analysis with a boost or comment!
Eur/Audin this pair we can buy save i dont see sell signals , any way be cearful use money management
