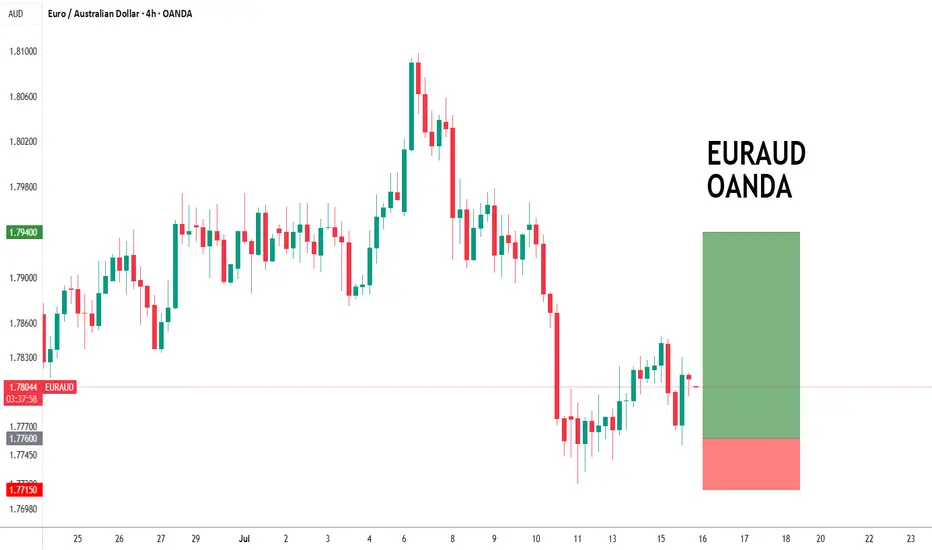
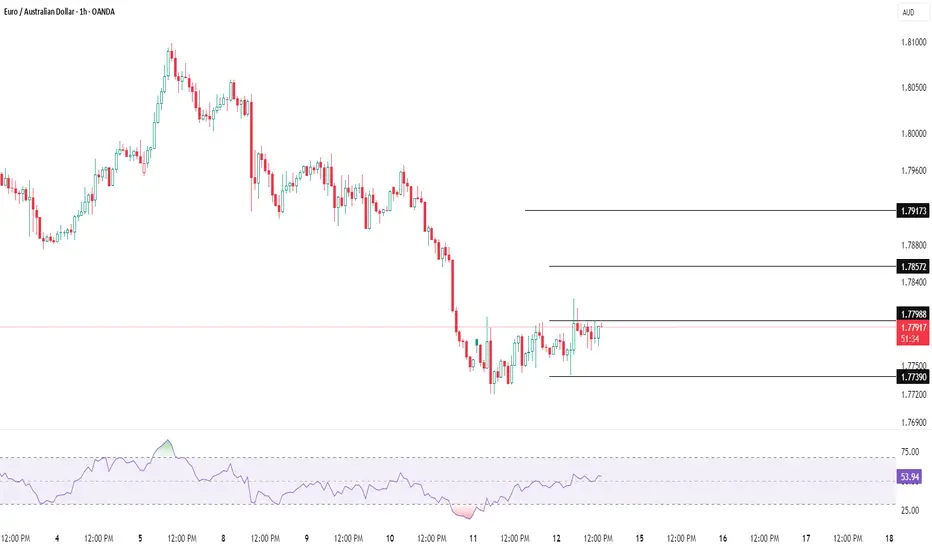
EURAUD forming a bottom?EURAUD - 24h expiry
The primary trend remains bullish.
The selloff has posted an exhaustion count on the daily chart.
Preferred trade is to buy on dips.
Risk/Reward would be poor to call a buy from current levels.
Bespoke support is located at 1.7760.
We look to Buy at 1.7760 (stop at 1.7715)
Our profit targets will be 1.7940 and 1.7970
Resistance: 1.7875 / 1.7950 / 1.8000
Support: 1.7750 / 1.7715 / 1.7670
Risk Disclaimer
The trade ideas beyond this page are for informational purposes only and do not constitute investment advice or a solicitation to trade. This information is provided by Signal Centre, a third-party unaffiliated with OANDA, and is intended for general circulation only. OANDA does not guarantee the accuracy of this information and assumes no responsibilities for the information provided by the third party. The information does not take into account the specific investment objectives, financial situation, or particular needs of any particular person. You should take into account your specific investment objectives, financial situation, and particular needs before making a commitment to trade, including seeking advice from an independent financial adviser regarding the suitability of the investment, under a separate engagement, as you deem fit.
You accept that you assume all risks in independently viewing the contents and selecting a chosen strategy.
Where the research is distributed in Singapore to a person who is not an Accredited Investor, Expert Investor or an Institutional Investor, Oanda Asia Pacific Pte Ltd (“OAP“) accepts legal responsibility for the contents of the report to such persons only to the extent required by law. Singapore customers should contact OAP at 6579 8289 for matters arising from, or in connection with, the information/research distributed.
EURAUD trade ideas
Idea on a charthe June consumer price inflation report shows a 0.3% month-on-month reading for headline inflation (0.287% to three decimal places) and a 0.2% MoM outcome for core (0.228%) versus the consensus forecast of 0.3% for both. The details show that there was some scattered evidence of early tariff impacts on some goods components – mainly fresh fruit & vegetables, household appliance, toys, clothing and sporting goods, but this was offset to a large extent by softness in the all-important shelter component, which has an approximately 40% weighting within the core CPI basket. It rose only 0.2% MoM while new vehicle

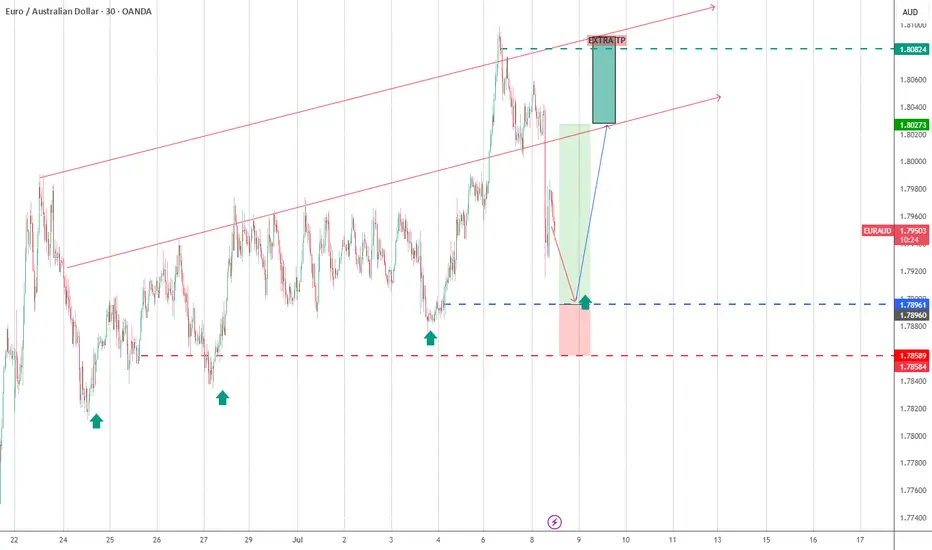
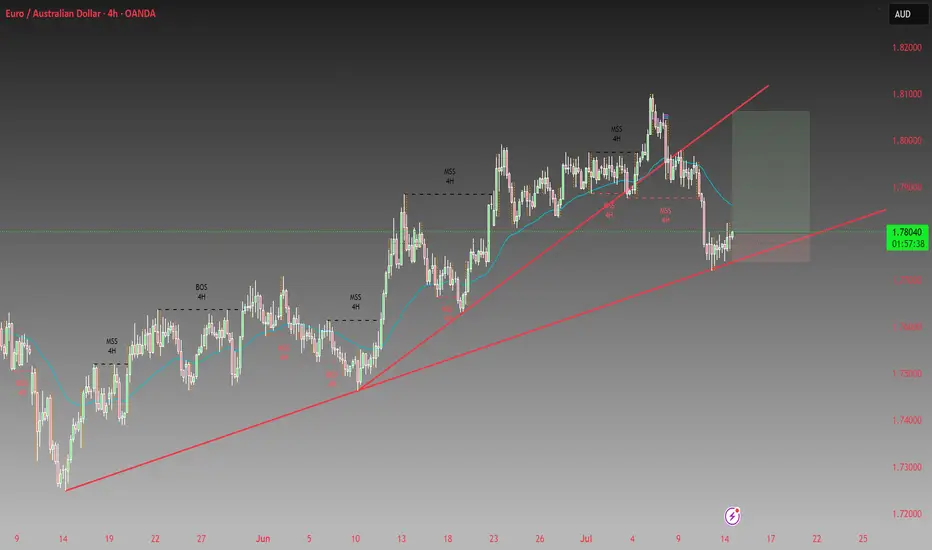
EURAUD, Trend continuationPrice has made a correction and pulled back into the trendline, a continuation of the uptrend is the next.
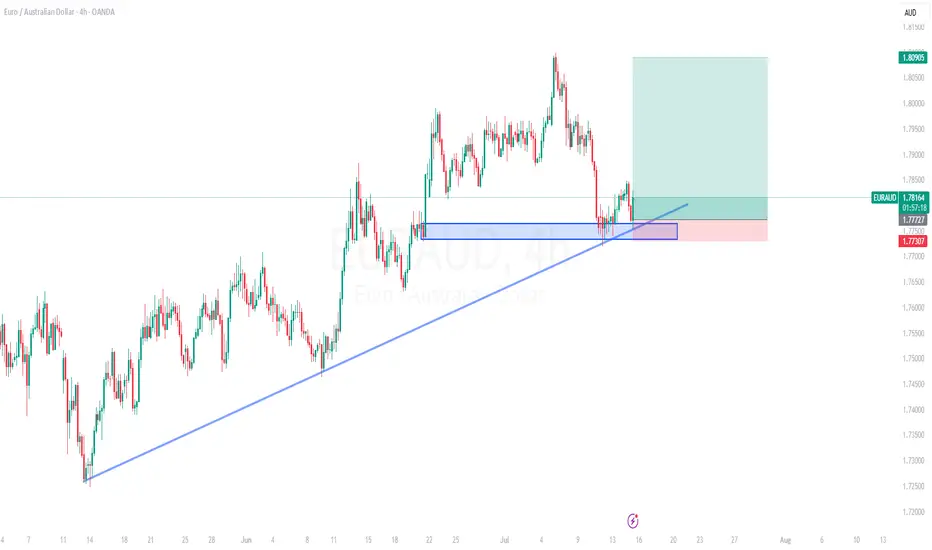
[LONG] EURAUD clear price actionConfluence
Weekly
There is a break in the structure
Daily
Trendline Entry
Demand / Orderblock zone
Target
Last week, Higher high @ 1.80978
Risk 1% Target 3%
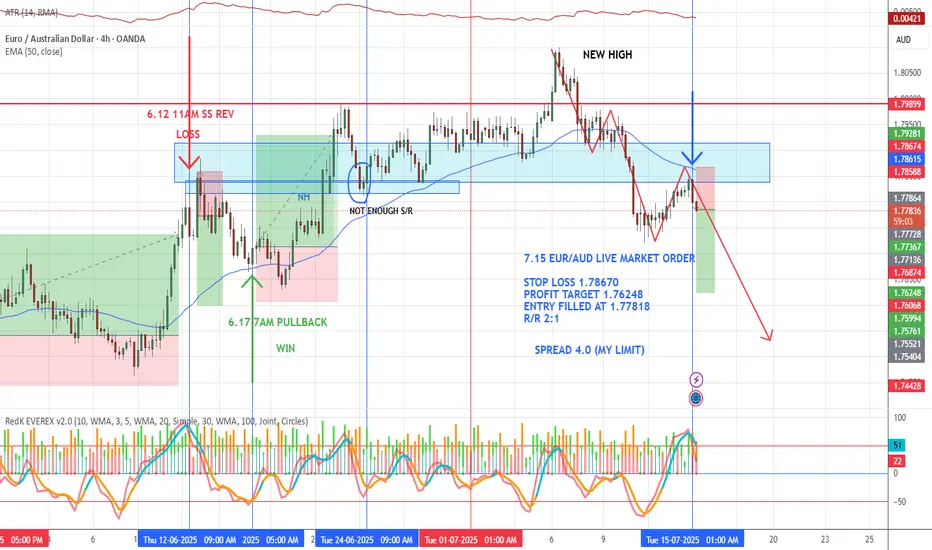
7.15 EUR/AUD LIVE TRADEHere is another Eur market that looks to be heading down. We have a 123 leg down with pullbacks creating swing highs and lows. The 4th leg has made a pullback with a strong engulfing candle rejection at support and resistance. Price action is at the 50 EMA and not above it. Volume is good, not great. Momentum is great. Price will have to take out the recent swing high for us to be wrong but watch out for those equity grabs...I hate that. We use the top/bottom of the recent swing high/low and add/deduct the current ATR to help reduce the stop loss hunters. I would have liked price action to be a bit higher into the S/R but determining S/R level is very subjective...i might see one area and you might see something different. I think it is important to use support and resistance zones, this trade might be a Head and Shoulder pattern? What do you guys think?
EURAUD Bullish support at 1.7720The EURAUD remains in a bullish trend, with recent price action showing signs of a corrective pullback within the broader uptrend.
Support Zone: 1.7720 – a key level from previous consolidation. Price is currently testing or approaching this level.
A bullish rebound from 1.7720 would confirm ongoing upside momentum, with potential targets at:
1.7920 – initial resistance
1.7970 – psychological and structural level
1.8000 – extended resistance on the longer-term chart
Bearish Scenario:
A confirmed break and daily close below 1.7720 would weaken the bullish outlook and suggest deeper downside risk toward:
1.7680 – minor support
1.7630 – stronger support and potential demand zone
Outlook:
Bullish bias remains intact while the EURAUD holds above 1.7720. A sustained break below this level could shift momentum to the downside in the short term.
This communication is for informational purposes only and should not be viewed as any form of recommendation as to a particular course of action or as investment advice. It is not intended as an offer or solicitation for the purchase or sale of any financial instrument or as an official confirmation of any transaction. Opinions, estimates and assumptions expressed herein are made as of the date of this communication and are subject to change without notice. This communication has been prepared based upon information, including market prices, data and other information, believed to be reliable; however, Trade Nation does not warrant its completeness or accuracy. All market prices and market data contained in or attached to this communication are indicative and subject to change without notice.

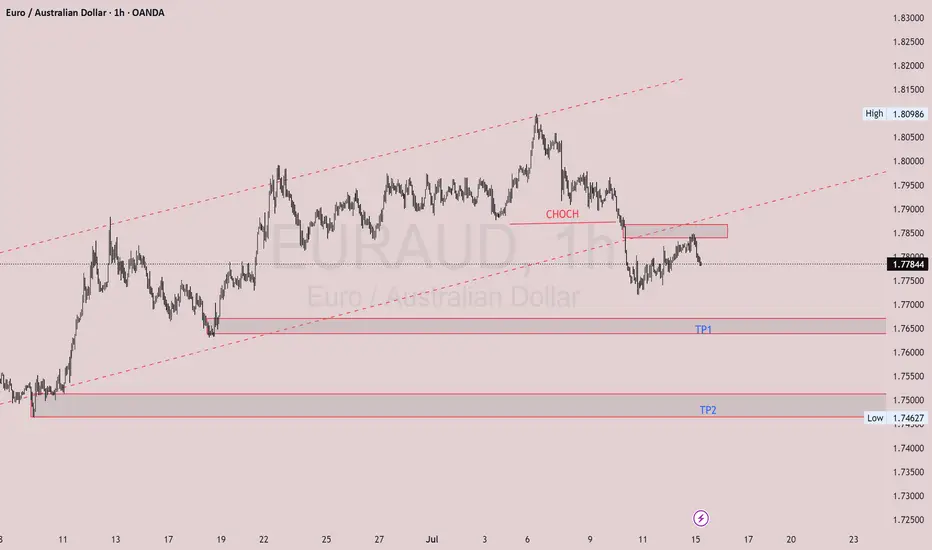
EURUSD Trade SetupEURUSD Trade Setup – Bearish Bias 📉
After a clear CHoCH, price retraced into a Fair Value Gap (FVG), showing signs of rejection. Market structure is shifting, and we anticipate a continuation lower toward the next demand zones.
This is a great example of SMC concepts aligning:
- CHoCH confirms the trend reversal
- FVG provides an entry opportunity
- Bearish momentum is building
Bias: Bearish
Plan: Monitor price action around FVG for confirmation of continuation.
"Let the structure guide your bias. Follow the flow." 🔥📊
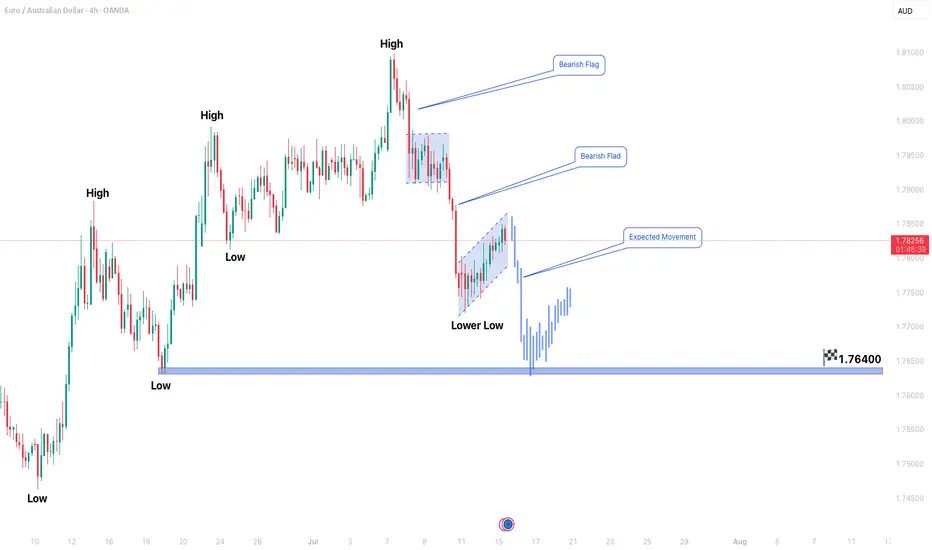
EURAUD FORMING BEARISH FLAG PATTERN IN 4H TIME FRAMEEURAUD Bearish Flag Pattern Suggests Further Downside Ahead
The EURAUD pair is currently exhibiting a bearish flag pattern on the 4-hour chart, indicating a potential continuation of the downtrend. Price action remains confined within a secondary corrective phase, but the primary bearish trend is expected to resume soon. Traders should watch for another bearish flag formation in the upcoming sessions, reinforcing the likelihood of further declines.
Key Observations:
1. Bearish Trend Structure: The pair has been moving in a clear downtrend, with lower highs and lower lows confirming seller dominance.
2. Secondary Trend Phase: The current consolidation represents a temporary pause before the next leg down.
3. Bearish Flag Formation: The flag pattern suggests a continuation signal, with a potential downside target near 1.76400.
Trading Strategy:
- Entry: Consider short positions only after a confirmed breakdown below the flag’s support with strong bearish momentum.
- Target: The measured move projection points toward 1.76400, but partial profits can be taken along the way.
- Stop Loss: A conservative stop should be placed above the recent swing high to limit risk in case of a false breakout.
Risk Management:
- Maintain a disciplined risk-reward ratio (at least 1:2).
- Avoid aggressive entries; wait for clear confirmation (e.g., a strong bearish candle closing below support).
Conclusion:
EURAUD remains bearish, and the formation of another bearish flag reinforces the possibility of further downside. Traders should remain patient for a confirmed breakdown before entering short positions while adhering to strict risk management rules.
EURAUD POSSIBLE SELL OPPORTUNITY!The market just shifted in structure to the bearish side from 15 minutes timeframe! It’s a good time to sell taking in consideration how market failed to continue its’ bullish move. I expect price to drop from the current market price.

EURAUDLet’s focus on the EURAUD forex pair with a more tight and cautious approach compared to other setups. ⚠️📉
If price breaks our stop-loss, I won’t be interested in looking for buy entries at lower levels anymore. It’s important to respect the trade plan and avoid chasing the market. 🚫🔄
The week ended on a bullish note and the momentum has continued upward, but I will only consider entering if I see a proper price correction that offers a better risk-to-reward opportunity. 📈⏳
Patience is key here — waiting for the right pullback to optimize the entry and manage risk effectively will increase the chances of a successful trade. 🎯💡
Remember, disciplined trading always wins in the long run! 💪📊
EURAUD BULLISH DEEP CRAB Looking for a huge bullish move here if price stays above our upwards trendline. If so, it'll be a great start to the week. Happy Trading.
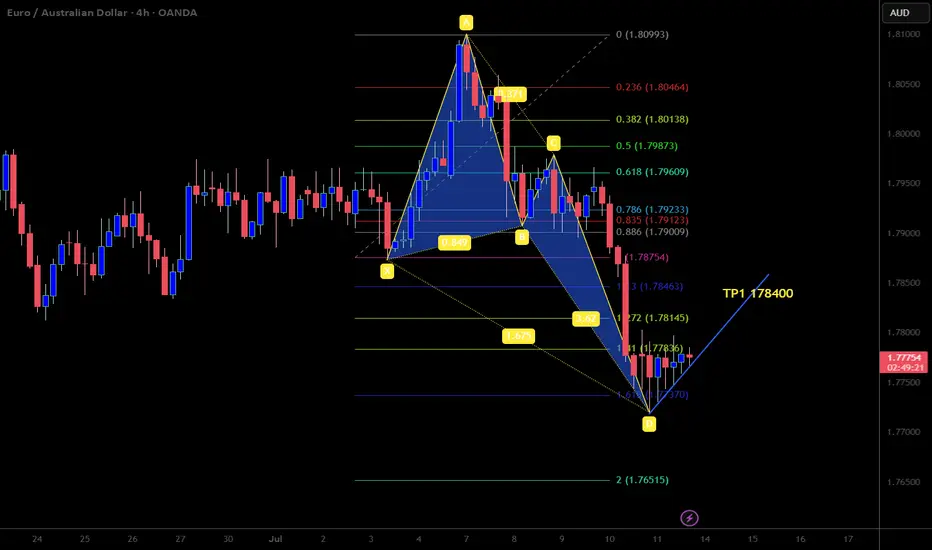
Bullish reversal?EUR/AUD has bounced off the support level which is an overlap support that aligns with the 61.8% Fibonacci retracement and could rise from this level to our take profit.
Entry: 1.77003
Why we like it:
There is an overlap support level that lines up with the 61.8% Fibonacci retracement.
Stop loss: 1.74799
Why we like it:
There is a pullback support.
Take profit: 1.7974
Why we lik e it:
There is a pullback resistance that lines up with the 61.8% Fibonacci retracement.
Enjoying your TradingView experience? Review us!
Please be advised that the information presented on TradingView is provided to Vantage (‘Vantage Global Limited’, ‘we’) by a third-party provider (‘Everest Fortune Group’). Please be reminded that you are solely responsible for the trading decisions on your account. There is a very high degree of risk involved in trading. Any information and/or content is intended entirely for research, educational and informational purposes only and does not constitute investment or consultation advice or investment strategy. The information is not tailored to the investment needs of any specific person and therefore does not involve a consideration of any of the investment objectives, financial situation or needs of any viewer that may receive it. Kindly also note that past performance is not a reliable indicator of future results. Actual results may differ materially from those anticipated in forward-looking or past performance statements. We assume no liability as to the accuracy or completeness of any of the information and/or content provided herein and the Company cannot be held responsible for any omission, mistake nor for any loss or damage including without limitation to any loss of profit which may arise from reliance on any information supplied by Everest Fortune Group.
Sell EURAUDEURAUD presenting an opportunity to load up shorts before Asia Session. A bearish flag is on display, indicating a possible downward move in the next hours. 1,77555 will be the final target.

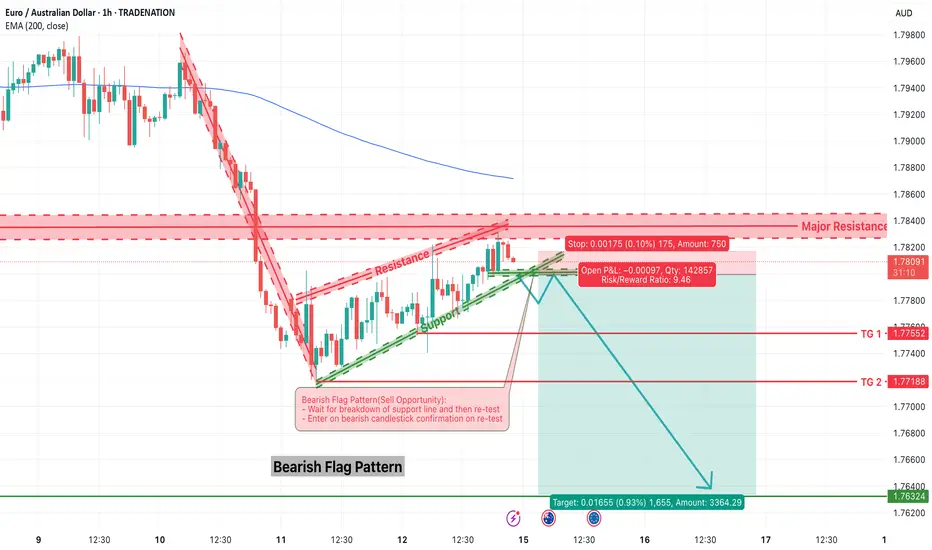
EURAUD – Bearish Flag Breakdown OpportunityThe EURAUD pair is showing signs of trend continuation via a classic bearish flag pattern formation. After a sharp decline, the market has entered into a tight consolidation channel, climbing steadily inside a sloped flag structure. Price is now testing a critical resistance area near 1.7830–1.7840 while hovering just below the 200 EMA.
This setup offers a high-probability sell opportunity — but only after confirmation.
1. Structure Overview
The initial sharp downtrend is followed by a consolidation channel — a textbook bearish flag.
Price is approaching major resistance (1.7830–1.7840) and 200 EMA, acting as a ceiling.
A breakdown from the rising support of the flag is expected to trigger a continuation toward the downside.
2. Trade Plan – Bearish Flag Breakdown
✅ Entry Plan:
Wait for a breakdown of the green support trendline (flag support).
Then, wait for a re-test of the broken support (now resistance).
Enter short only after a bearish candlestick confirmation (e.g., bearish engulfing or rejection wick) on the 15-min or 1-hour chart.
🛡️ Stop Loss:
Place the stop loss just above the major resistance zone, around 1.7835–1.7840.
🎯 Target Zones:
Target 1 (TG1): 1.7755
Target 2 (TG2): 1.7718
Final Target: 1.7632
Risk/Reward Ratio: 1:2, 1:4, 1:9.4+
3. Why This Trade Makes Sense
Bearish Flag is a reliable continuation pattern in strong downtrends.
Price is failing to break above key resistance and 200 EMA.
The flag offers a tight SL and large downside potential — ideal conditions for R:R setups.
Confluence of structure, pattern, and trend all align for short bias.
4. Trade Management Tips
Scale out partial profits at TG1 and TG2, and trail stop for final target.
If breakdown fails, avoid chasing price — re-evaluate bias if price breaks above 1.7840.
5. Final Thoughts
This EURAUD chart is a textbook case of pattern + price action + resistance confluence. The flag structure is well-defined, and the reward-to-risk ratio is significantly favorable if the breakdown confirms.
📌 Watch for:
Breakdown of rising support
Retest and bearish candle
Entry only on confirmation
High-probability setups don’t require prediction — they require preparation.
=================================================================
Disclosure: I am part of Trade Nation's Influencer program and receive a monthly fee for using their TradingView charts in my analysis.
=================================================================
euraud trendline longsSeeing as euraud has well respected the trendlines recently I decided to long eur back into the upper end of previously broken trendline. I am european living in australia, I know first hand how weak aud is agains eur as my salary in australia took a massive hit against euro...
I decided to go all in on this trade with a 2% risk. RR is 1:4 for the final TP, but I do see how trade management is the key for longevity, so I still plan on taking partial profits and moving my stop back to BE as soon as price is hitting 1:1 for BE and 1:2 RR for 50% profit taking.
Let's goo
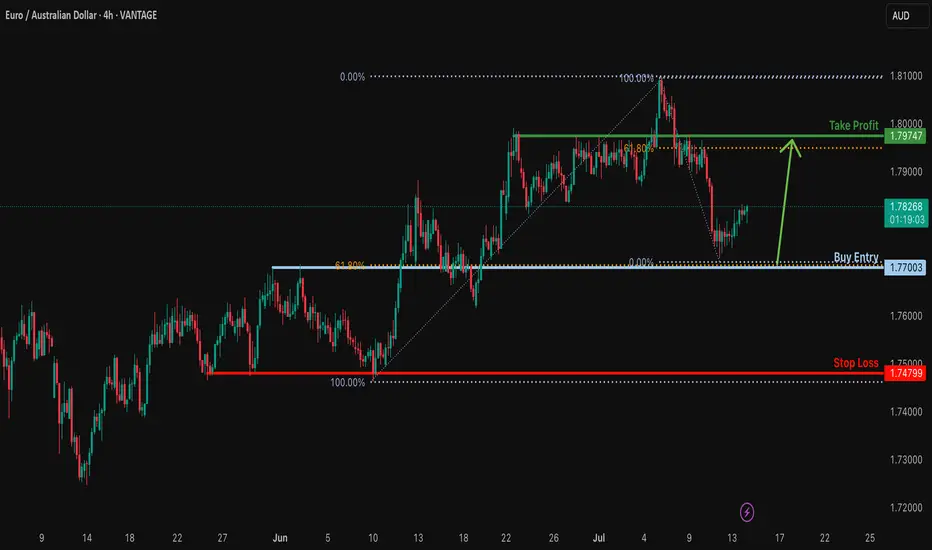
EURAUD Rebound From 1.77200 is High ProbabilityEURAUD has reached a key support zone near 1.77200, aligning with the ongoing bullish global trend. The current price action appears to be a correction phase, particularly influenced by short-term weakness in the Euro.
According to technical chart conditions, this correction is likely nearing completion. If the 1.77200 support holds, it could serve as a strong buy entry point, then upside target will be 1.79000 and 1.80020
You can see more details in the chart.
if you like this idea if you have on Opinion about this analysis share in comments

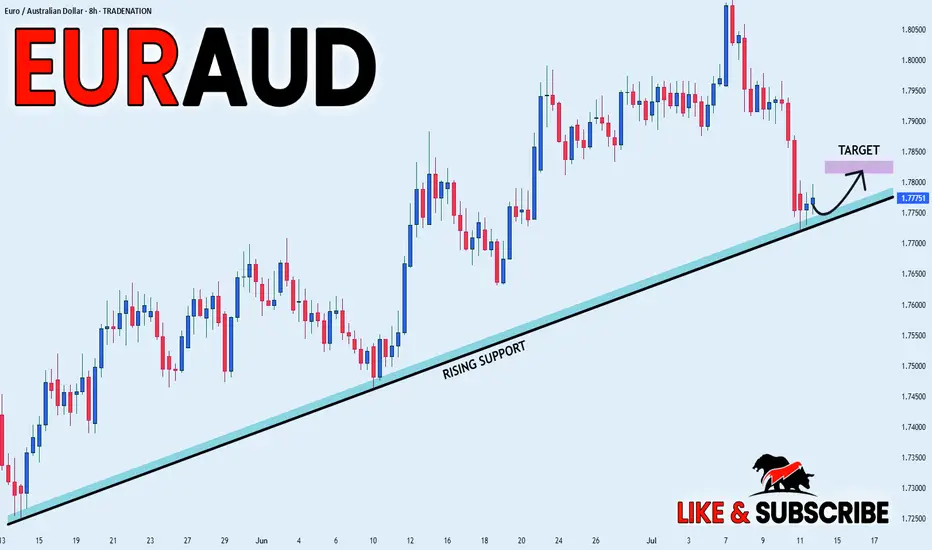
EUR/AUD BULLISH BIAS RIGHT NOW| LONG
EUR/AUD SIGNAL
Trade Direction: long
Entry Level: 1.778
Target Level: 1.804
Stop Loss: 1.760
RISK PROFILE
Risk level: medium
Suggested risk: 1%
Timeframe: 8h
Disclosure: I am part of Trade Nation's Influencer program and receive a monthly fee for using their TradingView charts in my analysis.
✅LIKE AND COMMENT MY IDEAS✅

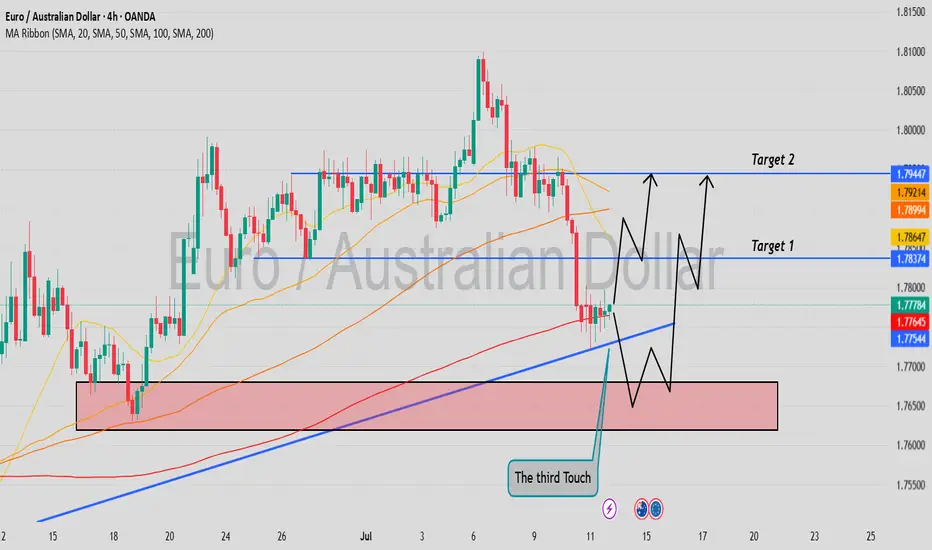
EURUAD is in the Buy direction from the Third TouchHello Traders
In This Chart EUR/AUD 4 HOURLY Forex Forecast By FOREX PLANET
today EUR/AUD analysis 👆
🟢This Chart includes_ (EUR/AUD market update)
🟢What is The Next Opportunity on EUR/AUD Market
🟢how to Enter to the Valid Entry With Assurance Profit
This CHART is For Trader's that Want to Improve Their Technical Analysis Skills and Their Trading By Understanding How To Analyze The Market Using Multiple Timeframes and Understanding The Bigger Picture on the Charts
EUR_AUD WILL GO UP|LONG|
✅EUR_AUD is trading in an uptrend
And the bullish bias is confirmed
By the rebound we are seeing
After the pair retested the support
So I think the growth will continue
LONG🚀
✅Like and subscribe to never miss a new idea!✅
Disclosure: I am part of Trade Nation's Influencer program and receive a monthly fee for using their TradingView charts in my analysis.
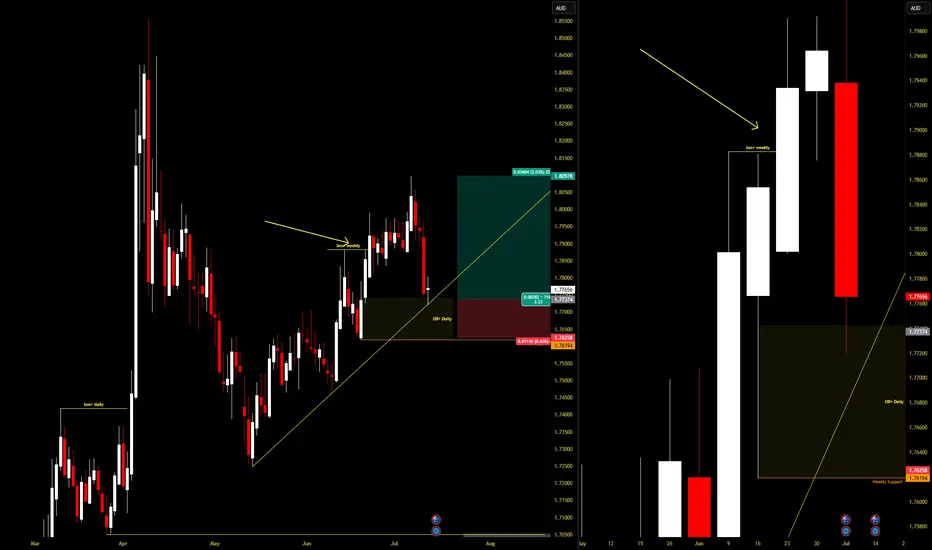
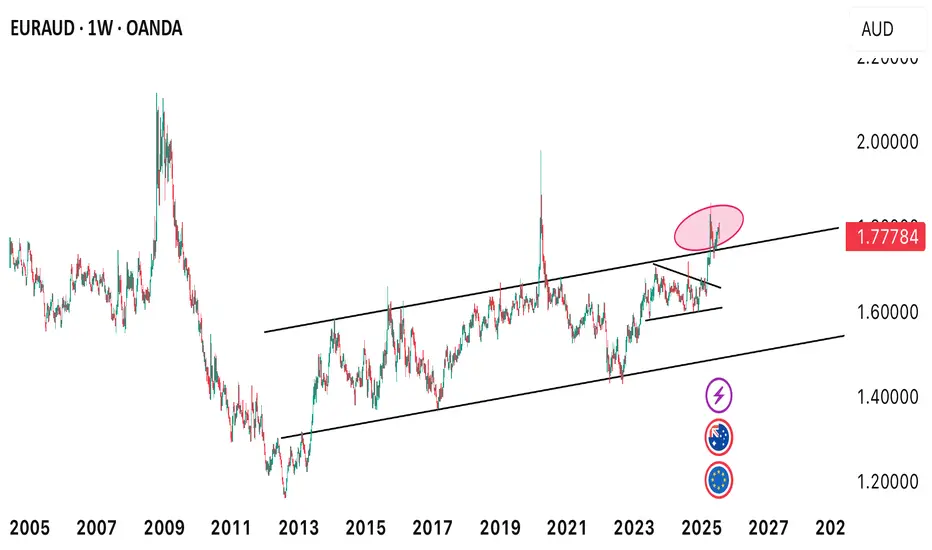
EURAUD MARKET OVERVIEW - WEEKLY CHART Price’s direction from the weekly perspective looks quite bullish. Technically, we saw how price broke out of the symmetrical triangle pattern and also above the upper resistance of the channel. Therefore, we’re likely to see more bullish growth developments as the upper resistance is currently being retested.
EUR/AUD Daily AnalysisWith price in a bullish trend and printing a Doji candle at the trendline, we may now see buyers step back into the market once again.
If you agree with this analysis, look for a trade setup that meets your strategy rules.

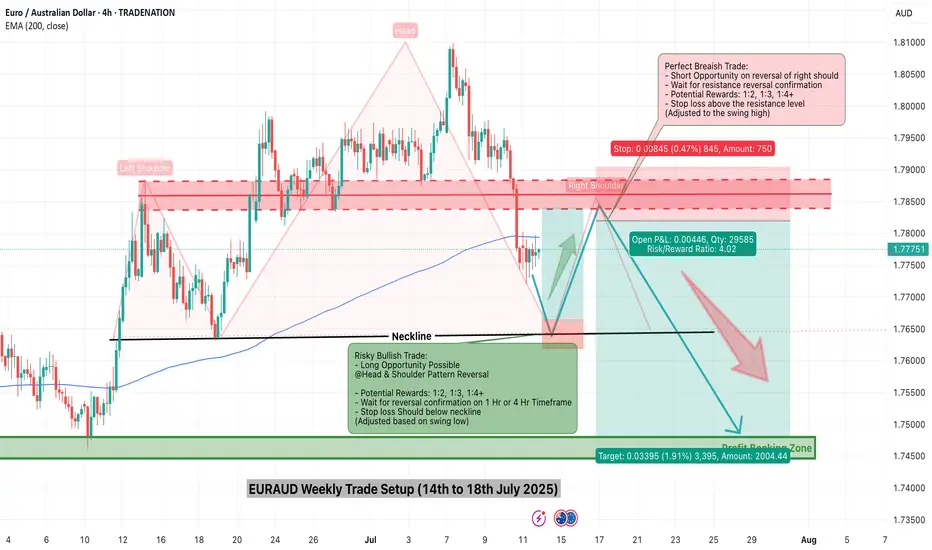
EURAUD Weekly Trade Setup(14 to 18th July 2025) - Head&ShoulderThis week, EURAUD (Euro/Australian Dollar) has entered a critical price zone, providing a textbook technical opportunity for traders. A clear Head & Shoulders pattern has formed on the 4-hour chart, pointing toward a potential trend reversal from bullish to bearish.
Let’s explore how to trade this intelligently from both bullish and bearish perspectives.
1. Bearish Setup – Head & Shoulders Pattern Breakdown
This is the primary trade idea for the week.
✅ Trade Logic:
Price has completed a classic Left Shoulder → Head → Right Shoulder formation.
The neckline (support) will be tested.
The current price is will pulling back to retest the right shoulder resistance zone, offering an ideal short opportunity.
🔻 Entry Plan:
Wait for bearish reversal confirmation (candlestick rejection or bearish engulfing) on the 1H or 4H timeframe.
Enter short once confirmation appears near 1.7850–1.7900.
📉 Stop Loss:
Place SL above the right shoulder high, adjusting for volatility and swing high (around 1.7950).
🎯 Targets:
Target zone: 1.7450–1.7500 (profit booking zone marked on the chart)
Potential Risk/Reward Ratio: 1:2, 1:3, or even 1:4+
2. Alternative Bullish Setup – Reversal at Neckline (High Risk)
This setup is for experienced or aggressive traders who spot early reversals.
✅ Trade Logic:
Price may bounce from the neckline and 200 EMA support area.
If this happens, a temporary bullish reversal may push price back toward the right shoulder zone.
🔺 Entry Plan:
Wait for bullish confirmation (reversal candle) near the neckline and EMA support (around 1.7700).
🚨 Stop Loss:
SL must be below the neckline swing low (around 1.7650).
🎯 Targets:
Resistance zone (right shoulder): 1.7850–1.7900
R:R setups of 1:2 or 1:3 possible
⚠️ This is considered a counter-trend trade and should be traded with caution.
3. Technical Confluence and Indicators
Pattern: Head & Shoulders (bearish reversal)
EMA 200: Price reacting around the long-term trend line
Support/Resistance: Cleanly defined horizontal zones
Reversal zones: Highlighted in red (supply) and green (demand)
4. Final Thoughts
This week’s EURAUD setup is a strong example of structure-based trading. With a well-formed head and shoulders pattern and a clean neckline break, the market signals a shift in momentum.
Safe Approach: Trade the short side after resistance rejection.
Risky Approach: Try a long on neckline bounce with tight SL.
Always confirm with your system and maintain strict risk management. Trade what you see, not what you feel.
Ready to trade? Save this setup, monitor price action, and execute only with confirmation.
=================================================================
Disclosure: I am part of Trade Nation's Influencer program and receive a monthly fee for using their TradingView charts in my analysis.
=================================================================