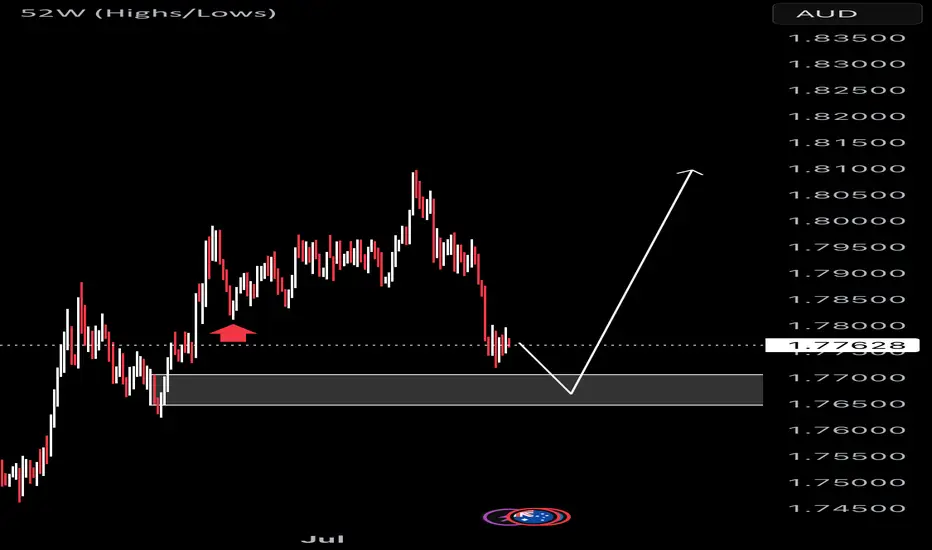
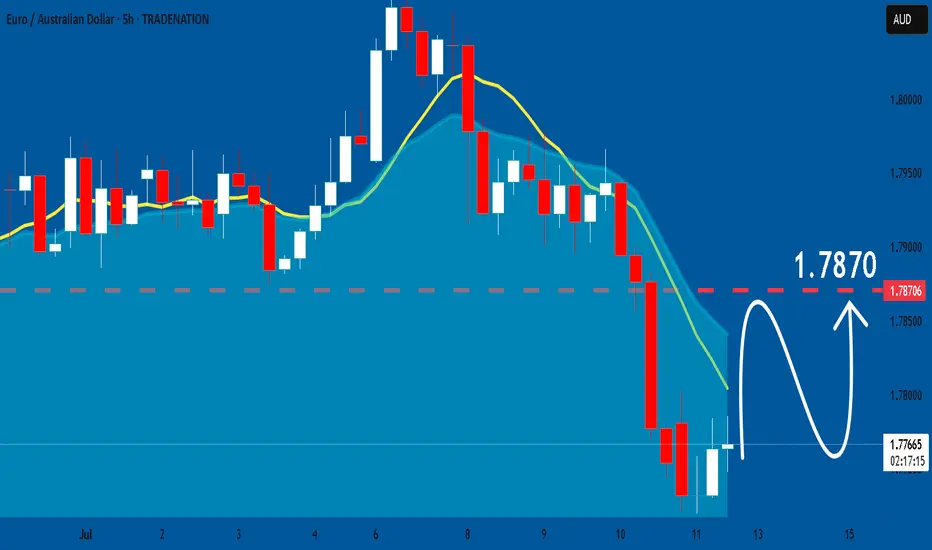
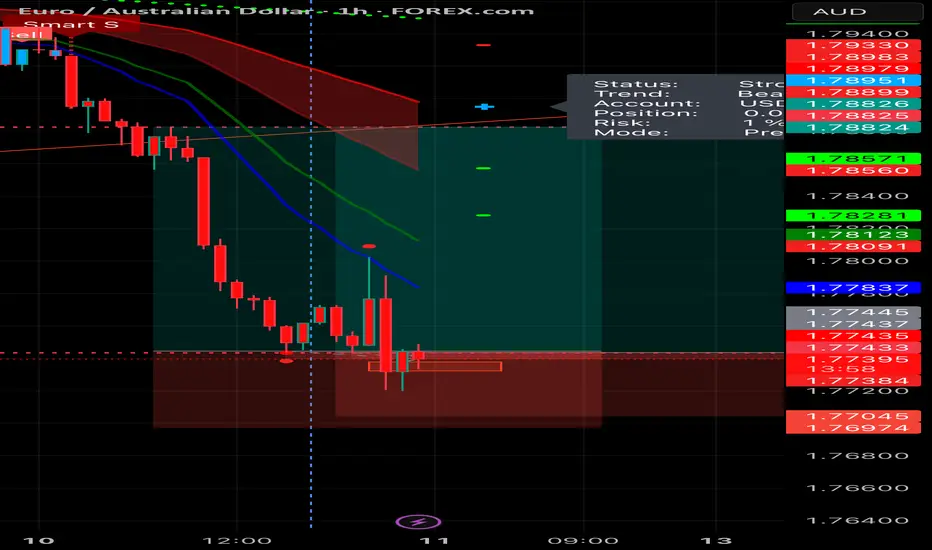
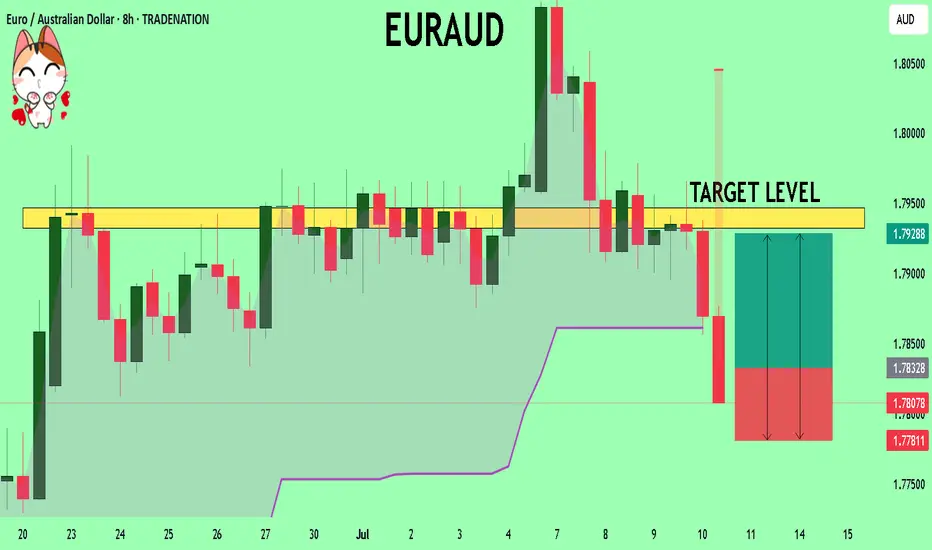
EUR-AUD Bullish Bias! Buy!
Hello,Traders!
EUR-AUD went down but
A strong horizontal support
Level is below around 1.7690
And as the pair is trading in
An uptrend we will be expecting
A round and a move up
On Monday!
Buy!
Comment and subscribe to help us grow!
Check out other forecasts below too!
Disclosure: I am part of Trade Nation's Influencer program and receive a monthly fee for using their TradingView charts in my analysis.
EURAUD trade ideas

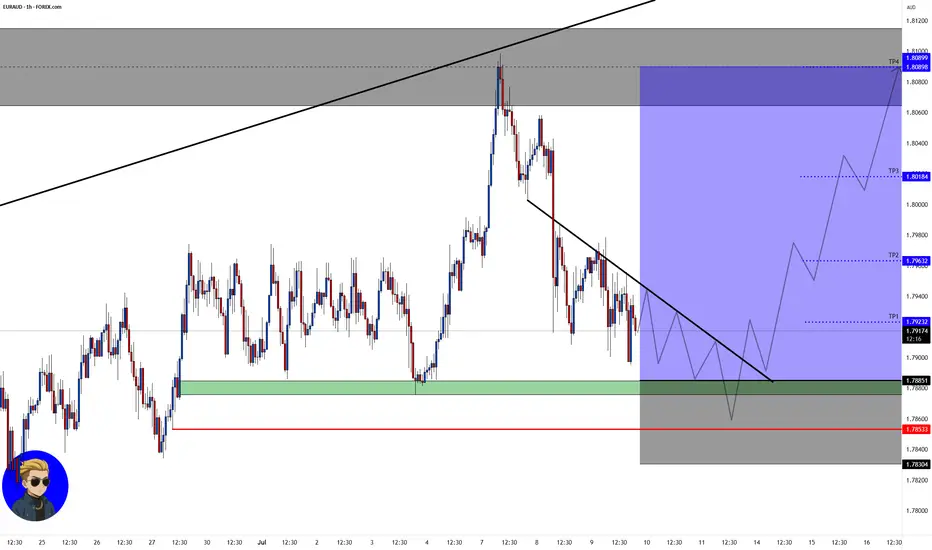
EUR/AUD💰Symbol: { EUR/AUD }
🟩Price: { 1.78851 }
🟥Stop: { 1.78304 }
1️⃣profit: { 1.79232 }
2️⃣profit: { 1.79632 }
3️⃣profit: { 1.80184 }
4️⃣profit: { 1.80898 }
📊Check your chart before entering.
🚨Check before use to make sure there is no important news.🚨
EURAUD Breakdown Incoming? Price + COT + Seasonality🧠 MACRO & INSTITUTIONAL FLOWS (COT)
EURO (EUR)
Strong increase in net long positions by non-commercials: +16,146
Commercials also added long exposure: +25,799
Bias: moderately bullish
AUSTRALIAN DOLLAR (AUD)
Non-commercials remain heavily net short (long/short ratio: 15% vs 63.6%)
Slight increase in commercial longs: +2,629
Bias: still bearish, but showing early signs of positioning exhaustion
COT Conclusion: EUR remains strong, AUD remains weak — but the recent extension calls for caution on fresh EURAUD longs.
📊 SEASONALITY (JULY)
EUR shows historically positive July performance across 2Y, 5Y, and 10Y averages
AUD also shows mild strength, but less consistent
🔎 Net differential: No strong seasonal edge on EURAUD in July
📈 RETAIL SENTIMENT
54% of retail traders are short EURAUD, 46% long
Slight contrarian bullish bias, but not extreme yet → neutral to slightly long
📉 TECHNICAL STRUCTURE – MULTI-TIMEFRAME
1. Weekly Chart
Strong bearish engulfing candle after 4 weeks of upside
RSI dropped below 50 → clear momentum shift
1.7960–1.8100 is now a liquidity zone that’s been tapped
2. Daily Chart
Confirmed break of the ascending channel formed since May
Price reacted from demand zone around 1.7460–1.7720, signaling potential pullback
Watch for rejection around 1.7910 (50% body of the weekly engulfing candle)
3. Entry Setup
Key area for short entries: 1.7910–1.7940
This zone aligns with:
✅ Former support now turned resistance
✅ Inside a valid bearish order block
✅ Ideal retracement level (50% engulfing body)
🎯 OPERATIONAL CONCLUSION
While the macro context still favors a stronger EUR against AUD, price action tells another story.
The weekly engulfing candle is a strong technical reversal signal, and the daily structure confirms the break.
→ Shorting the pullback into 1.7910–1.7940 could offer an excellent R/R trade setup.
Bias: Short-term bearish – Targeting 1.7700, 1.7550, and potentially 1.7315
Invalidation: Daily close above 1.8040

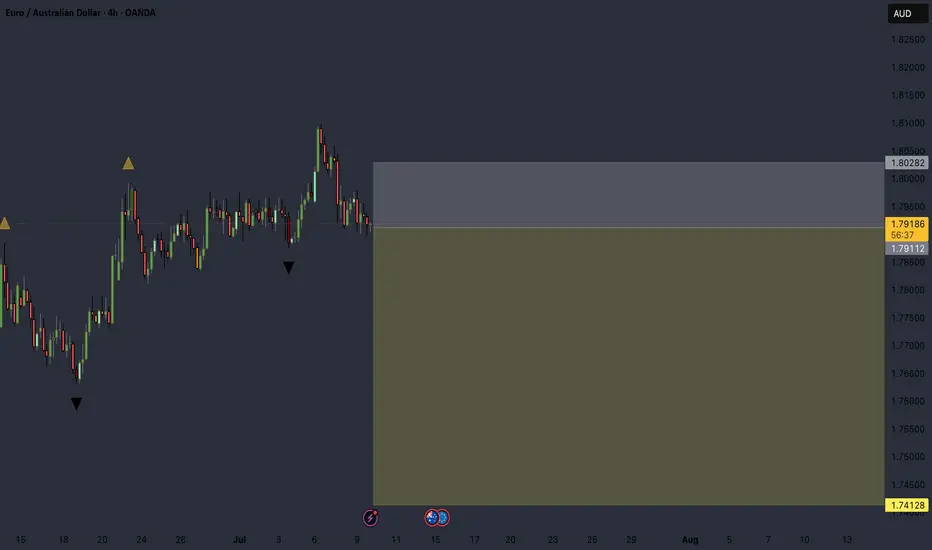
Long IdeaBullish, re-tracement leg possibly complete. Waiting for price to reach zone before initiating buys to the high.
Happy and safe trades.
EURAUD The current head of the European Central Bank (ECB) is Christine Lagarde. She has been serving as ECB President since November 2019, Lagarde has emphasized her commitment to steering the ECB through complex economic challenges, including inflation control and adapting monetary policy to evolving global conditions.
the current key interest rates set by the European Central Bank (ECB) are as follows:
Deposit Facility Rate: 2.00%
Main Refinancing Operations Rate: 2.15%
Marginal Lending Facility Rate: 2.40%
These rates were last adjusted on June 11, 2025, when the ECB lowered the key interest rates by 25 basis points (0.25%) to reflect the updated inflation outlook and economic conditions.
Additional Context:
Inflation in the Eurozone is currently around the ECB’s medium-term target of 2%.
The ECB’s Governing Council decided on the rate cut based on a downward revision of inflation projections for 2025 and 2026, partly due to lower energy prices and a stronger euro.
The next ECB interest rate decision is scheduled for July 24, 2025.
ECB Executive Board member Isabel Schnabel recently indicated that the bar for further rate cuts remains “very high” as the economy is holding up well.
Summary Table of ECB Key Rates (as of June 11, 2025)
Rate Type Interest Rate (%)
Deposit Facility Rate 2.00
Main Refinancing Rate 2.15
Marginal Lending Rate 2.40
the Reserve Bank of Australia (RBA) cash rate remains at 3.85%. This decision was made at the RBA’s July 8, 2025 meeting, where the board chose to hold rates steady despite widespread market expectations of a cut to 3.6%
Key Points:
The RBA has signaled that an easing cycle is likely coming, but it wants to wait for the release of the full quarterly inflation data at the end of July to confirm that inflation is on track to decline sustainably toward the target range (2–3%).
Inflation has moderated, with trimmed mean inflation at 2.4% in May, within the target band.
The board was divided: six members voted to hold rates, while three favored a cut.
Market expectations now price in about an 85% chance of a 25 basis point cut to 3.60% at the next meeting on August 12, 2025.
RBA Governor Michele Bullock emphasized that the bank is reacting to domestic inflation and employment data and is prepared to adjust policy as needed, but is not holding rates high “just in case.”
Summary Table
Date Cash Rate (%) Board Decision Next Meeting Expectation
July 8, 2025 3.85 Hold rates steady Likely 0.25% cut at August 12, 2025
Additional Context
The RBA’s cautious approach reflects the need to confirm inflation trends before easing.
The decision surprised markets that had anticipated an immediate cut due to slowing consumer spending and inflation within the target range.
Governor Bullock acknowledged the challenges for borrowers but noted that housing prices, not just interest rates, affect affordability.
EURAUD TRADE MATHE
EU10Y=2.686%
ECB RATE =2.0%
AU10Y= 4.362%
RBA RATE =3.85%
INTEREST RATE DIFFERENTIAL= EUR-AUD=2.0-3.85=-1.85% EURO BASE CURRENCY AND AUD QUOTE. FAVOUR AUD CARRY TRADE.THE TARRIF HAMMER ,AUDSTRALIA AND CHINA TRADE REMAINS A KEY TOOL FOR AUD STRENGTH.
BOND YIELD DIFFERENTIAL= EURO-AUD =2.686%-4.362%=-1.676 FAVOUR AUD .
BUT EURO ZONE ECONOMIC OUTLOOK WILL OFFSET YIELD AND BOND ADVANTAGE AS CHINA AUSTRALIA COMMODITIES MARKET IS DEPENDING MORE ON CHINA ,SO GLOBAL RESTRICTION ON EXPORT WILL GIVE EURAUD LONG POSITION.
#EURAUD

EURAUD: Expecting Bullish Movement! Here is Why:
It is essential that we apply multitimeframe technical analysis and there is no better example of why that is the case than the current EURAUD chart which, if analyzed properly, clearly points in the upward direction.
Disclosure: I am part of Trade Nation's Influencer program and receive a monthly fee for using their TradingView charts in my analysis.
❤️ Please, support our work with like & comment! ❤️
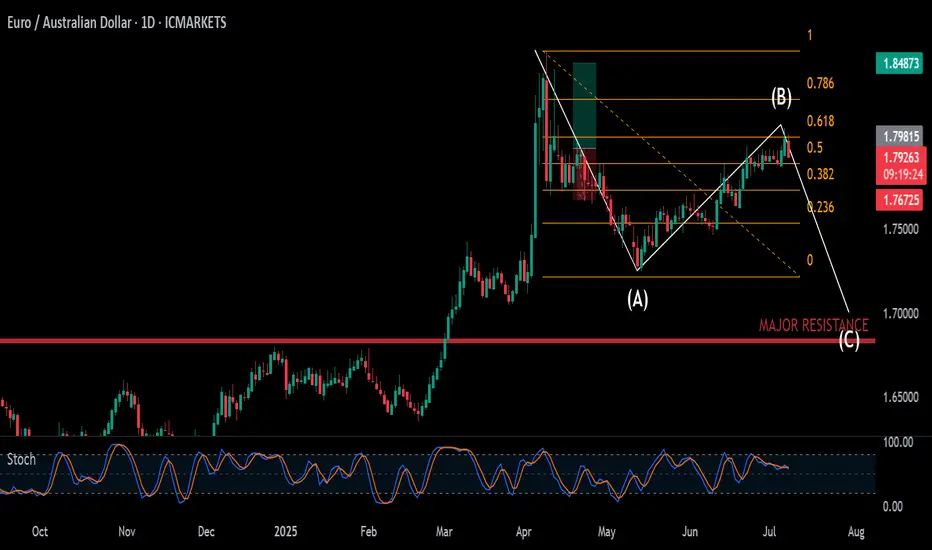
ABC Correction EURAUDSell: 1.79675
Set up: B wave in conjunction with 0.618 Fib retracement
Sl: 1.81566
TP:1.72980
Look at the Daily chart If you look at the daily chart , you can see that it need to go back up to retest the resistance before going back down that’s where my short term buy come in

11.07.25 Morning ForecastPairs on Watch -
FX:EURUSD
FX:EURCAD
FX:EURAUD
A short overview of the instruments I am looking at for today, multi-timeframe analysis down to what I will be looking at for an entry. Enjoy!

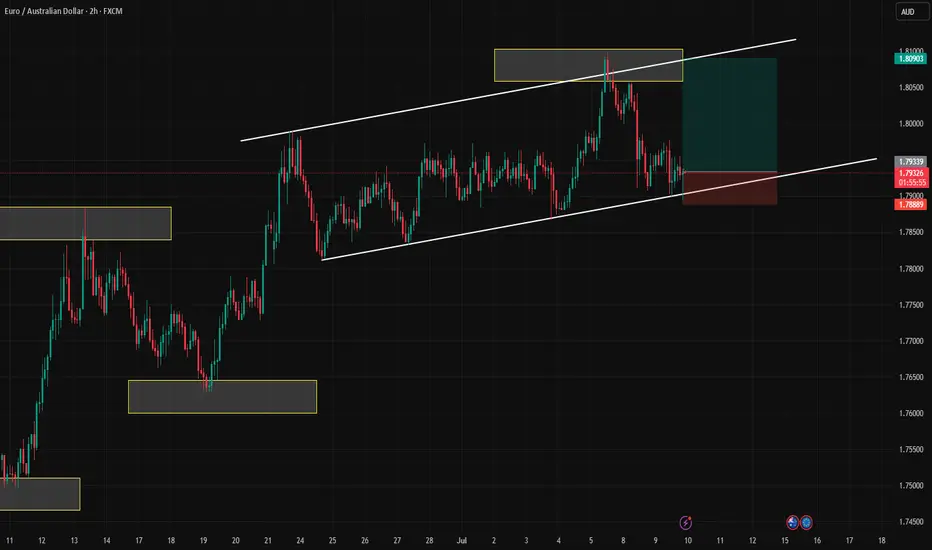
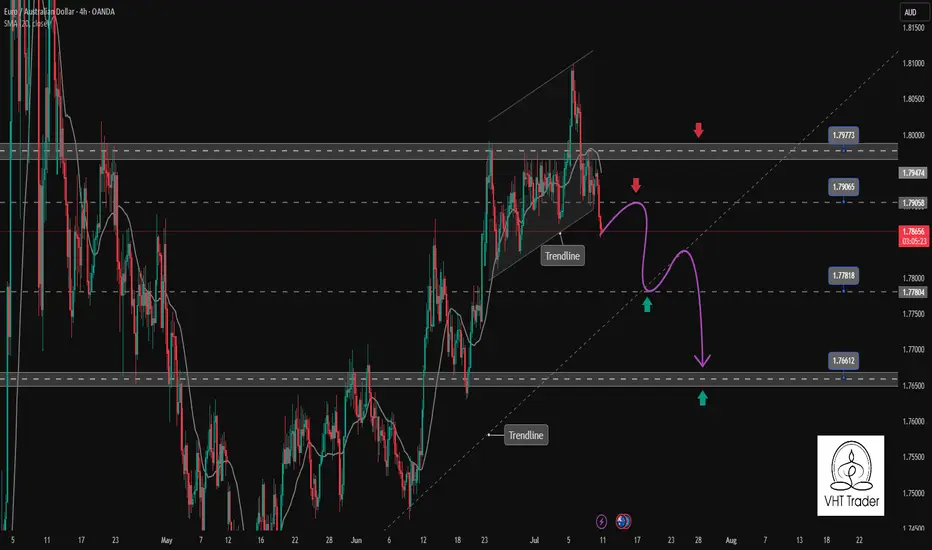
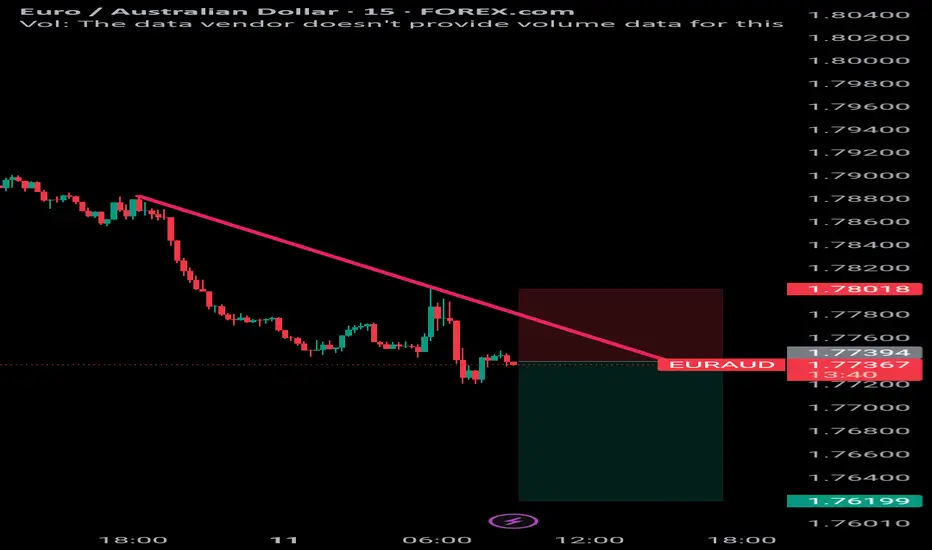
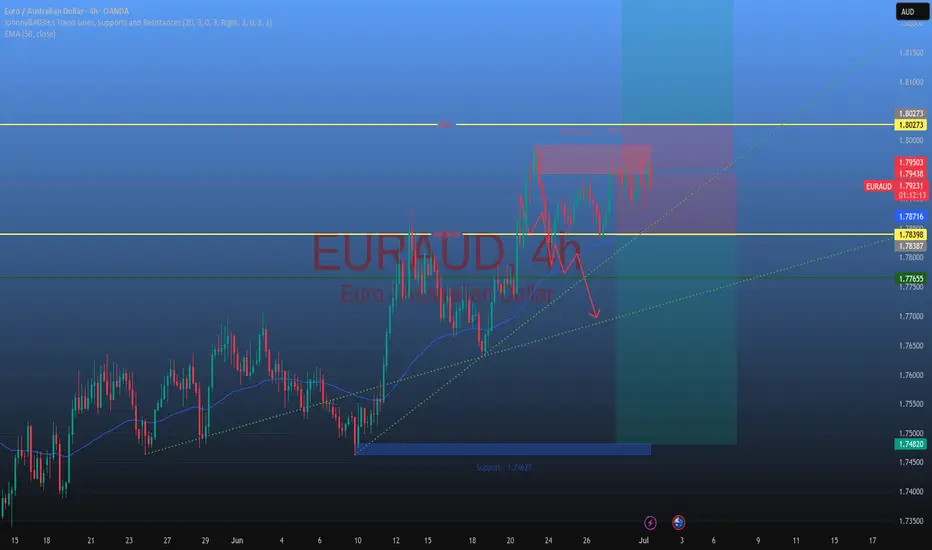
EURAUD confirms the continuation of the bearish correction trendEURAUD has just broken the rising channel to start a downtrend. The confirmation is there with the h4 candle closing completely below the support zone of the Price Channel. This corrective downtrend can now extend to the support of 1.766. The support zone is a Break point at the moment 1.778 is a positive DCA point with a SELL Entry above.
Support: 1.778-1.766
Resistance: 1.790-1.797
Sell now: Resistance zone 1.79000
Target: 1.778 Support zone, followed by 1.766 lower zone
Sell Trigger: Break below 1.778
BUY Trigger: rejection 1.778 Support zone
Leave your comments on the idea. I am happy to read your views.
EURAUD Looks WeakerGood sign of weakness observed on this pair, keeping in view the intact descending TL, we can aim for 1.76200 and keep the protective stop as depicted. As the pair looks more volatile, if moved as expected we can Breakeven it at 1:1. Keep an eye on it.
EURAUD ShortEURAUD is now net short on the regression break. It may be worth considering a trade here.

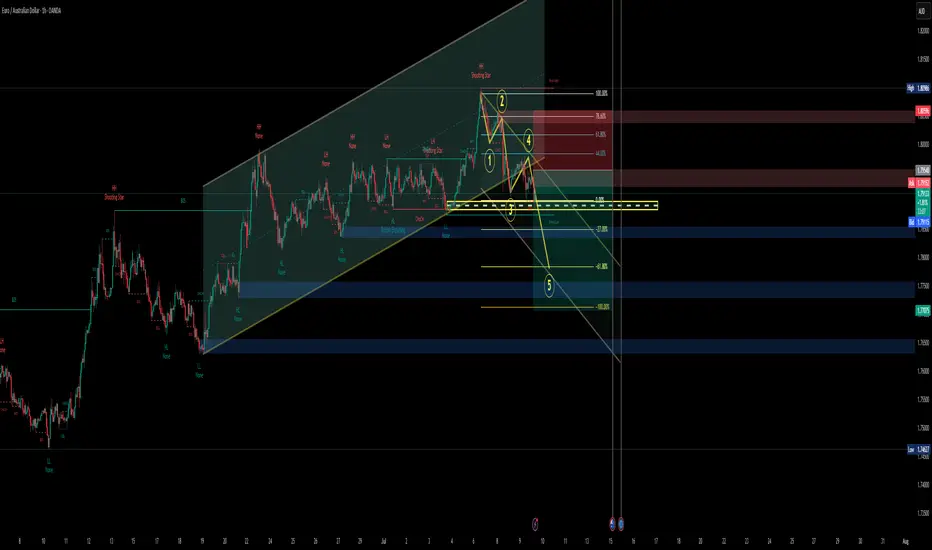
EurAud SellBroken Trendline:
The ascending channel has been clearly broken (highlighted by the yellow trendline break).
This suggests the bullish momentum is exhausted, and we might be entering a bearish phase.
Elliott Wave Pattern (1–5):
You’ve correctly labeled an impulse wave down with five potential legs.
Current price is possibly in Wave 4 retracement, and Wave 5 is expected to move downwards.
Fibonacci Retracement Zone:
Price is retracing into the 61.8%–78.6% zone (typical area for Wave 4 retracement).
Rejection here is a prime area to look for sell confirmations.
Liquidity Zones:
The yellow highlighted box shows a liquidity sweep / possible order block area.
This region may serve as a trap zone before dropping — ideal area to watch for bearish confirmation.
Confluence Factors:
Shooting Star candles at highs (sign of exhaustion).
Market structure has shifted — Breaks of Structure (BOS) and Change of Character (CHoCH) support bearish bias.
Price rejected the weak high (labeled on chart), which also confirms sellers stepped in.
Good Luck 🎯
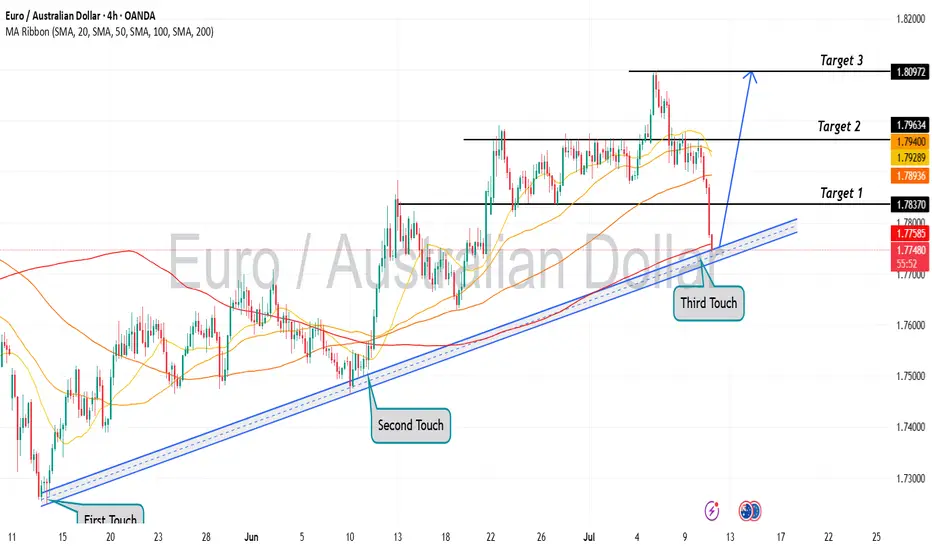
EURUAD is in the Buy direction from the Third Touch Hello Traders
In This Chart EUR/AUD 4 HOURLY Forex Forecast By FOREX PLANET
today EUR/AUD analysis 👆
🟢This Chart includes_ (EUR/AUD market update)
🟢What is The Next Opportunity on EUR/AUD Market
🟢how to Enter to the Valid Entry With Assurance Profit
This CHART is For Trader's that Want to Improve Their Technical Analysis Skills and Their Trading By Understanding How To Analyze The Market Using Multiple Timeframes and Understanding The Bigger Picture on the Charts
EUR AUD BUY OR SEll?If price respects the area of resistance sell .If bypassing the resistance bar price will be bullish . waiting for more confirmation!
EURAUD Set To Grow! BUY!
My dear followers,
This is my opinion on the EURAUD next move:
The asset is approaching an important pivot point 1.7833
Bias - Bullish
Safe Stop Loss - 1.7781
Technical Indicators: Supper Trend generates a clear long signal while Pivot Point HL is currently determining the overall Bullish trend of the market.
Goal - 1.7932
About Used Indicators:
For more efficient signals, super-trend is used in combination with other indicators like Pivot Points.
Disclosure: I am part of Trade Nation's Influencer program and receive a monthly fee for using their TradingView charts in my analysis.
———————————
WISH YOU ALL LUCK
X1: EURAUD Short Trade OANDA:EURAUD Short trade, with my back testing of this strategy, it hits multiple possible take profits, manage your position accordingly.
This is good trade, don't overload your risk like greedy, be disciplined trader, this is good trade.
Use proper risk management
Looks like good trade.
Lets monitor.
Use proper risk management.
Disclaimer: only idea, not advice

EURAUD higher bearish for expect
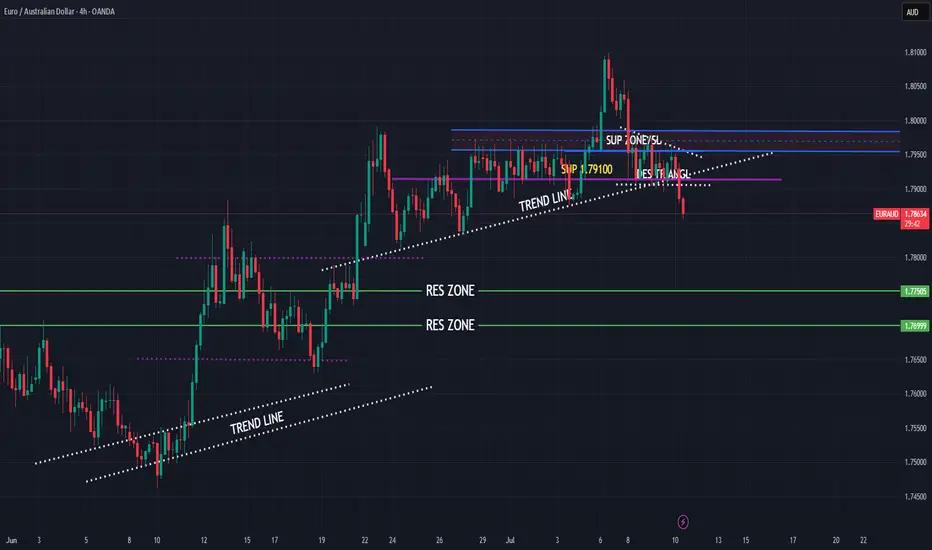
OANDA:EURAUD bullish trend nearly last two months.
Good structure visible, we have breaked trend line, sup zone (1.79100) breaked and DESCENDINGING TRIANGL is breaked, we are have and RBA and RBNZ in last days.
EUR looks like is start losing power and like cant more pushing, from here expectations are for more bearish.
SUP zone: 1.79500
RES zone: 177500, 177000
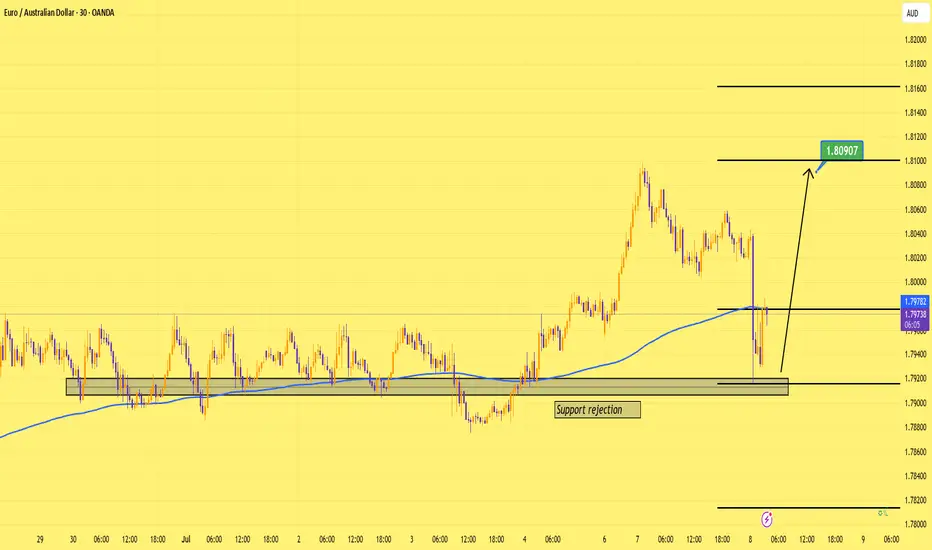
EURAUD Support HeldOur last trade on this pair resulted in profits
200 EMA + prior structure held firm — clean rejection off the zone.
I’m expecting price to climb back toward 1.8090 and possibly extend higher.
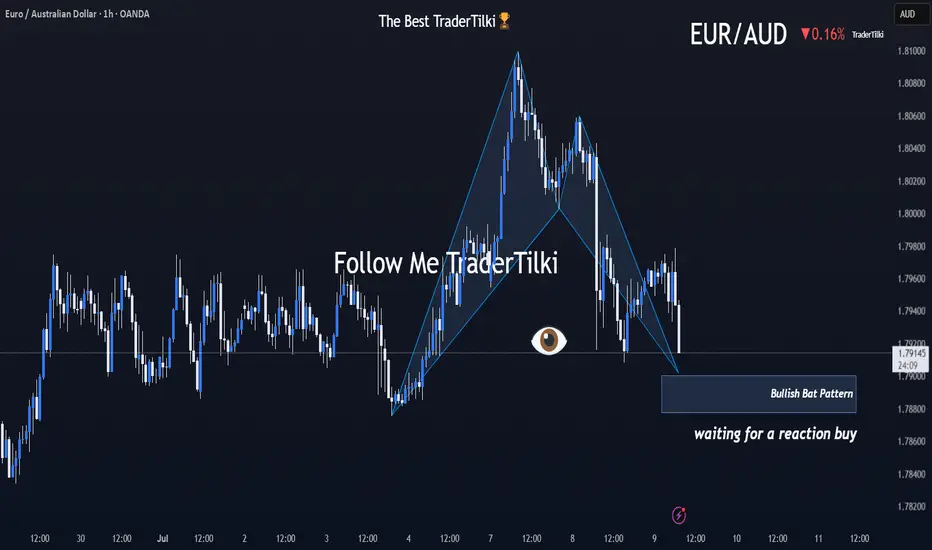
Brace Yourselves: EURAUD’s Harmonic Storm Is Coming!Good morning, Traders ☀️
I've identified a bullish harmonic Bat pattern on the EURAUD pair.
At this stage, I'm only anticipating a reactional buy from the marked zone.
I'll determine my target level after observing the market's response from that area.
📌 I’ll be sharing the target details under this post once the reaction unfolds.
Your likes and support are what keep me motivated to share these analyses consistently.
Huge thanks to everyone who shows love and appreciation! 🙏