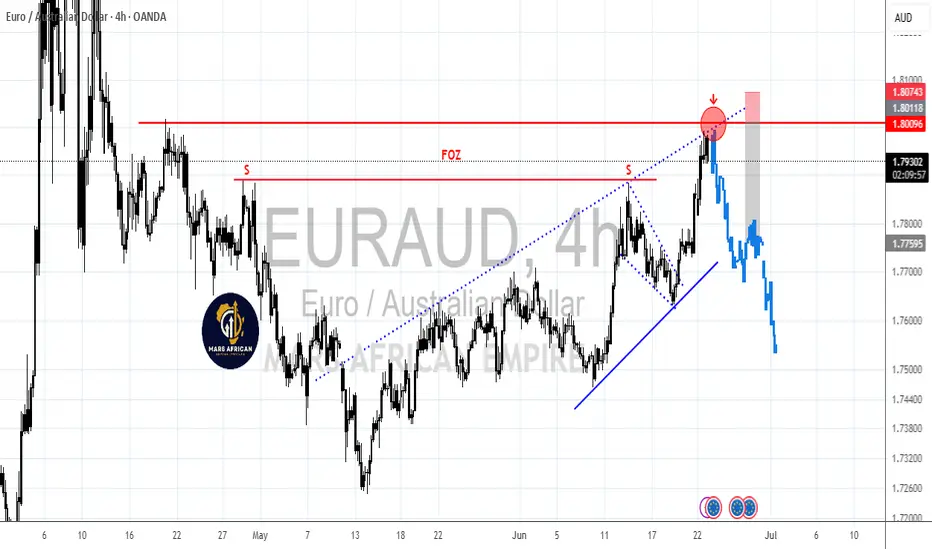
EURAUD BEARISHEURAUD
4Hr TF
1. We have a completed Wedge / Flag. Once a flag is completed, we should always expect a drop
2. Confluence, We also have 3 zones, which complement our setup, which we believe would push this pair down
3. SS+ FOZ, we also have a fake-out zone concept that might be at play on this pair and push it down.
EURAUD trade ideas
EURAUD – Building Support Above TrendlineEURAUD is holding above trendline support with upside potential.
🎯 Targets: 1.79608 → 1.79985
⚠️ Invalidation if price drops below 1.78951

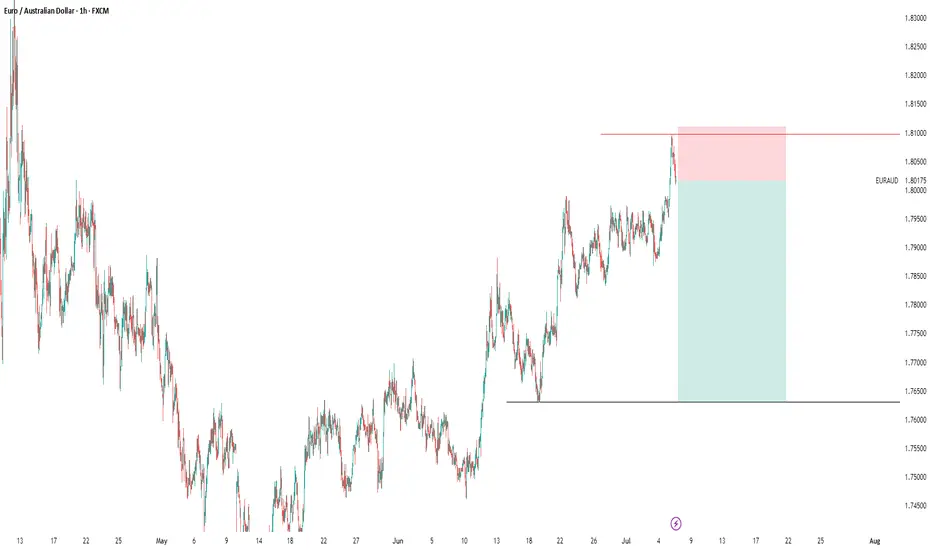
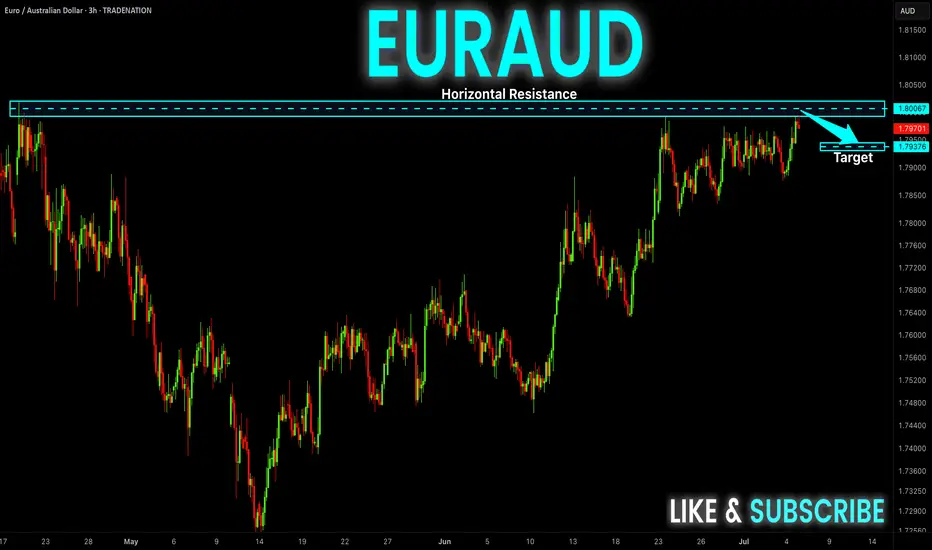
EURAUD approaches resistance and reacts!!!! A decline expected?Price made a full retracement to a resistance High of 1.80620 we have a high probability of seeing a decline in price. Therefore, it won’t be a surprise if I start to see a sell off around that level. Keep close watch to see how traders react around there!
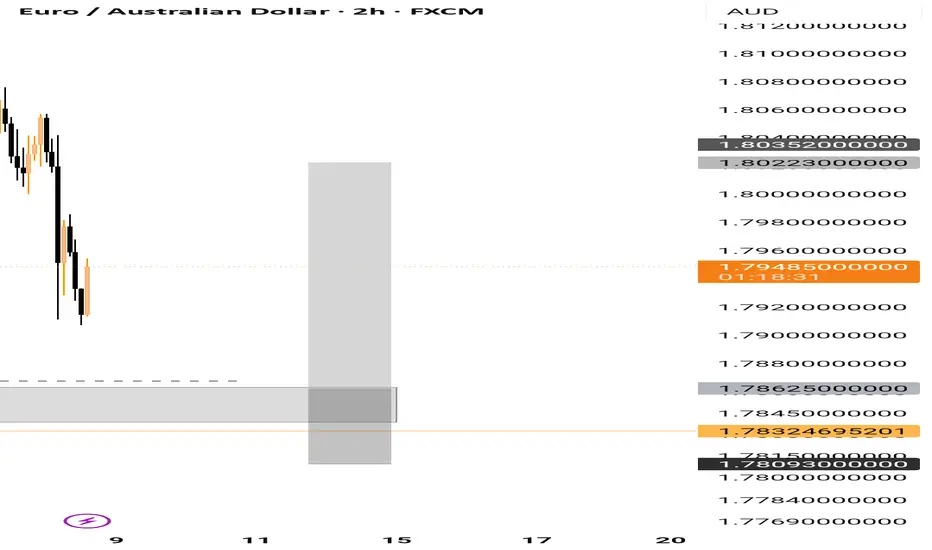
EURAUD BUY SETUP IDEAI will be longing #euraud when price return to the demand area 1.78625 while my invalidation point is 1.78093 and target is 1.80223 respectively. Apply proper risk management🤌🏾.
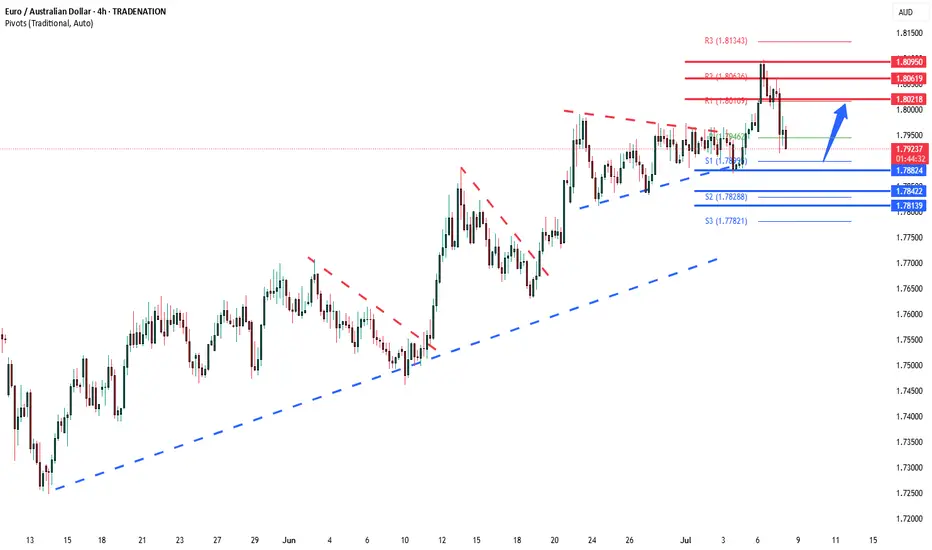
EURAUD support retest at 1.7880The EURAUD currency pair maintains a bullish bias, underpinned by the prevailing upward trend. Recent sideways consolidation in intraday price action suggests a potential continuation pattern within the broader uptrend.
The key level to watch is 1.7880, marking the lower boundary of the recent consolidation range. A corrective pullback toward this level, followed by a bullish bounce, could trigger a fresh rally targeting resistance levels at 1.8020, then 1.8060, and potentially 1.8090 over the medium term.
Conversely, a decisive breakdown below 1.7880, confirmed by a daily close beneath this support, would invalidate the current bullish outlook. This would expose the pair to deeper retracement targets near 1.7840, followed by 1.7810.
Trend Bias: Bullish above 1.7880
Key Support: 1.7880, 1.7840, 1.7810
Key Resistance: 1.8020, 1.8060, 1.8090
Conclusion:
EURAUD remains technically constructive while holding above 1.7880. Traders should monitor this level for bullish continuation signals. A bounce from this zone could reinforce the uptrend, while a break and close below it would shift momentum and open the door for a deeper corrective move.
This communication is for informational purposes only and should not be viewed as any form of recommendation as to a particular course of action or as investment advice. It is not intended as an offer or solicitation for the purchase or sale of any financial instrument or as an official confirmation of any transaction. Opinions, estimates and assumptions expressed herein are made as of the date of this communication and are subject to change without notice. This communication has been prepared based upon information, including market prices, data and other information, believed to be reliable; however, Trade Nation does not warrant its completeness or accuracy. All market prices and market data contained in or attached to this communication are indicative and subject to change without notice.
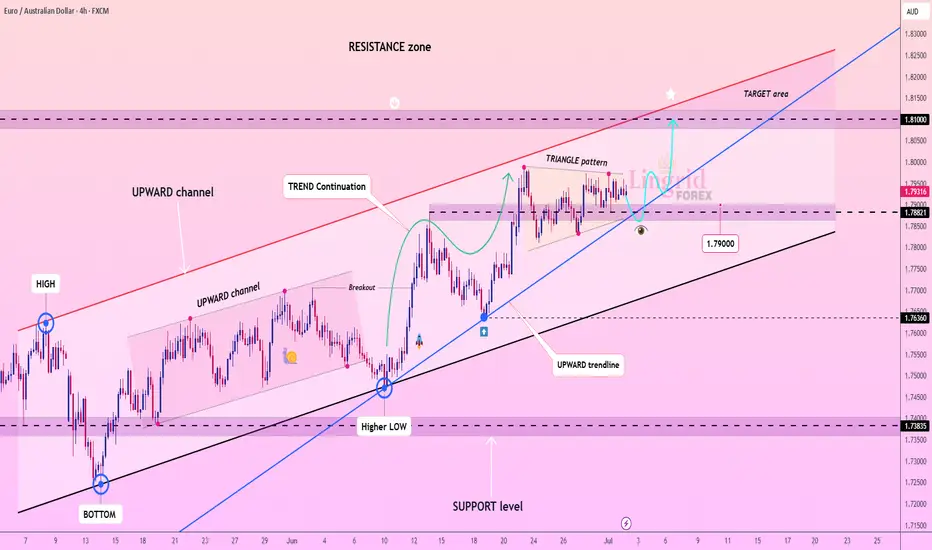
Lingrid | EURAUD Trend Continuation Pattern FX:EURAUD is maintaining bullish momentum within a broad upward channel after bouncing from the 1.7900 support zone and forming a triangle continuation pattern. Price is coiling just below the 1.8000 handle and the red resistance boundary of the channel. A confirmed breakout above 1.8000 could open the path toward the 1.8100 target area, extending the broader bullish structure.
📈 Key Levels
Buy zone: 1.7880–1.7900
Sell trigger: breakdown below 1.7880
Target: 1.8100
Buy trigger: breakout and retest of 1.8000–1.8020 zone
💡 Risks
Rejection from 1.8000 resistance could trigger a pullback
Break below the blue trendline may invalidate bullish setup
Low momentum breakout may stall below 1.8050
If this idea resonates with you or you have your own opinion, traders, hit the comments. I’m excited to read your thoughts!
euraud sell signal. Don't forget about stop-loss.
Write in the comments all your questions and instruments analysis of which you want to see.
Friends, push the like button, write a comment, and share with your mates - that would be the best THANK YOU.
P.S. I personally will open entry if the price will show it according to my strategy.
Always make your analysis before a trade
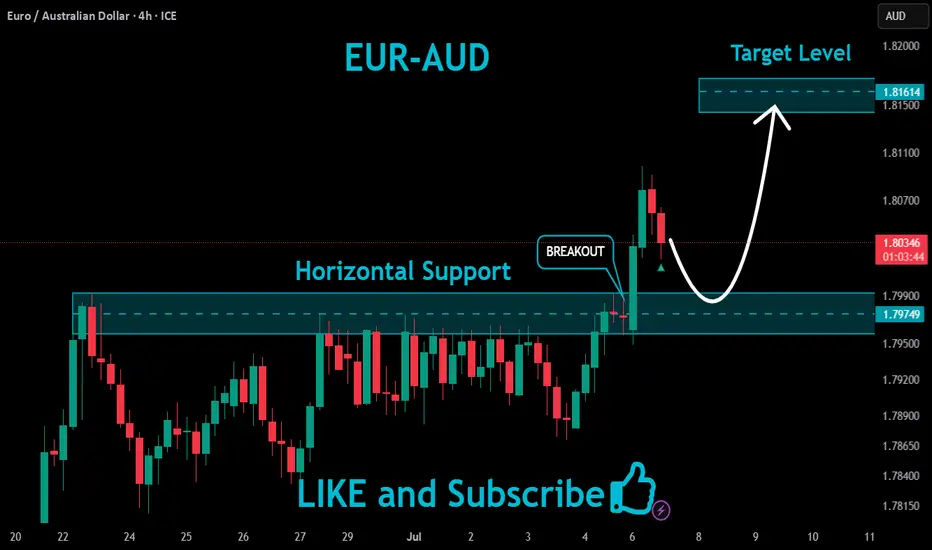
EURAUD Local Long!
HI Traders !
#EURAUD is trading in an
Uptrend and the pair is
About to retest a horizontal
Support of 1.79749 and as
We are locally bullish biased
We will be expecting a
Local bullish rebound !
Comment and subscribe to help us grow !
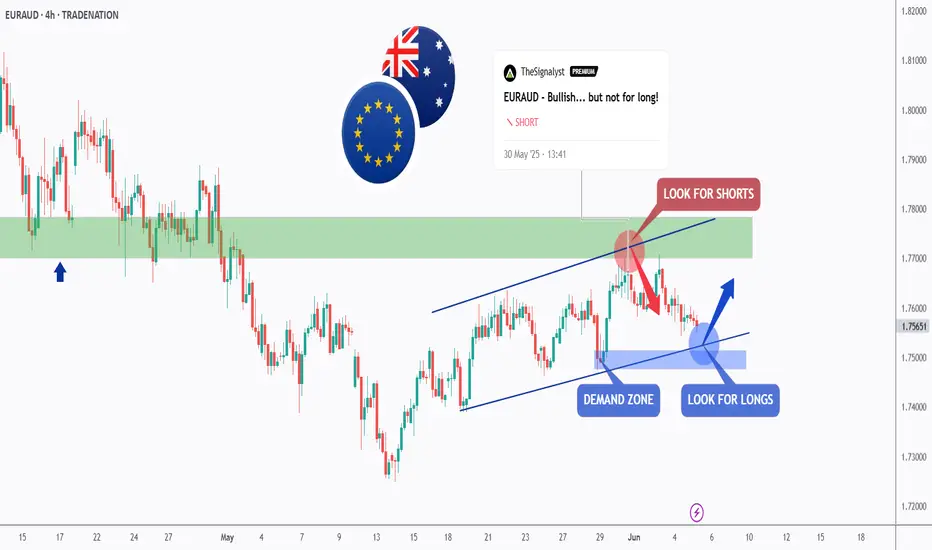
EURAUD - Bearish... but not for long!Hello TradingView Family / Fellow Traders. This is Richard, also known as theSignalyst.
As per our last EURAUD analysis, attached on the chart, it rejected the upper bound of the blue channel and traded lower.
What's next?
📈EURAUD is now retesting the lower bound of the channel.
Moreover, the blue zone is a strong demand.
🏹 Thus, the highlighted blue circle is a strong area to look for buy setups as it is the intersection of the lower blue trendline and demand.
📚 As per my trading style:
As #EURAUD is around the blue circle zone, I will be looking for bullish reversal setups (like a double bottom pattern, trendline break , and so on...)
📚 Always follow your trading plan regarding entry, risk management, and trade management.
Good luck!
All Strategies Are Good; If Managed Properly!
~Rich
Disclosure: I am part of Trade Nation's Influencer program and receive a monthly fee for using their TradingView charts in my analysis.
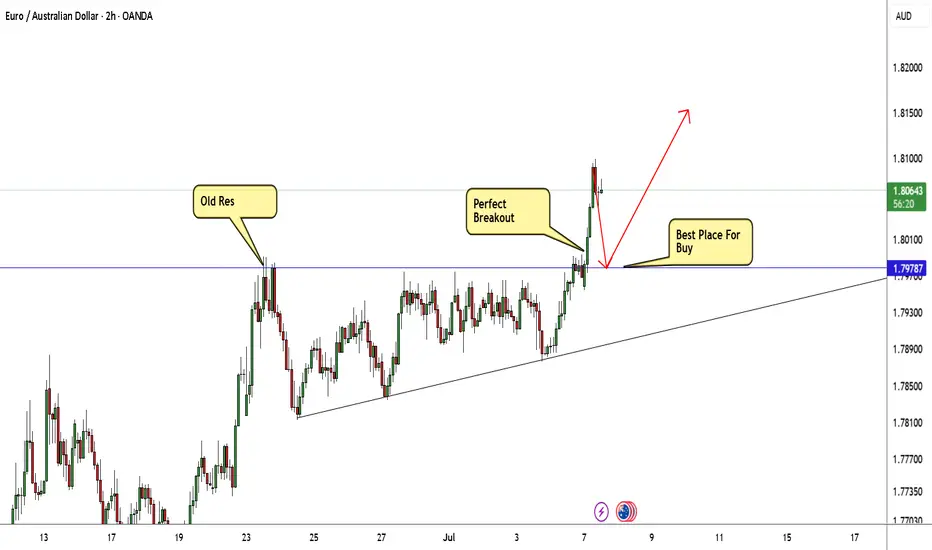
EUR/AUD Made Perfect Breakout , Long Setup Valid To Get 150 PipsHere is My 2H T.F Chart and if we have a look we will see that we have a very good breakout after this ascending triangle , the price finally closed above neckline for this pattern and we have a good confirmation so i`m waiting the price to go back to retest this broken neckline and then we can enter a buy trade . and if the price closed below my neckline with daily candle then this idea will not be valid anymore .
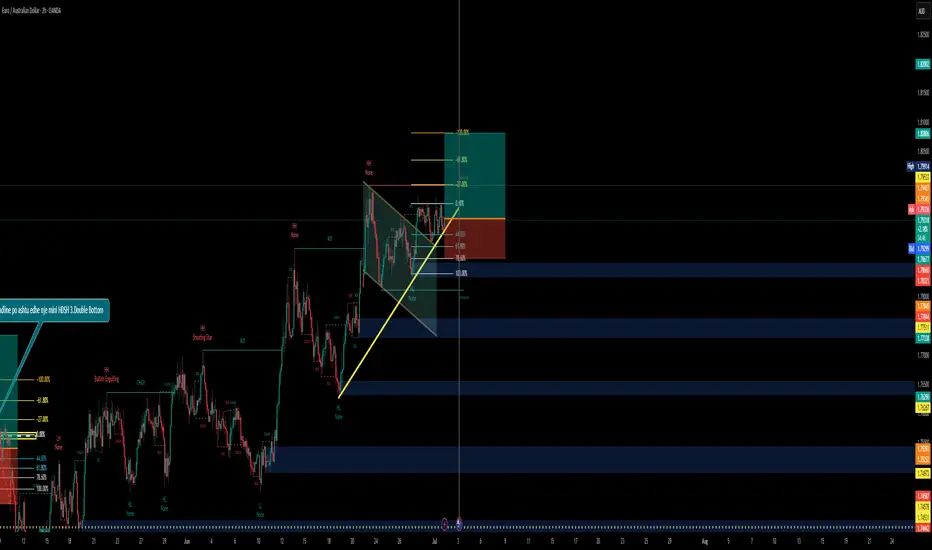
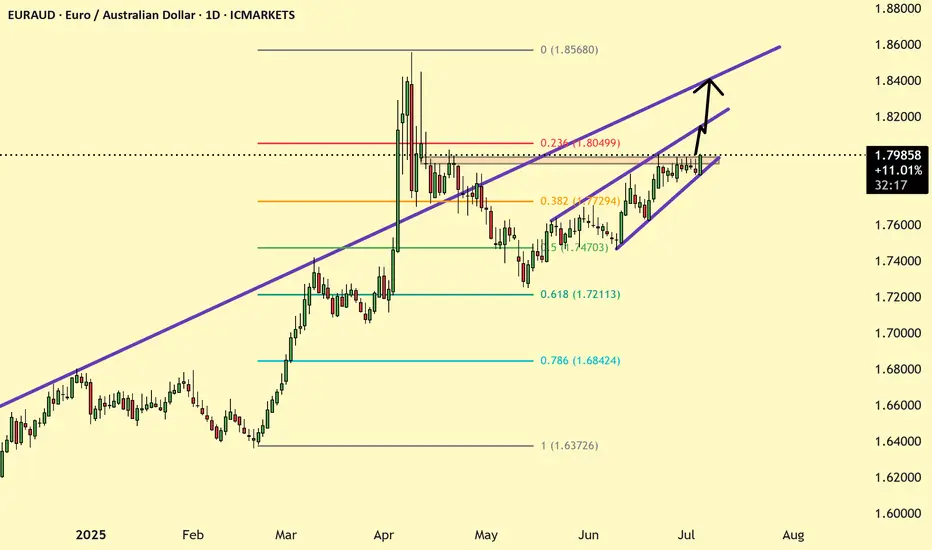
EURAUDBullish Continuation from a Bull Flag Pattern + Break of Structure
Bull Flag Pattern Formed
After a strong impulsive bullish move, the price forms a consolidation channel (flag), sloping slightly downward.
This is a classic bull flag pattern, indicating bullish continuation.
Break of Structure (BOS) Confirmed
The price broke above the flag, showing a BOS (Break of Structure) to the upside.
This confirms a potential continuation of the uptrend.
Fibonacci Confluence
Price retraced to the 61.8–78.6% Fibonacci zone (golden zone), which often acts as a strong reversal area in trending markets.
This gives a good risk-to-reward (R:R) opportunity.
Higher Highs and Higher Lows (Market Structure)
The market is forming HHs (Higher Highs) and HLs (Higher Lows) – typical of a healthy uptrend.
Demand Zones Below
Several demand zones (blue boxes) support price if it retraces.
The strong low marked adds structure-based support beneath the trade entry.
Risk-to-Reward (R:R) Setup
You’ve set a tight stop loss below structure and a larger take profit aiming at the -61.8% and 100% Fib extensions – a favorable R:R ratio
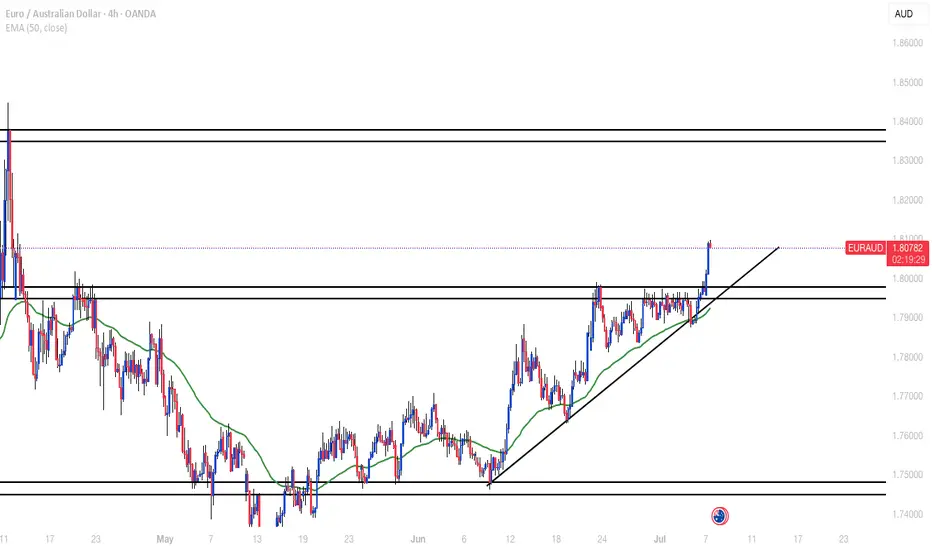
EURAUDH4 resistance broken and also have a support trendline. Waiting for a retest to take buys to the next H4 resistance zone around 1.83500. Watch the fundamentals too.
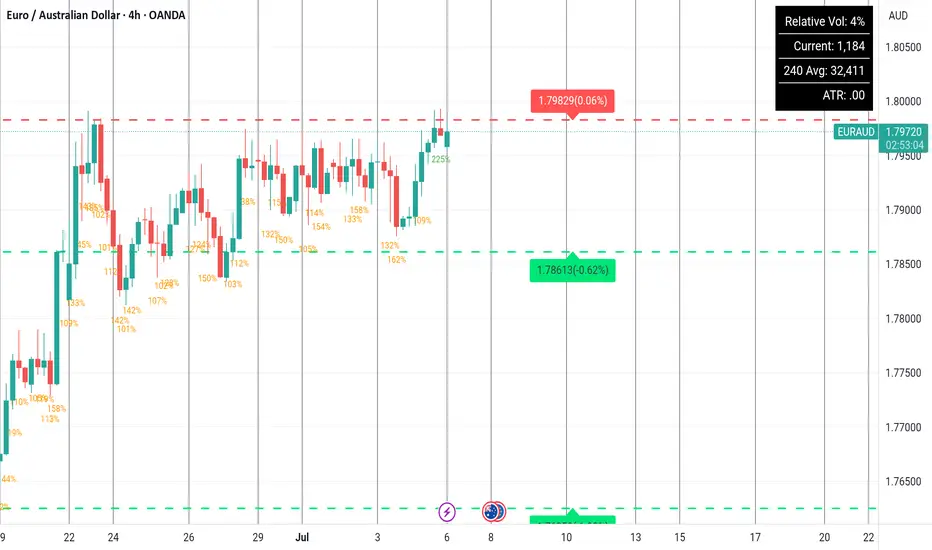
Eur/aud sellI can see negative volume with sell signals , looks good to sell at current price of 1.79700 possible drop to 1,78613 nice trade
EUR-AUD Will Fall! Sell!
Hello,Traders!
EUR-AUD keeps trading in
A strong uptrend and the pair
Is locally overbought so as the
Pair is retesting a horizontal
Resistance of 1.8019 from
Where we will be expecting
A local pullback on Monday
Sell!
Comment and subscribe to help us grow!
Check out other forecasts below too!
Disclosure: I am part of Trade Nation's Influencer program and receive a monthly fee for using their TradingView charts in my analysis.
EURAUD H4 SWING LONG SETUP: 7-11 JULY 2025TECHNICAL ANALYSIS
The pair has finally broke out of the range to the upside, a strong sign of the bullish trend continuation. As we can see price closed @ 1.7973 resistance and also forming a higher high. To go long wait for price to get to support at the buy zone and a print of a higher low.
FUNDAMENTAL ANALYSIS
The trend meter indicates that the market is bullish on this pair with a bullish score of 7. The COT data shows institutional taders are long Euro and short AUD by 80.47%. Retail sentiment however shows retail traders are short this pair. Euro has been bullish for a while and it looks like it could continue in the week ahead.

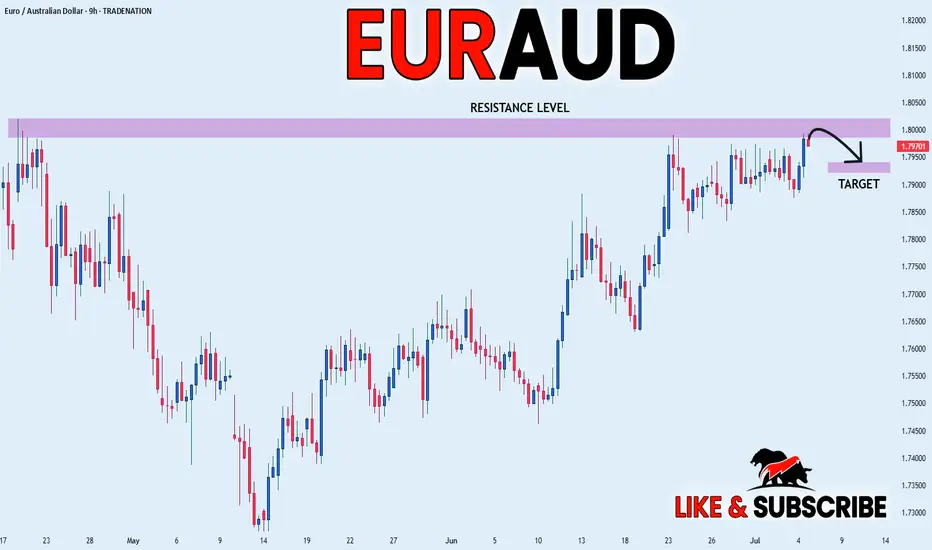
EUR_AUD LOCAL CORRECTION|SHORT|
✅EUR_AUD is set to retest a
Strong resistance level above at 1.8020
After trading in a local uptrend for some time
Which makes a bearish pullback a likely scenario
With the target being a local support below at 1.7940
SHORT🔥
✅Like and subscribe to never miss a new idea!✅
Disclosure: I am part of Trade Nation's Influencer program and receive a monthly fee for using their TradingView charts in my analysis.
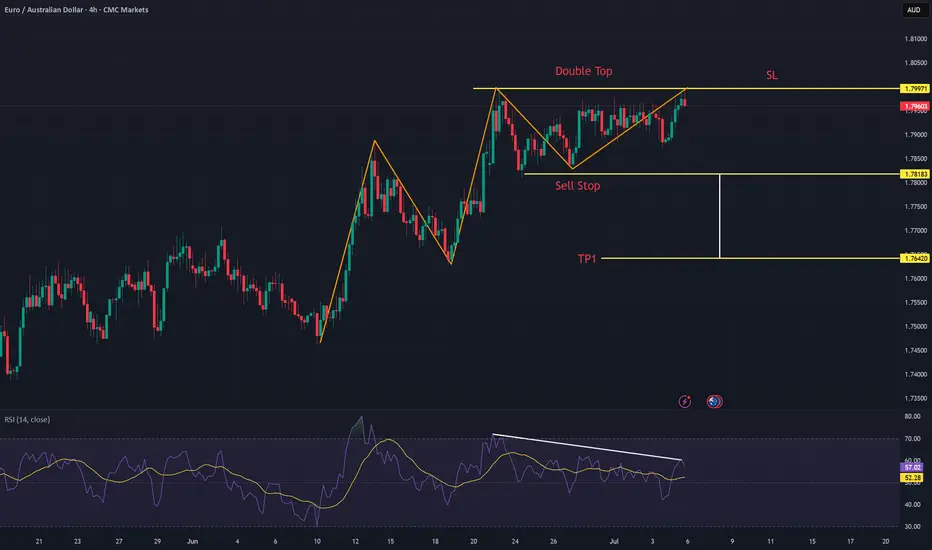
EURAUD: Double Top Potential ReversalEURAUD is setting up for a potential bearish reversal, highlighted by a clear Double Top pattern. This price action, combined with bearish divergence on the RSI. A decisive break below the pattern's neckline will confirm the bearish outlook, targeting further downside.
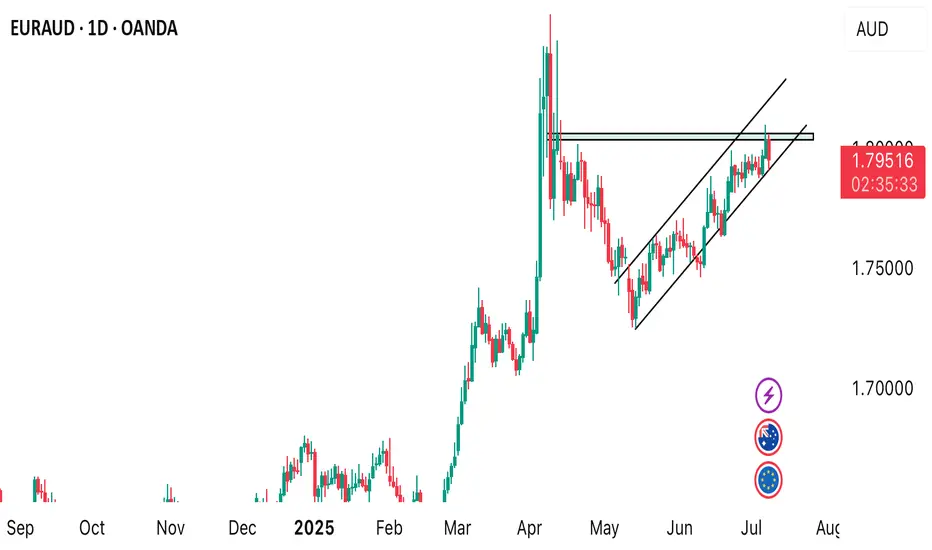
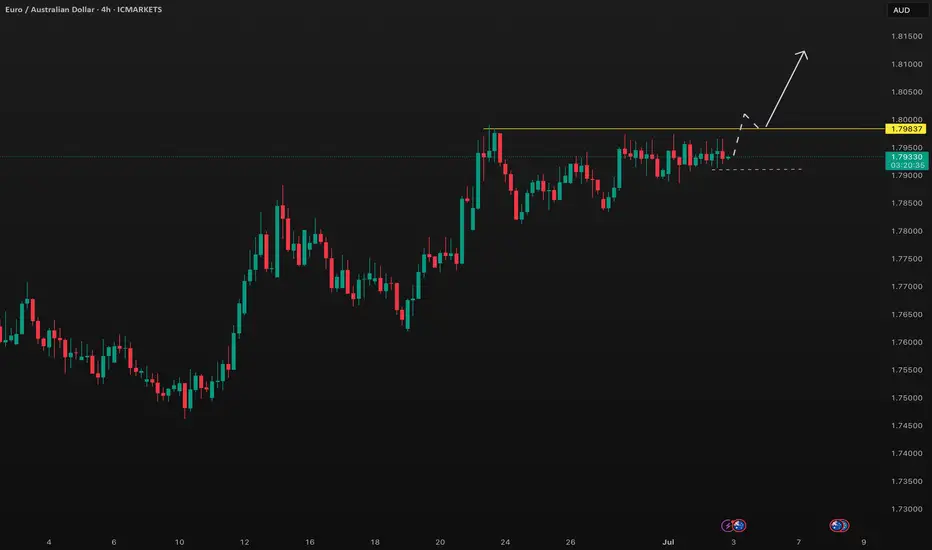
EURAUD Ready to break the horizontal resistance EURAUD is currently in a well-established uptrend and trading within an ascending channel. The price is now testing the channel resistance, and momentum indicators suggest underlying strength that could support a breakout.
If the pair successfully breaks above the current resistance zone, it may initially target the upper boundary of the channel around 1.815. A decisive breakout above this level could open further upside potential toward 1.840.
Traders should watch for strong bullish candlestick confirmation at the resistance area or a retest of the breakout level for potential long entries.
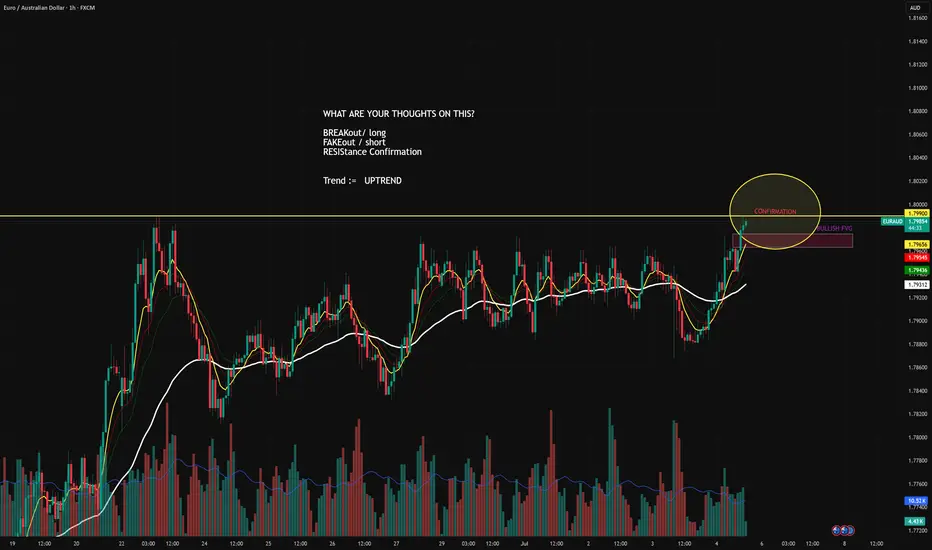
EUR/AUD 1H – Decision Point Ahead Breakout or Fakeout? Eyes on Confirmation Zone 👁️
EUR/AUD has finally tapped into a critical resistance at 1.79900, a level previously rejected with high volatility. The current price action is testing this ceiling, with signs of strength — but smart money waits for confirmation.
What We’re Seeing:
🔹 Uptrend Intact: All EMAs are aligned in bullish order.
🔹 Bullish Fair Value Gap (FVG) formed below — a potential area of demand.
🔹 Price now hovering inside the Confirmation Zone — marked by previous highs and psychological resistance.
🔹 Volume building gradually — but breakout volume not confirmed yet.
⚖️ Summary:
Trend: Upward
Structure: Breakout under test
Momentum: Bullish
Market Phase: Confirmation / decision point
Key Behavior: Watch for commitment or rejection without predicting it
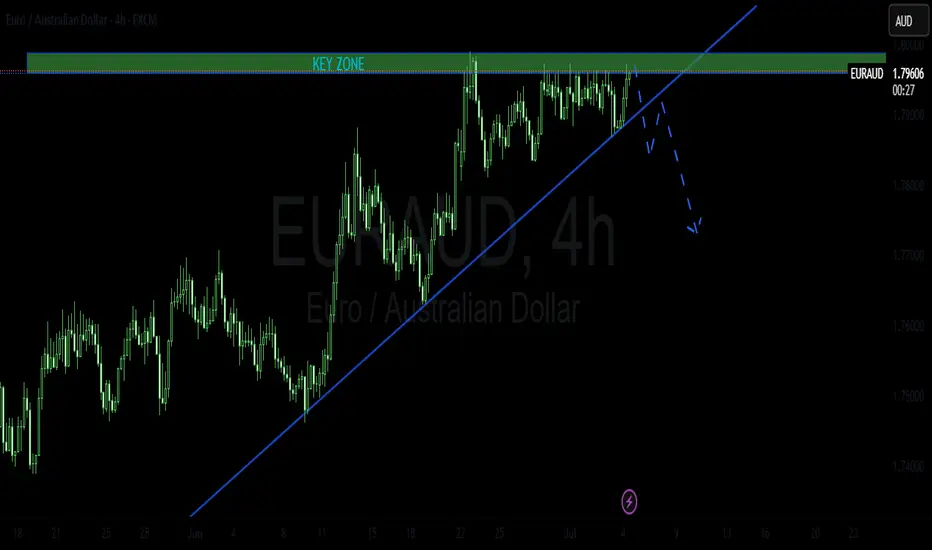
EURAUD POSSIBLE SHORT TRADE PLANThe pair has been trading inside a bullish trend, supported by a rising trendline. It recently hit a strong key zone which it failed to break so far. If the price keeps rejecting from this zone and subsequently breaks the supporting trendline, it will be an indication of a bearish movement.
Please do your own analysis before placing any trades.
Cheers and Happy Trading !!!
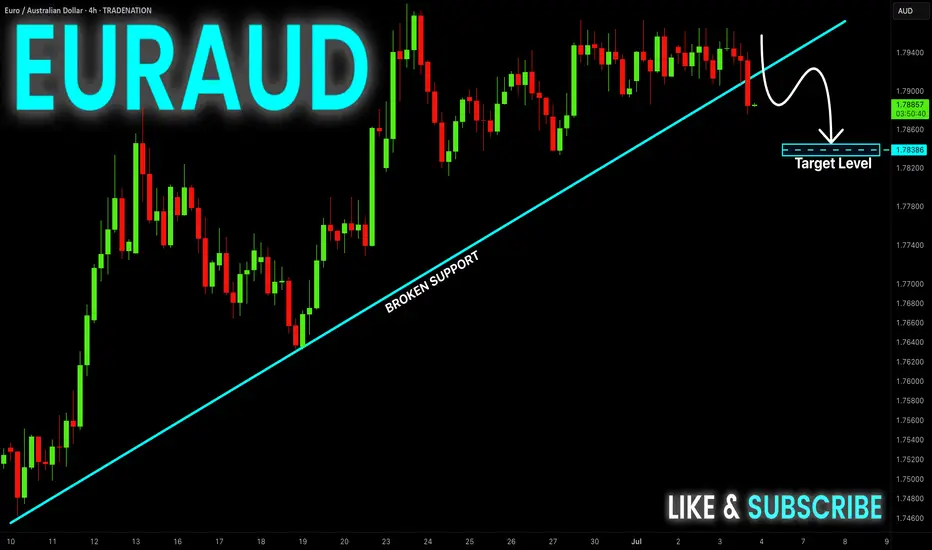
EUR-AUD Bearish Breakout! Sell!
Hello,Traders!
EUR-AUD was trading along
The rising support line but
Now we are seeing a bearish
Breakout so we are bearish
Biased and we will be expecting
A further bearish move down
Sell!
Comment and subscribe to help us grow!
Check out other forecasts below too!
Disclosure: I am part of Trade Nation's Influencer program and receive a monthly fee for using their TradingView charts in my analysis.
EURAUD BUY TRADE PLAN 2🔥 **EUR/AUD TRADE PLAN 🔥**
📅 **Date:** 02 July 2025
📋 **Plan Overview**
| Parameter | Details |
| ---------- | ------------------------------ |
| Type | Intra-day conditional breakout |
| Direction | Buy stop (breakout plan) |
| Status | Pending conditional trigger |
| R\:R | 3:1 (minimum) |
| Confidence | ⭐⭐⭐⭐ (85%) |
---
📈 **Market Bias & Trade Type**
Bias: Bullish continuation
Type: Breakout (stop-order conditional plan)
EUR/AUD is consolidating below a key breakout level (\~1.7965–1.7980) after a clean HTF bullish structure. D1 and H4 both show continuation bias; price is coiling beneath resistance.
---
🔰 **Confidence Level**
⭐⭐⭐⭐ (85%)
* D1/H4 bullish BOS + HTF structure: 35%
* Consolidation below resistance with compression: 30%
* Macro alignment (EUR supported by relative strength, AUD neutral): 20%
* Volume profile (build-up near top of range): 15%
---
📍 **Entry Zones**
🟩 **Primary (Breakout Stop):** Buy Stop @ 1.7983 (+3 pip buffer above 1.7980 range high)
❗ **Stop Loss**
SL: 1.7910 (below last H1 swing low inside structure + ATR buffer)
🎯 **Take Profit Targets**
🥇 TP1: 1.8030 (first liquidity sweep + minor HTF resistance)
🥈 TP2: 1.8080 (measured move target + H4 resistance)
🥉 TP3: 1.8120 (extension level, trail runner if breakout accelerates)
📏 **Risk\:Reward**
~3:1 to TP2
---
🧠 **Management Strategy**
* Risk 1% of account (adjust lots accordingly)
* Move SL to breakeven after TP1
* Scale: 50% TP1, 30% TP2, 20% trail for TP3
---
⚠️ **Confirmation Checklist**
✅ H4/H1 candle body close above 1.7980
✅ Volume spike on breakout
✅ London/NY session execution
✅ No major rejection wick at break
---
⏳ **Validity**
H1 setup → 12–18 hours (expires end of NY session 03 July 2025)
---
❌ **Invalidation**
* Clean return below 1.7910 = structure failure, plan voided
* HTF bearish BOS against
---
🌐 **Fundamental & Sentiment Snapshot**
* ECB stance: Hawkish / AUD macro neutral
* Sentiment score: +6 (EUR macro edge + technical structure)
* No red flag macro contradiction
* No opposing liquidity pool within immediate ATR
---
📋 **Final Trade Summary**
➡ Conditional buy stop breakout at 1.7983 if confirmation hits
➡ SL 1.7910, TP1 1.8030 / TP2 1.8080 / TP3 1.8120
➡ Risk 1%, clean confirmation required
---
✅ **NOTE:**
⚠ This plan is conditional: no risk applied unless break and confirmation occur.
EURAUD -0.7% Short and AUDUSD MistakeA short position taken on EURAUD for a small loss after manually closing before swaps. I have also included a breakdown of a +4% AUDUSD long I was looking at taking but a small error on my behalf that caused me to stay out of the trade. Full explanation as to why I executed on this position and made the decision to manually close at the level I did.
Any questions you have just drop them below 👇
