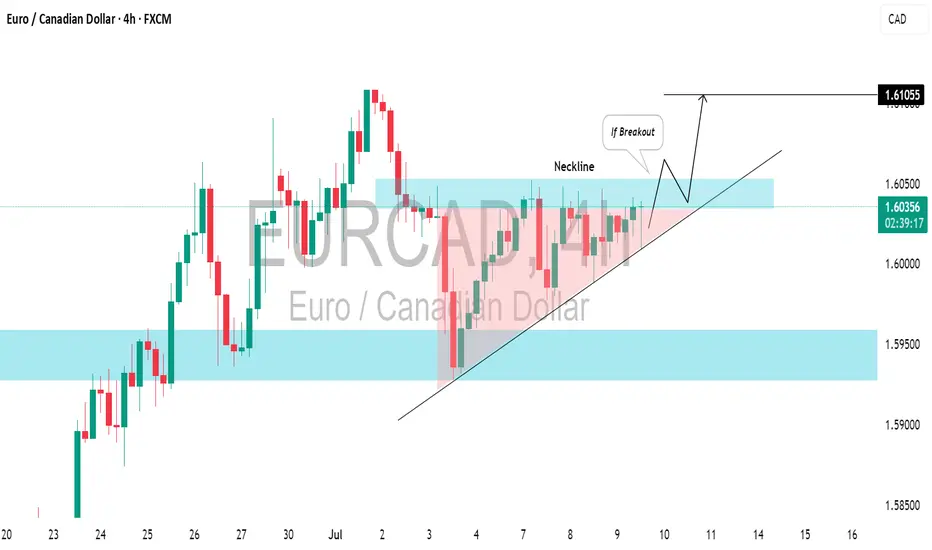
EURCAD: Strong Bullish PatternObserve the price movement on 📈EURCAD.
The next buying signal will occur with a bullish breakout above the neckline of an ascending triangle pattern on the 4-hour chart.
A 4-hour candle closing above 1.6056 will confirm this breakout, with the next resistance level at 1.6105.
About Euro / Canadian Dollar
The Euro vs. the Canadian Dollar. The Euro is the second most popular reserve currency in the world and is considered to be very stable. The Canadian dollar is the seventh most commonly traded currency in the world and is highly dependent on Canada’s exporting of its natural resources, especially oil.
Related pairs
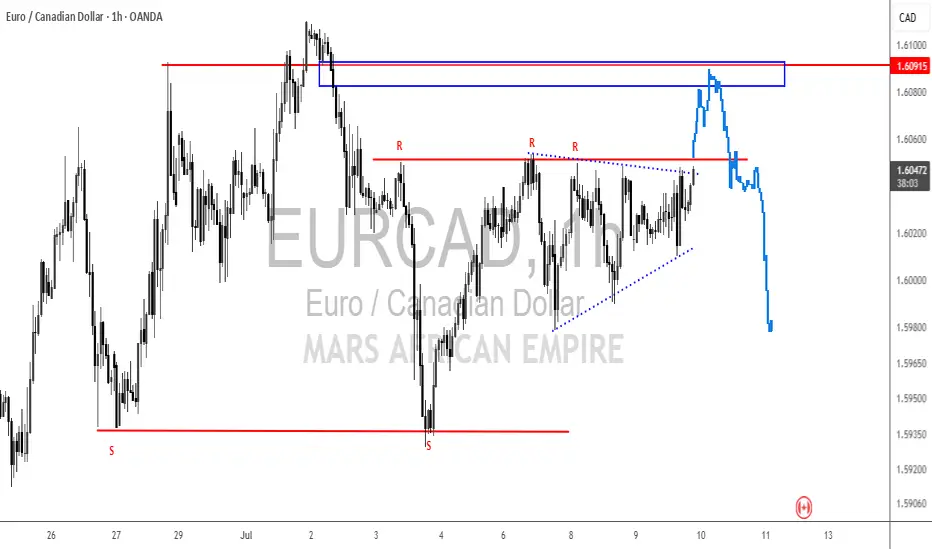
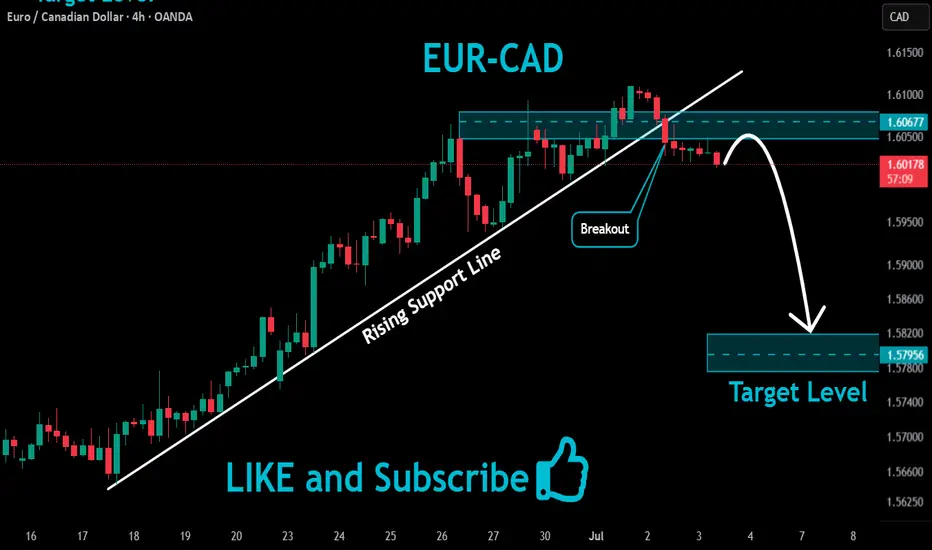
Continuation PatternWe might see this continuation pattern push us to the above POI where we will see this pair start to fall
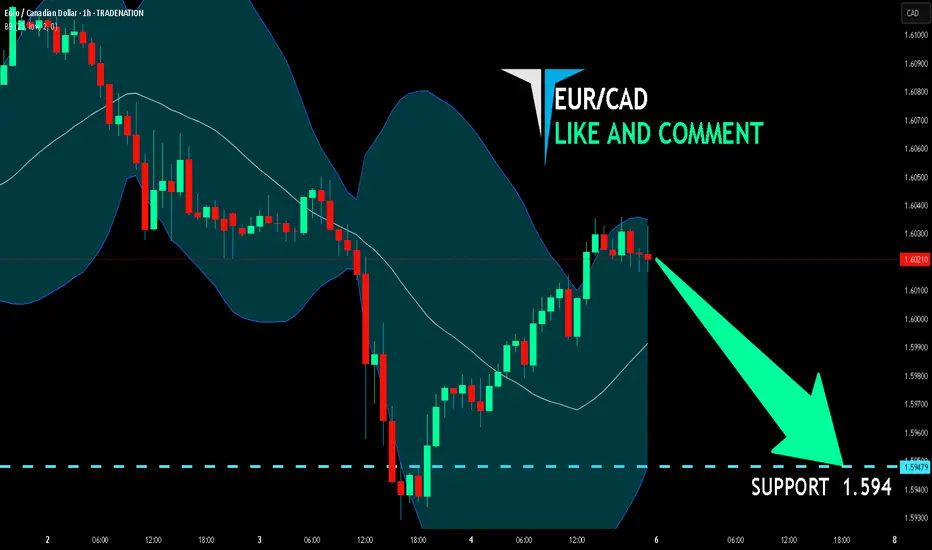
EUR/CAD BEARS ARE GAINING STRENGTH|SHORT
Hello, Friends!
We are targeting the 1.594 level area with our short trade on EUR/CAD which is based on the fact that the pair is overbought on the BB band scale and is also approaching a resistance line above thus going us a good entry option.
Disclosure: I am part of Trade Nation's Influence
Trade Recap CW27Quick and easy trade recap of my single position from last week with a cheesy little missed trade on EUR/CAD that should have been taken.

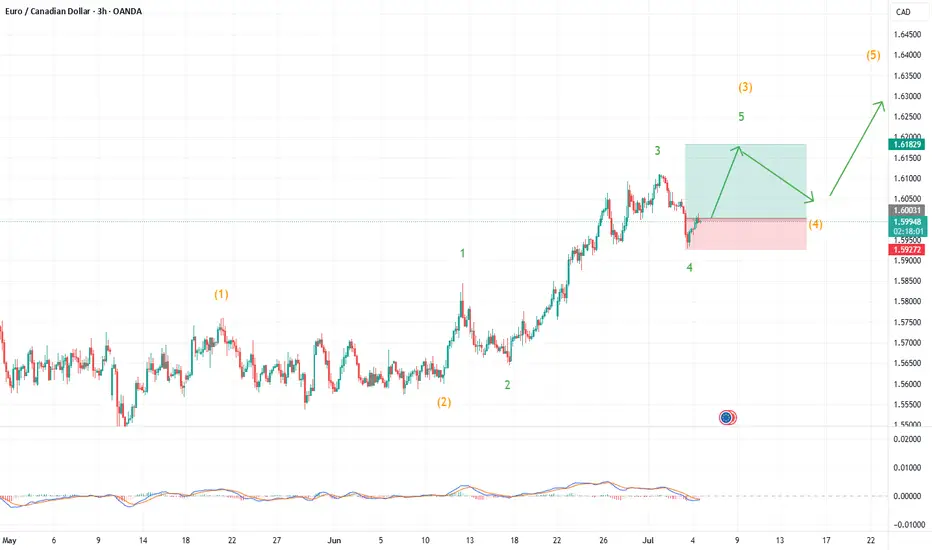
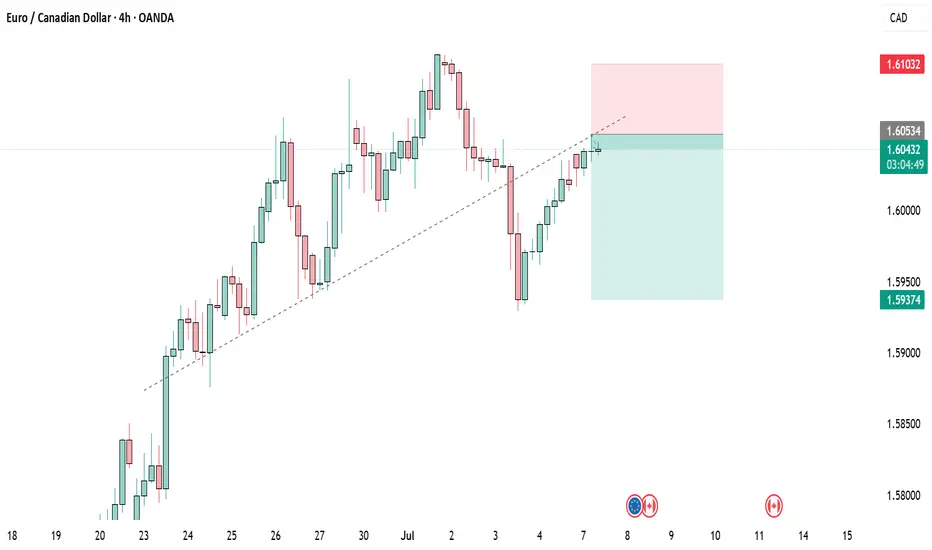
EUR/CAD: Wave 5 Trade SetupEUR/CAD is presenting a compelling long setup as what appears to be a five-wave impulse from the June lows looks ready for its final leg higher. The structure shows a classic wave 4 correction that has found support right where Elliott Wave theory suggests it should—setting up a potential wave 5 tha
EUR CadHead and shoulders pattern? using yellow horizontal line as resistance hope it passes my ema and continue selling to my support line .
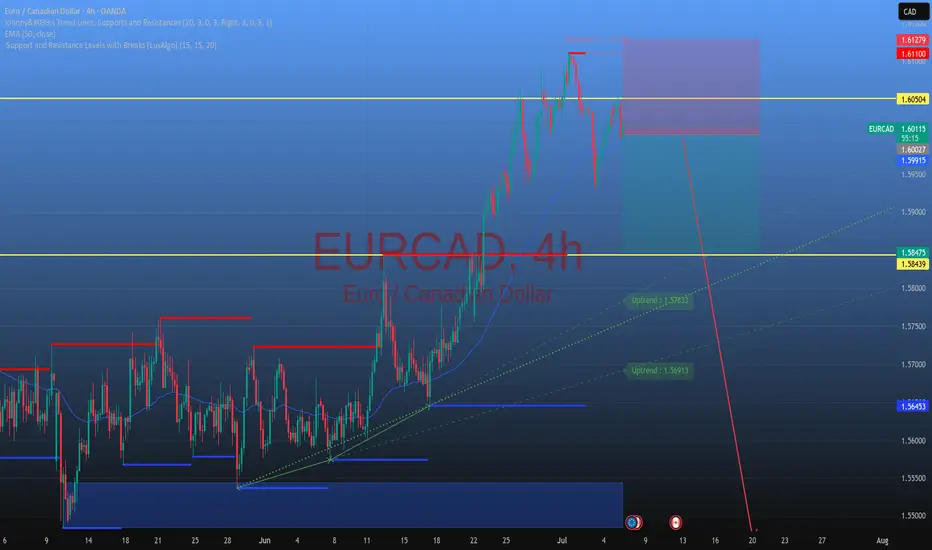
EURCAD Will Go Down!
HI,Traders !
EUR-CAD made a bearish
Breakout of the rising support
And is now consolidating
Below the line so we are
Bearish biased and we will
Be expecting a further
Bearish continuation !
Comment and subscribe to help us grow !
EURCAD Swing SellEURCAD will decline from this area observing this head and shoulders pattern. Price seems to be exhausted and may reverse anytime now
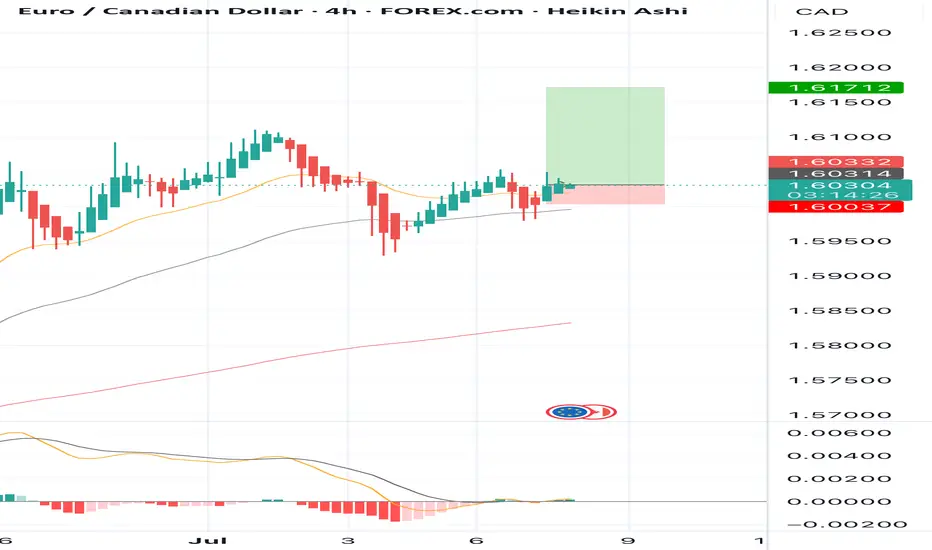
BUY EURCAD now for a four hour time frame bullish trend continuBUY EURCAD now for a four hour time frame bullish trend continuation ...............
STOP LOSS: 1.60037
This buy trade setup is based on hidden bullish divergence trend continuation trading pattern ...
Always remember, the trend is your friend, so whenever you can get a signal that the trend will
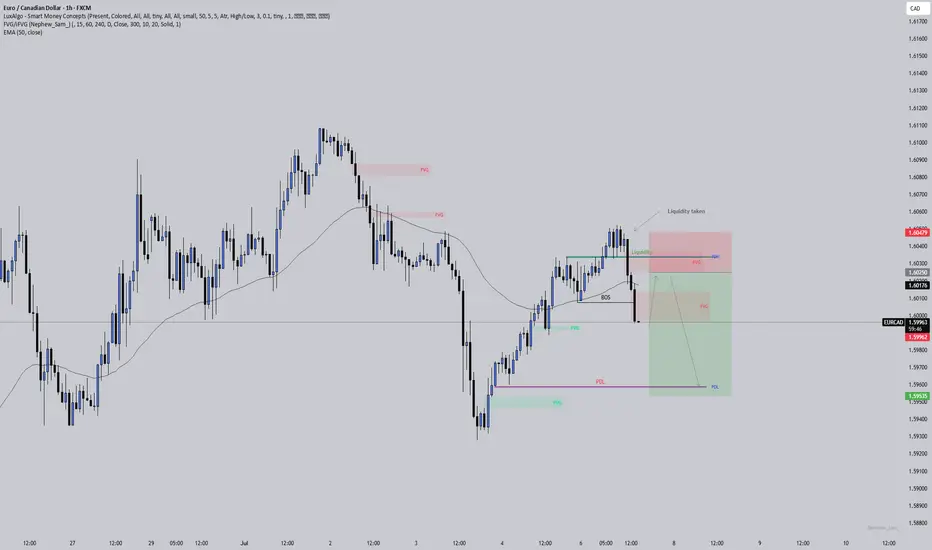
EURCAD: Liquidity taken, imbalance left behindPrice swept the liquidity above the previous day’s high and then broke structure to the downside. That’s often a sign that smart money was hunting stops before shifting direction. Now I’m watching for price to come back and fill the imbalance (FVG) it left after the break.
If that happens and price
See all ideas
Summarizing what the indicators are suggesting.
Oscillators
Neutral
SellBuy
Strong sellStrong buy
Strong sellSellNeutralBuyStrong buy
Oscillators
Neutral
SellBuy
Strong sellStrong buy
Strong sellSellNeutralBuyStrong buy
Summary
Neutral
SellBuy
Strong sellStrong buy
Strong sellSellNeutralBuyStrong buy
Summary
Neutral
SellBuy
Strong sellStrong buy
Strong sellSellNeutralBuyStrong buy
Summary
Neutral
SellBuy
Strong sellStrong buy
Strong sellSellNeutralBuyStrong buy
Moving Averages
Neutral
SellBuy
Strong sellStrong buy
Strong sellSellNeutralBuyStrong buy
Moving Averages
Neutral
SellBuy
Strong sellStrong buy
Strong sellSellNeutralBuyStrong buy
Displays a symbol's price movements over previous years to identify recurring trends.