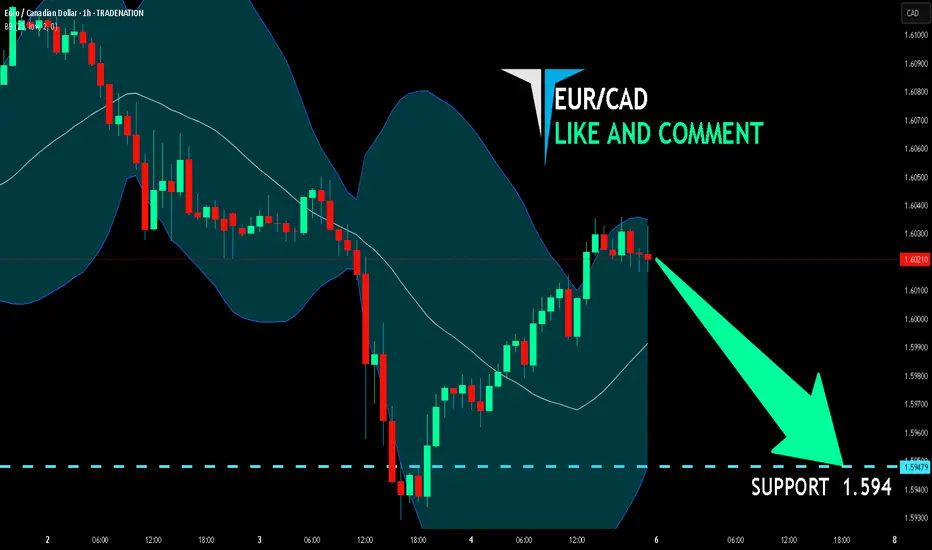
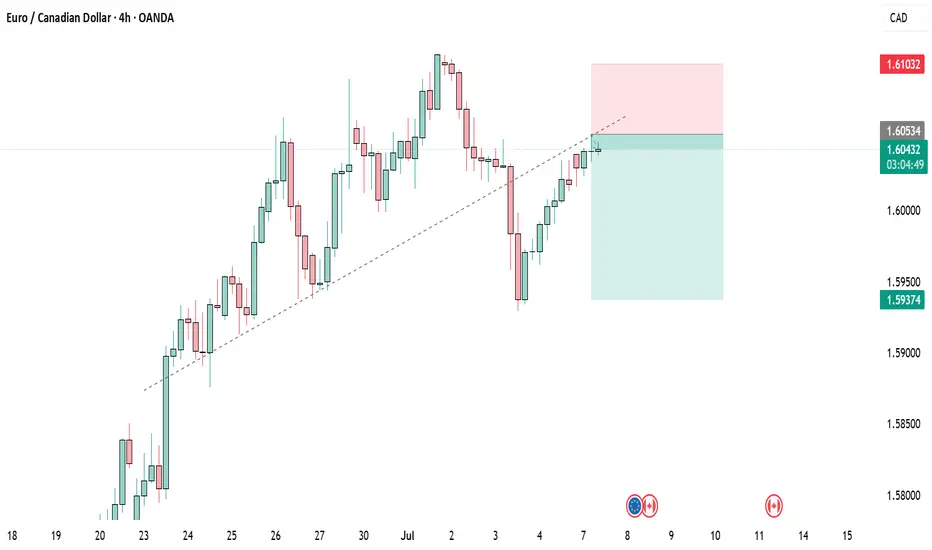
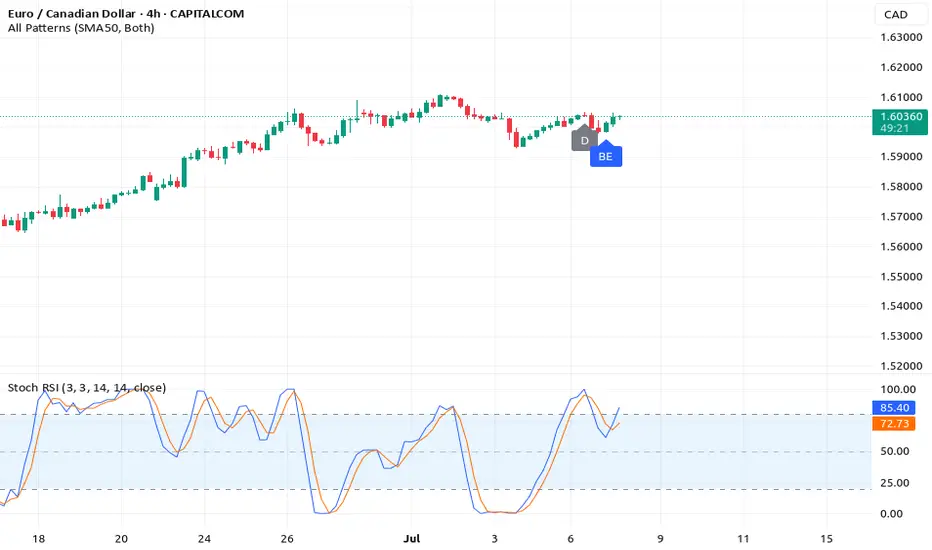
EUR/CAD BEARS ARE GAINING STRENGTH|SHORT
Hello, Friends!
We are targeting the 1.594 level area with our short trade on EUR/CAD which is based on the fact that the pair is overbought on the BB band scale and is also approaching a resistance line above thus going us a good entry option.
Disclosure: I am part of Trade Nation's Influencer program and receive a monthly fee for using their TradingView charts in my analysis.
✅LIKE AND COMMENT MY IDEAS✅
EURCAD trade ideas
Trade Recap CW27Quick and easy trade recap of my single position from last week with a cheesy little missed trade on EUR/CAD that should have been taken.

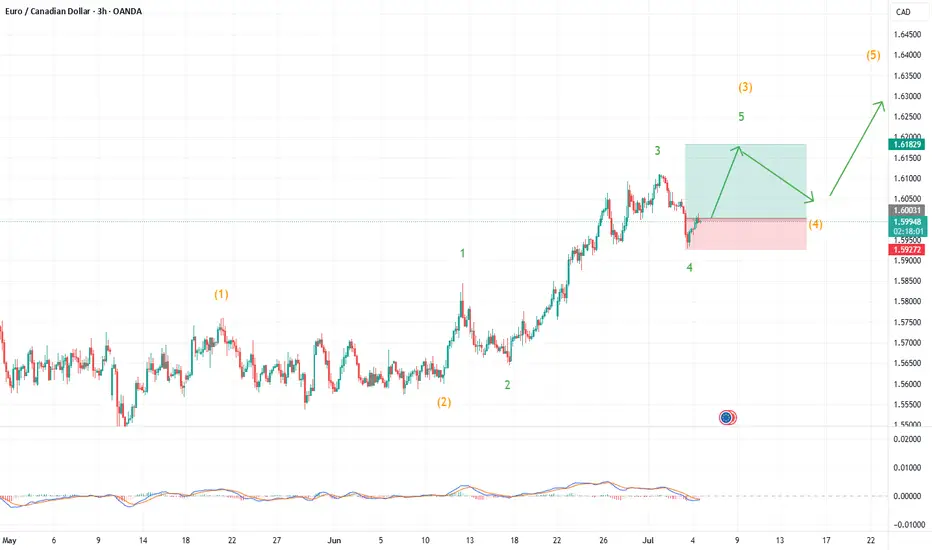
EUR/CAD: Wave 5 Trade SetupEUR/CAD is presenting a compelling long setup as what appears to be a five-wave impulse from the June lows looks ready for its final leg higher. The structure shows a classic wave 4 correction that has found support right where Elliott Wave theory suggests it should—setting up a potential wave 5 that could deliver solid risk-to-reward for patient traders.
What the Current Structure Shows (Primary Scenario)
Clean Five-Wave Impulse in Progress: The move up from the June 2025 lows has unfolded in a textbook impulsive pattern, with waves 1, 2, and 3 clearly defined and wave 4 appearing to have completed its correction.
Wave 4 Finds Support: The correction has retraced to a level that respects the typical boundaries for a fourth wave—not too deep to overlap with wave 1, but enough to provide a healthy pullback before the final push.
Wave 5 Setup: With wave 4 likely complete, the structure points to wave 5 beginning, targeting the equality relationship with wave 1 at 1.6170.
Why the Count Is Labeled This Way
The initial surge from the lows shows strong, impulsive characteristics with clear five-wave subdivisions.
Wave 3 extended beyond the typical 1.618 relationship with wave 1, which is common in strong trends.
The current level, at around 1.5927, represents a logical support zone where wave 4 should find its footing.
Trade Setup: Riding the Final Wave
Entry: Current levels, with wave 4 appearing to have bottomed.
Stop Loss: Below 1.5952—if price breaks this level, the wave count is invalidated and suggests wave 4 may be more complex or the entire structure needs reassessment.
Target: 1.6170, where wave 5 achieves equality with wave 1. This is a classic Elliott Wave projection when wave 3 has been the extended wave in the sequence.
What to Watch Next (Confirmation or Invalidation)
Confirmation: A break of the B wave termination point at 160.50 would be confirmation that wave 5 may have started.
Invalidation: A break below 1.5928 would suggest wave 4 is not complete and may be forming a more complex correction.
After Wave 5: Once the target is reached, expect a significant correction as the entire five-wave sequence from the June lows completes.
Alternate Count
If the current support fails, wave 4 could extend into a more complex correction—possibly a triangle or double zigzag—before wave 5 begins. This would delay but not necessarily invalidate the bullish scenario.
EUR CadHead and shoulders pattern? using yellow horizontal line as resistance hope it passes my ema and continue selling to my support line .
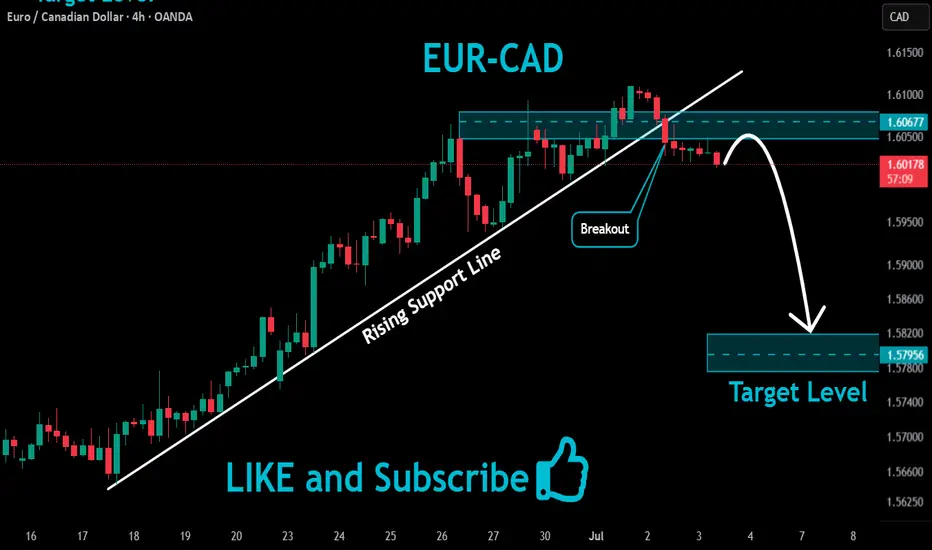
EURCAD Will Go Down!
HI,Traders !
EUR-CAD made a bearish
Breakout of the rising support
And is now consolidating
Below the line so we are
Bearish biased and we will
Be expecting a further
Bearish continuation !
Comment and subscribe to help us grow !
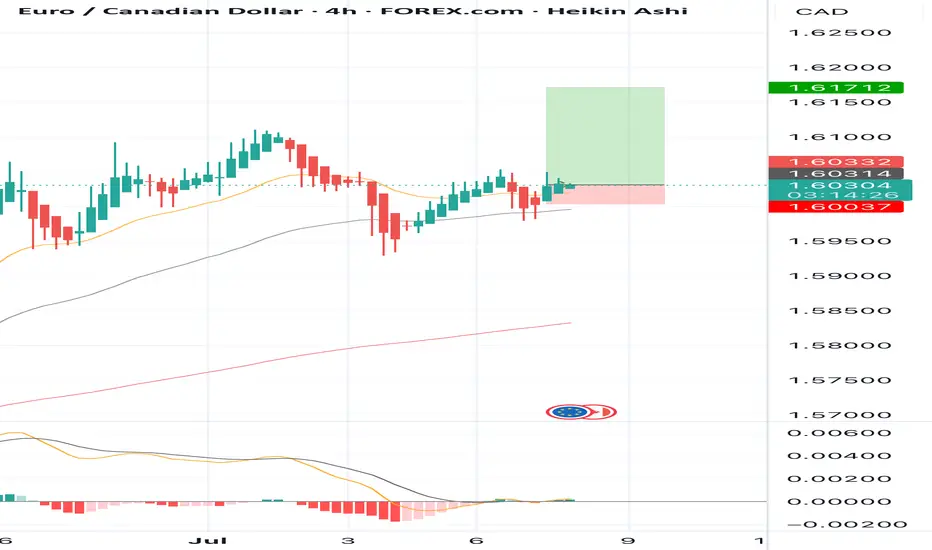
BUY EURCAD now for a four hour time frame bullish trend continuBUY EURCAD now for a four hour time frame bullish trend continuation ...............
STOP LOSS: 1.60037
This buy trade setup is based on hidden bullish divergence trend continuation trading pattern ...
Always remember, the trend is your friend, so whenever you can get a signal that the trend will continue, then good for you to be part of it
TAKE PROFIT : take profit will be when the trend comes to an end, feel from to send me a direct DM if you have any question about take profit or anything...
Remember to risk only what you are comfortable with... trading with the trend, patient and good risk management is the key to success here
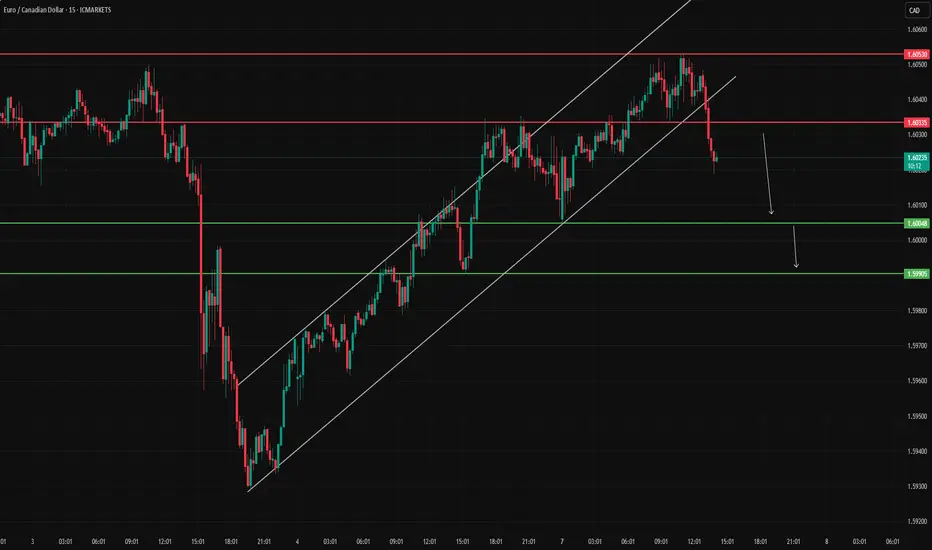
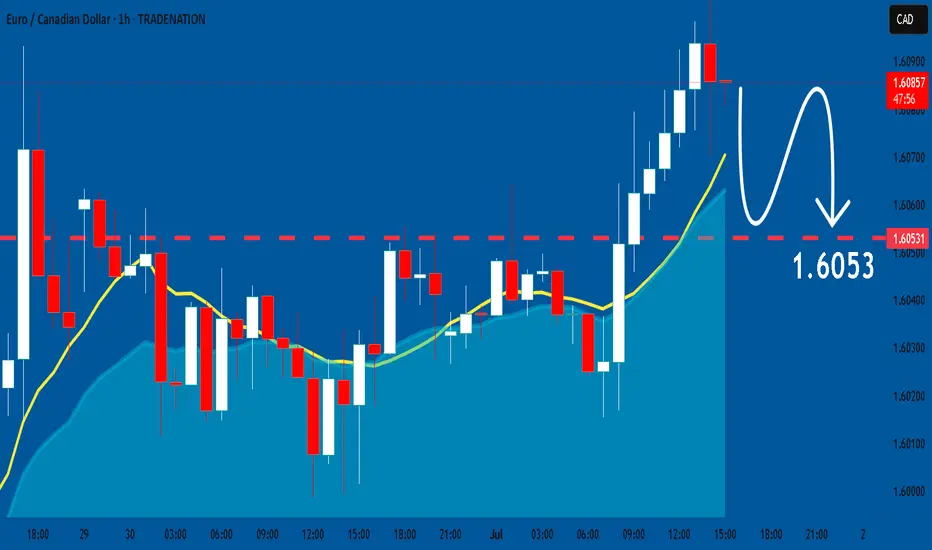
EURCAD has broken belowEURCAD has broken below the ascending channel, suggesting potential bearish continuation. The move targets 1.60048 and 1.59905, with a clear invalidation level set above 1.60530. We are monitoring for confirmation of bearish control unless bulls step in to push price back above the invalidation level.
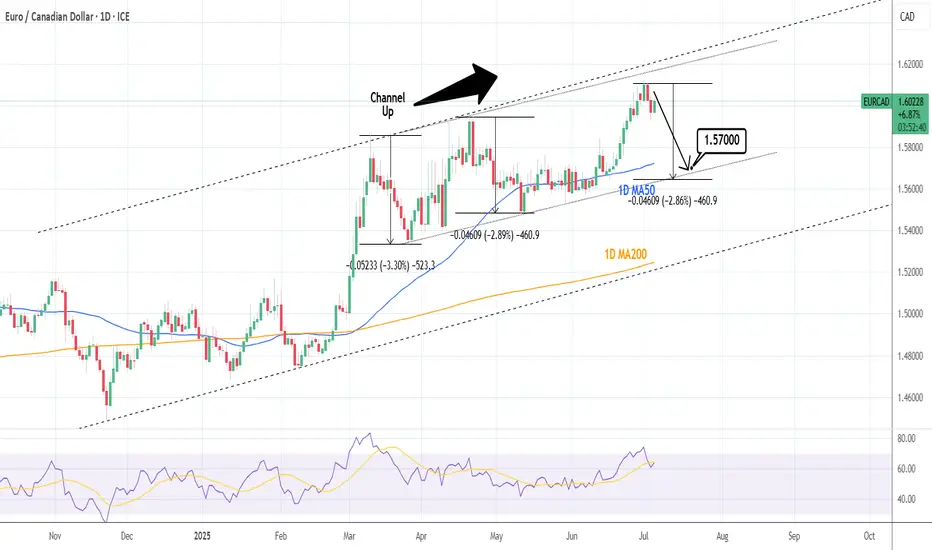
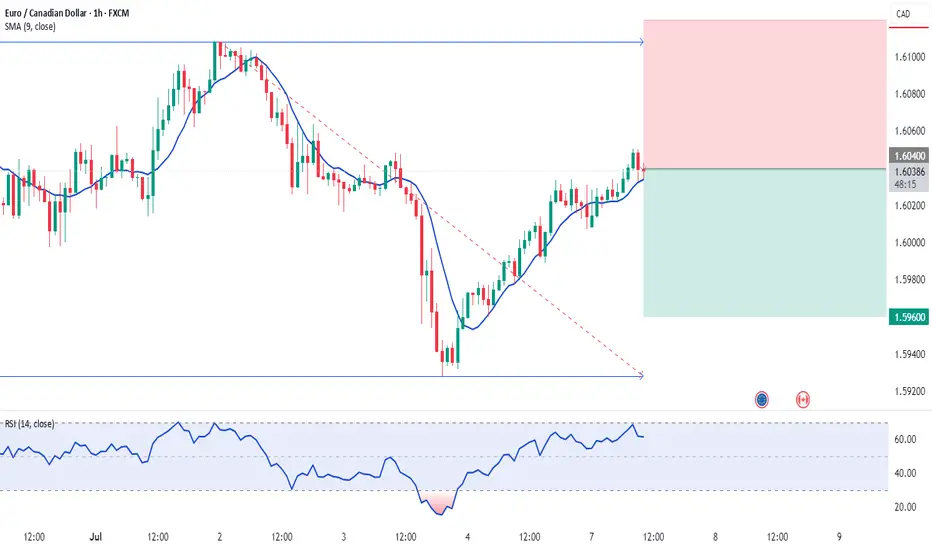
EURCAD: Sell signal on Double Channel Up Top.EURCAD is bullish on its 1D technical outlook (RSI = 63.955, MACD = 0.010, ADX = 41.562) having peaked on two Channel Up patterns at the same time. Technically it should now start the new bearish wave to test the bottom a little below the 1D MA50. Short, TP = 1.57000.
See how our prior idea has worked out:
## If you like our free content follow our profile to get more daily ideas. ##
## Comments and likes are greatly appreciated. ##
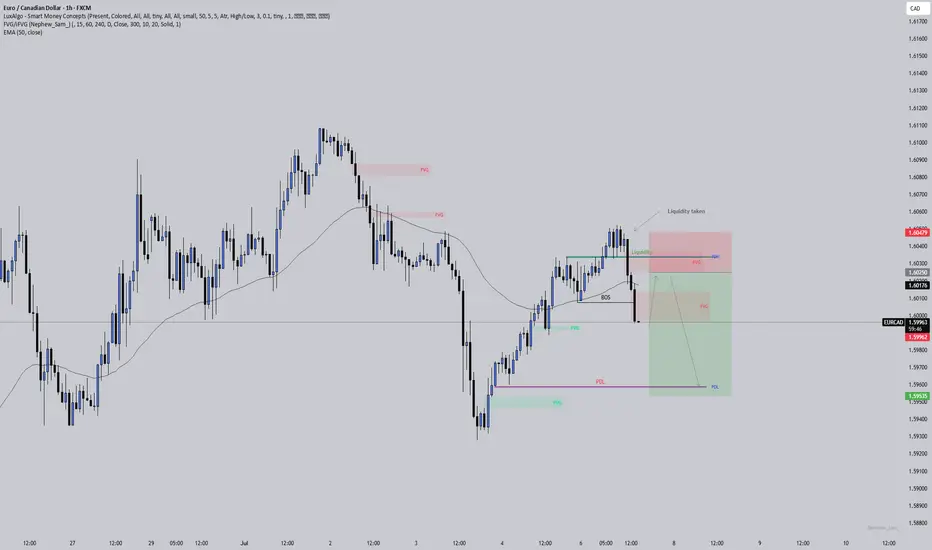
EURCAD: Liquidity taken, imbalance left behindPrice swept the liquidity above the previous day’s high and then broke structure to the downside. That’s often a sign that smart money was hunting stops before shifting direction. Now I’m watching for price to come back and fill the imbalance (FVG) it left after the break.
If that happens and price respects the FVG zone, we could see a continuation lower with the next target being the previous day’s low where more liquidity is likely sitting.
I’ve also added the 50 EMA here as confluence. It helps keep me trading in line with the broader market flow and stops me from fighting the trend.
This is one of those spots where patience is key . Let the market return to the zone on its own terms, wait for a reaction, and keep protecting your mindset just as carefully as your capital.
EURCAD Swing SellEURCAD will decline from this area observing this head and shoulders pattern. Price seems to be exhausted and may reverse anytime now
EURCAD: Expecting Bearish Continuation! Here is Why:
The recent price action on the EURCAD pair was keeping me on the fence, however, my bias is slowly but surely changing into the bearish one and I think we will see the price go down.
Disclosure: I am part of Trade Nation's Influencer program and receive a monthly fee for using their TradingView charts in my analysis.
❤️ Please, support our work with like & comment! ❤️
Lingrid | EURCAD April High - Key Resistance Level TestThe price perfectly fulfilled my last idea . FX:EURCAD is extending its bullish leg after breaking out of both a triangle pattern and the downward trendline. The pair reached the 1.59500 resistance area and is now hovering within a broad supply zone where previous reactions occurred. Unless bulls force a sustained breakout, the price may revisit the 1.58060 support for reaccumulation.
📈 Key Levels
Sell zone: 1.59500 - 1.59700
Sell trigger: breakdown below 1.59000
Target: 1.58060
Buy trigger: above 1.57500
💡 Risks
False breakout from resistance could trap late buyers
Extended move may prompt short-term profit-taking
Break below the upward trendline weakens bullish momentum
If this idea resonates with you or you have your own opinion, traders, hit the comments. I’m excited to read your thoughts!

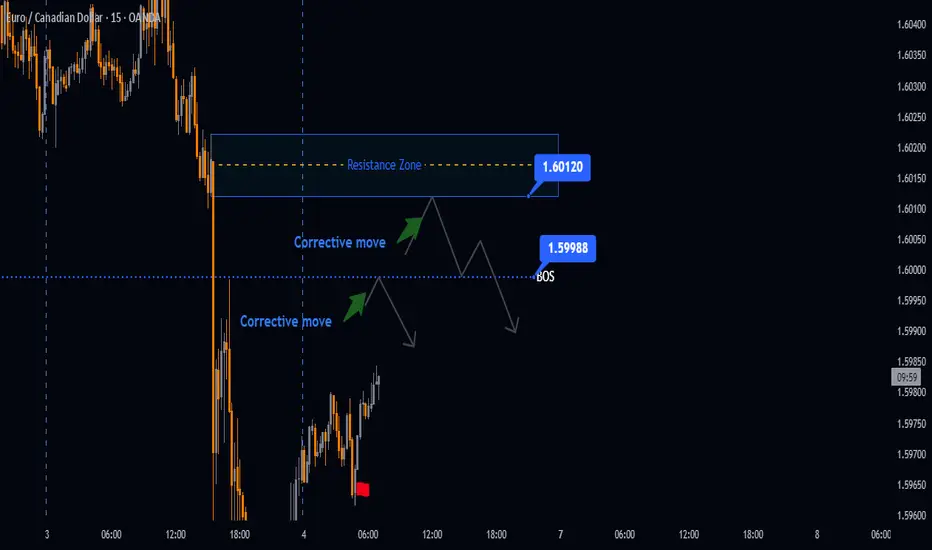
EURCAD Potential Short SetupsEURCAD dropped below 1.59988 with bears driving it towards 1.59292. If EURCAD holds below our resistance zone it would be ideal to have a bearish bias.
Sell Zone: 1.59988 - 1.60120
Target Levels: 1.59615 - 1.59292
LIKE or COMMENT if this idea sparks your interest, or share your thoughts below!
FOLLOW to keep up with fresh ideas.
Tidypips: "Keep It Clean, Trade Mean!"
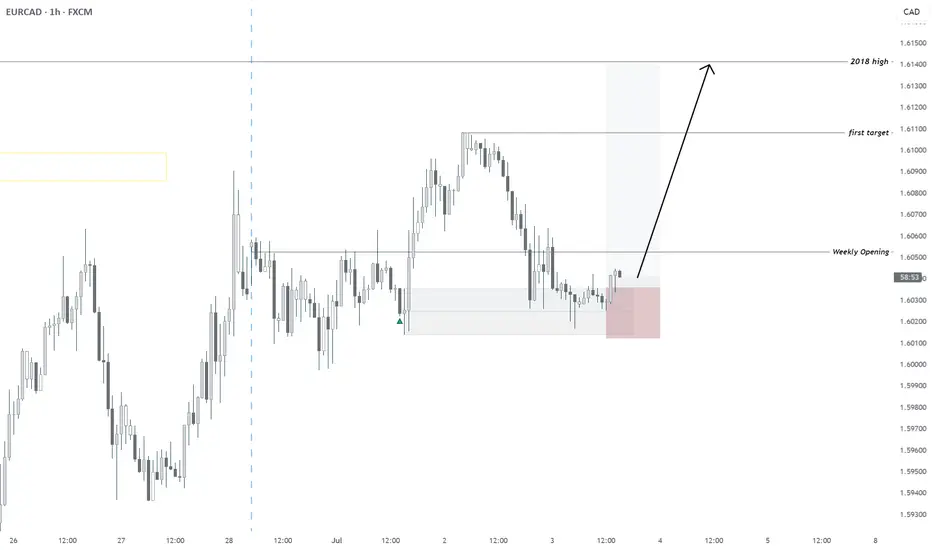
07/02/2025 | EURCAD | BULLISH - REACHING MULTI-YEAR HIGHDaily FX Outlook today:
All timeframes Bullish
Invalidation: 1.60055
First TP: on chart
Second: 2018 High
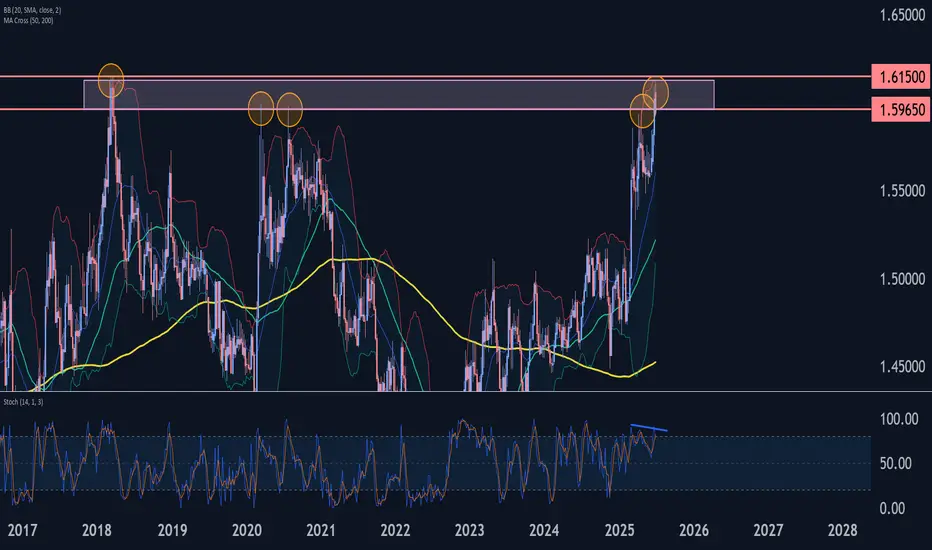
EURCAD Wave Analysis – 3 July 2025- EURCAD reversed from resistance zone
- Likely to fall to support level 1.5800
EURCAD currency pair recently reversed down from the major resistance zone located between the strong resistance level 1.6150 (former yearly high from 2018) and the resistance level 1.5965 (former Double Top from 2020).
The downward reversal from this resistance zone stopped the previous impulse waves 5 and (3).
Given the strength of the resistance level 1.6150 and the bearish divergence on the weekly Stochastic indicator, EURCAD currency pair can be expected to fall further to the next support level 1.5800.
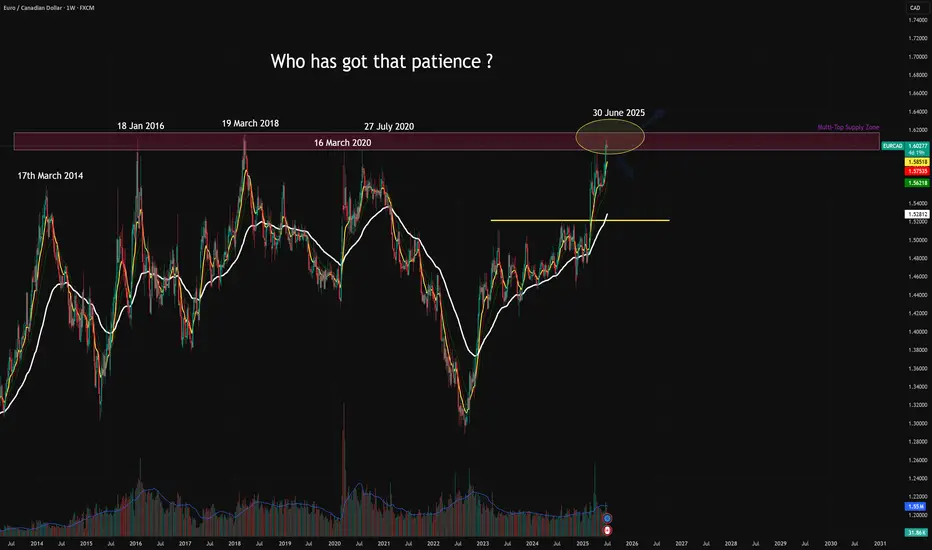
EURCAD – Over a Decade of Rejections Finally Breaking the Cycle?EURCAD is once again testing the legendary multi-year resistance between 1.60 and 1.6150, a zone that has caused at least 5 major rejections since 2014. Each of those led to significant drawdowns — yet this time, price is pressing deeper into it, potentially signaling a macro regime shift if bulls follow through.
Key Technical Observations
Timeframe: 1W
“Multi-Year Supply Zone” or “Overhead Resistance Zone”: 1.60 – 1.6150
Historical Reaction Dates:
🔸 17 Mar 2014
🔸 18 Jan 2016
🔸 19 Mar 2018
🔸 16 Mar 2020
🔸 27 Jul 2020
Current Candle (30 Jun 2025):
Pierced the zone briefly — now hovering just inside
Volume: Noticeable uptick in the last few weeks — interest is real
Structure Below: Strong accumulation base breakout around 1.5280, serving as major support now
TLDR
EURCAD is testing a monster historical supply zone (1.60–1.6150) for the 6th time in 11 years. This could be the breakout that changes the macro trend, but without confirmation, it's still a zone to respect.
Disclaimer
This is for educational purposes only. Not financial advice.
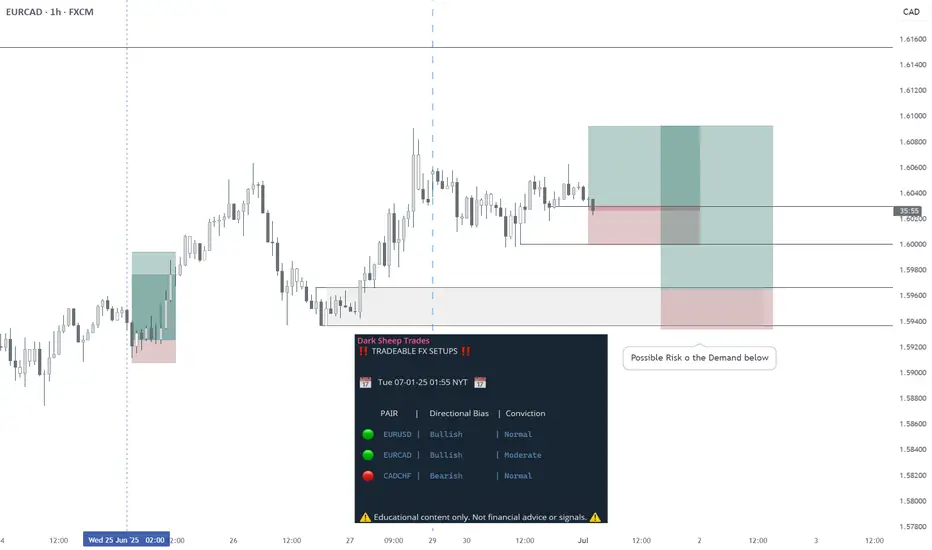
EURCAD - LONG - Statistically-backed FX shortlistEURCAD - LONG
Daily Outlook: Statistically-backed FX shortlist
@darksheeptrades
How a Triple Breakout and Daily Reversal Signal Point to a 25%..How a Triple Breakout and Daily Reversal Signal Point to a 25% Bullish Opportunity on EURCAD
Introduction
A strong bullish signal has formed on the EURCAD currency pair, capturing the attention of traders using a combination of
breakout confirmation and daily chart reversal signals. With a clear confluence across the 4-hour, daily, and weekly timeframes,
this technical setup offers a well-supported case for a buy position with an estimated 25% upside, targeting the 1.6100 level.
Whether traded intraday or held for a few days, the structure of this trade offers exceptional technical clarity and reward
potential.
✅ Key Technical Highlights
🔹 4-Hour Breakout Confirmation
The EURCAD pair has broken decisively above a recent range high on the 4-hour chart. This breakout occurred on increased volume,
which validates the move as more than a false spike. Price action shows bullish momentum building as candles close strongly above
the 50-period EMA, indicating short-term strength.
🔹 Weekly Chart Breakout Structure
Zooming out, the weekly chart reveals that EURCAD has cleanly broken through a key resistance zone, which had previously
capped price several times. The breakout aligns with the long-term trend shift, reinforcing the bullish narrative from a macro
perspective. Support now sits firmly below at previous resistance.
🔹 Daily Chart Reversal Signal
The daily chart offers the most critical insight: a strong reversal pattern, potentially a bullish engulfing or morning star, has
formed near the breakout area. This suggests a change in sentiment and invites buying pressure as traders react to the clear
reversal signal after a recent pullback. This reversal provides
timing precision for the trade.
🎯 Take-Profit and Target Projection
The price target is placed at 1.6100, which corresponds to:
A previous structural high
A Fibonacci extension zone
A round psychological number respected historically
The move to this level offers a potential 25% profit window, depending on entry price and lot size. This makes it attractive for both day traders and short-term swing traders.
🕒 Trade Duration Outlook
While this breakout setup is forming across the weekly and daily charts, the 4-hour entry makes it highly suitable for day trading.
Traders who prefer intraday execution can look for a pullback to breakout support for entry, followed by momentum confirmation
from RSI or volume spikes.
Swing traders may hold the position over several days, aiming for the full stretch to the 1.6100 target, while trailing stops to lock in profits.
⚠️ Risk and News Awareness
Traders must remain cautious of:
Oil price movements, which directly impact CAD strength
Economic data from the Eurozone or Canada (GDP, employment, interest rate updates)
Central bank speeches that may introduce volatility
Risk should be limited by placing stop-loss orders just below the 4-hour breakout level or the low of the daily reversal candle.
📌 Why This EURCAD Setup Matters
This setup is more than just a breakout—it combines:
Multi-timeframe confirmation
Momentum breakout on the 4-hour chart
Weekly structure validation
Daily chart reversal timing
These factors build a strong technical case for bullish continuation and provide high confidence for experienced and new traders alike.
Conclusion
EURCAD presents a powerful trading opportunity backed by clear technical signals across major timeframes. With a 25% upside and
precise entry timing from a daily reversal pattern, this is the kind of setup traders seek for both fast profits and well-structured
trades. Whether approached as a day trade or a swing play, the EURCAD breakout is one to watch.
Disclaimer: This content is for educational and informational purposes only. It does not constitute financial advice or a
recommendation to buy or sell any financial instrument. Use a simulation trading account before you trade with real money and learn risk management and profit taking strategies.
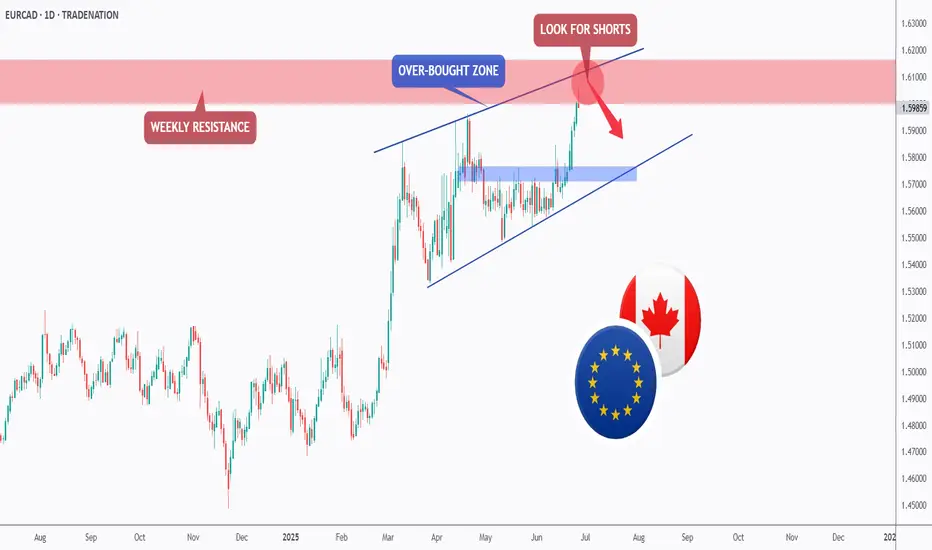
EURCAD - Weekly Resistance Might Shift The Momentum!Hello TradingView Family / Fellow Traders. This is Richard, also known as theSignalyst.
📈EURCAD has been overall bullish trading within the rising channel marked in blue. However, it is currently approaching the upper bound of the channel.
Moreover, the red zone is a strong weekly resistance.
🏹 Thus, the highlighted red circle is a strong area to look for sell setups as it is the intersection of the upper blue trendline and resistance.
📚 As per my trading style:
As #EURCAD approaches the red circle zone, I will be looking for bearish reversal setups (like a double top pattern, trendline break , and so on...)
📚 Always follow your trading plan regarding entry, risk management, and trade management.
Good luck!
All Strategies Are Good; If Managed Properly!
~Rich
Disclosure: I am part of Trade Nation's Influencer program and receive a monthly fee for using their TradingView charts in my analysis.
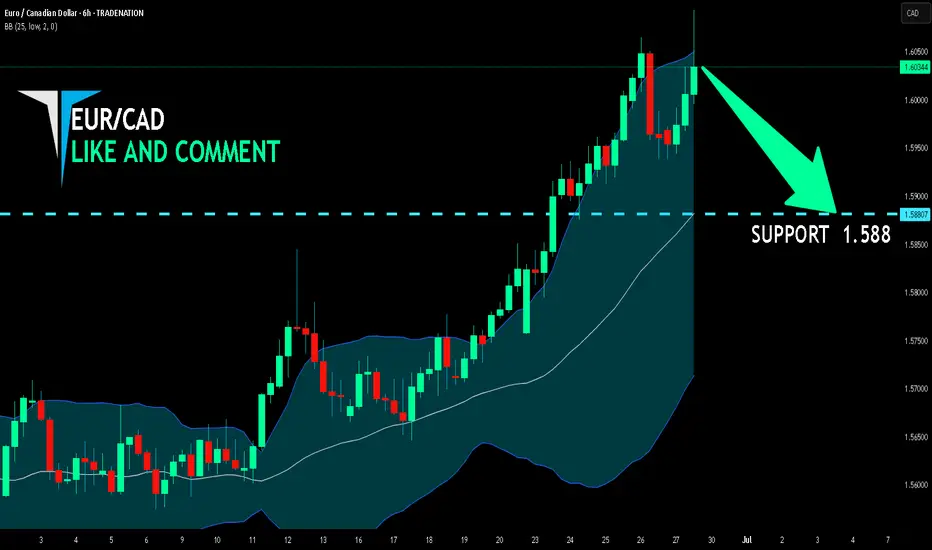
EUR/CAD BEARS ARE STRONG HERE|SHORT
Hello, Friends!
We are now examining the EUR/CAD pair and we can see that the pair is going up locally while also being in a uptrend on the 1W TF. But there is also a powerful signal from the BB upper band being nearby, indicating that the pair is overbought so we can go short from the resistance line above and a target at 1.588 level.
Disclosure: I am part of Trade Nation's Influencer program and receive a monthly fee for using their TradingView charts in my analysis.
✅LIKE AND COMMENT MY IDEAS✅
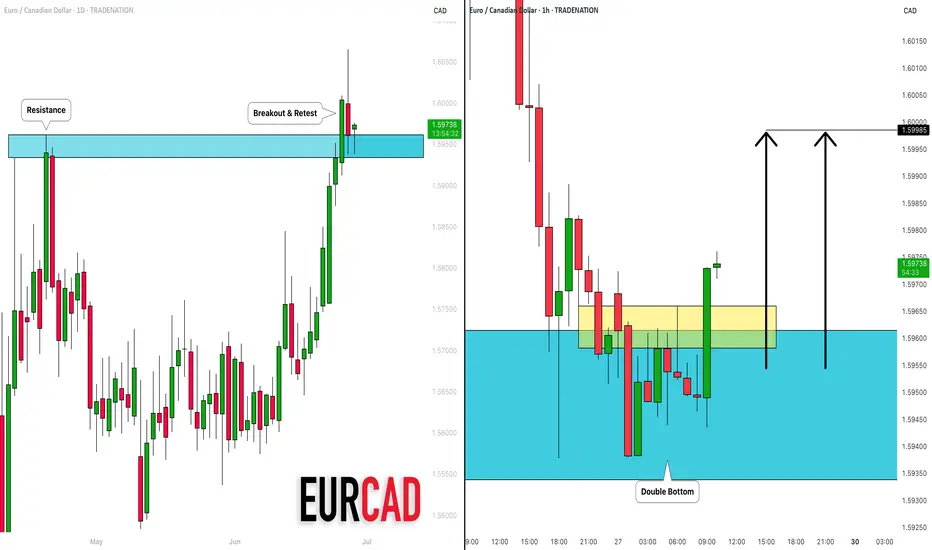
EURCAD: Pullback Trade From Support 🇪🇺🇨🇦
EURCAD is going to bounce from a recently broken
key daily horizontal resistance that turned into support after a violation.
The price violated a neckline of a double bottom pattern with
a bullish imbalance candle on an hourly time frame as a confirmation.
Goal - 1.5998
I am part of Trade Nation's Influencer program and receive a monthly fee for using their TradingView charts in my analysis.
26.06.25 Morning ForecastPairs on Watch -
FX:EURUSD
FX:EURCAD
FX:GBPCAD
A short overview of the instruments I am looking at for today, multi-timeframe analysis down to what I will be looking at for an entry. Enjoy!
