EUR/CAD – 93% Traders Are SHORT! Bearish Reversal Brewing?The EUR/CAD pair is currently in a bullish trend, but multiple technical and sentiment signals are pointing toward a possible trend reversal.
🔍 Key Observations:
Trend: Bullish (but losing momentum)
Bearish Divergence: Price making higher highs while RSI indicators show lower highs.
Pattern: Rising Wedge – a classic bearish reversal formation.
Harmonic Analysis: AB=CD pattern is approaching the potential reversal zone (PRZ).
EMA Insight: Price candles have moved across the 20 EMA and 50 EMA, signaling weakening bullish momentum.
Sentiment (Myfxbook.com): 93% of traders are currently short on EUR/CAD — strong crowd bias toward the downside.
📌 Trade Setup:
Bias: Bearish
Strategy: Sell Stop at breakout of previous Higher Low (HL)
Entry Price (EP): Sell Stop @ 1.59755
Stop Loss (SL): 1.60626
Take Profit 1 (TP1): 1.58884 (R:R = 1:1)
Take Profit 2 (TP2): 1.58013 (R:R = 1:2)
Lot Size: 0.15
Risk: $200 | Potential Reward: $200–$300
💡 Trade Execution Plan:
We will enter only after HL breakout confirmation to avoid false moves. This setup aligns Rising Wedge pattern, Bearish Divergence, EMA cross weakness, Harmonic PRZ zone, and bearish sentiment — a powerful confluence for a potential downside move.
📊 Technical Summary:
Combining price action, chart patterns, harmonics, momentum, and trader sentiment gives this short setup high probability.
📢 Your Turn:
What’s your take on this trade? Will the market follow the 93% bearish sentiment, or could this be a trap?
💬 Drop your analysis in the comments, let’s discuss!
👍 Like, 🔁 Share, and Follow for more trade setups & technical breakdowns.
#EURCAD #Forex #ForexTrading #BearishReversal #PriceAction #HarmonicPatterns #TechnicalAnalysis #EMA #Divergence #TradingView #ChartPatterns #SwingTrading #ForexSetups #ABCDPattern #PriceActionTrading #ForexSignals #RisingWedge #1HRTimeFrame #ForexLife #DayTrading #MarketSentiment #Myfxbook
EURCAD trade ideas

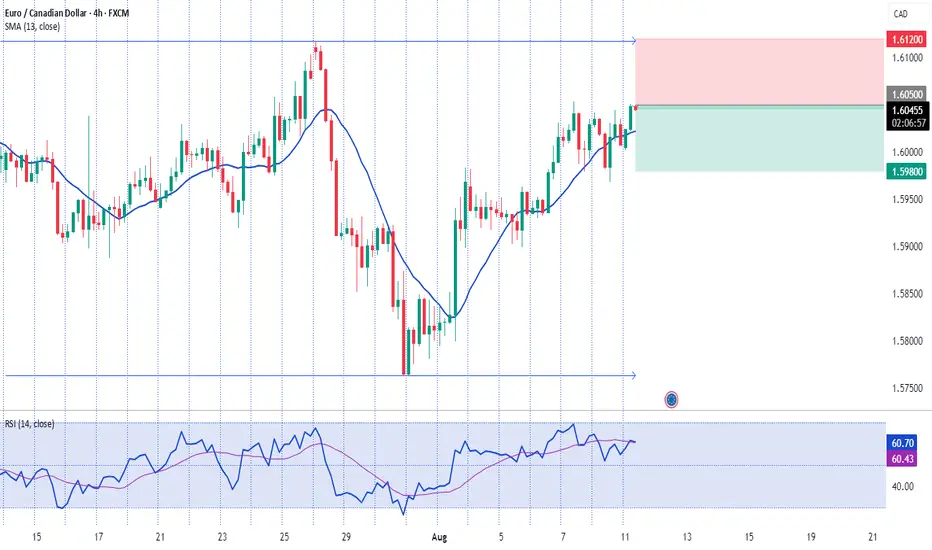
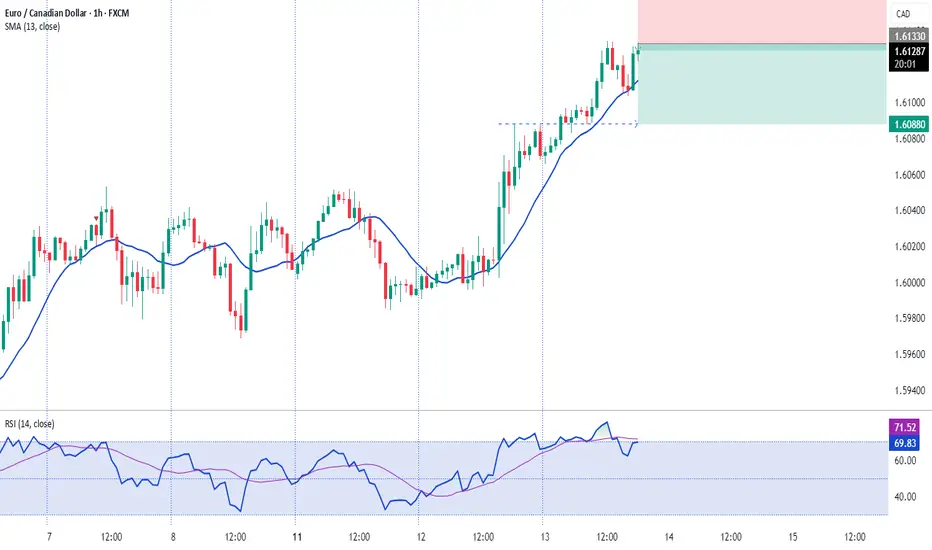
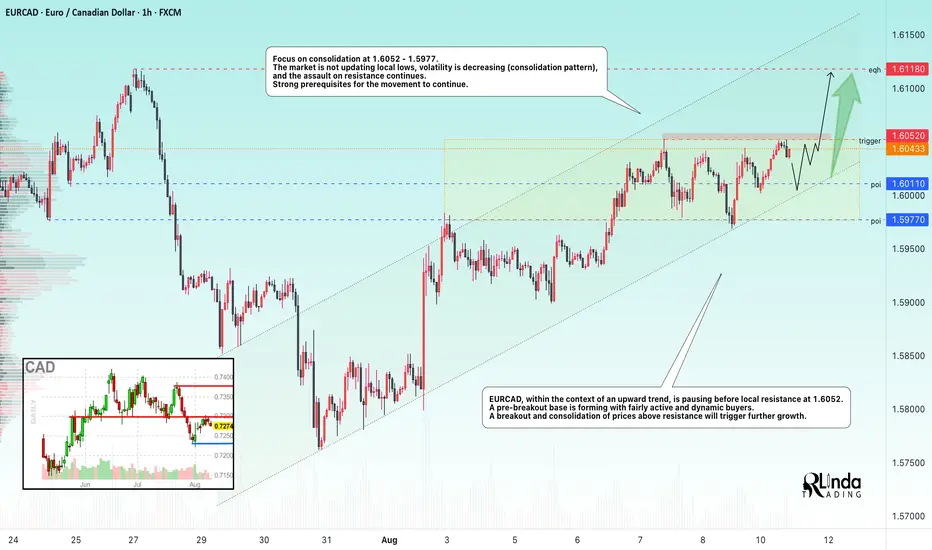
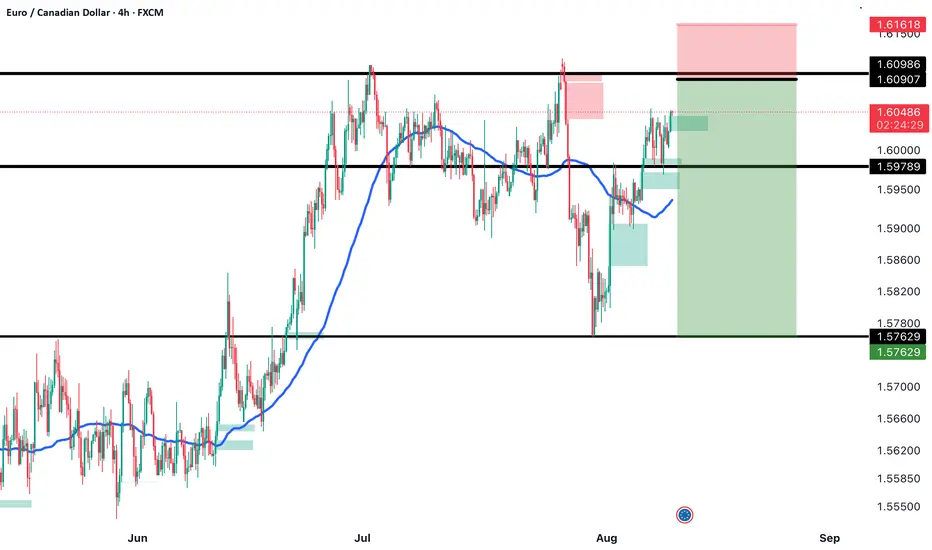
EURCAD → Consolidation above the mirror level...FX:EURCAD continues its global bullish trend. Locally, within the upward movement, we see a pause, but the nature of this pause is not aimed at a reversal, but at consolidation before growth.
EURCAD, within the upward trend, is pausing before local resistance at 1.6052. A pre-breakout base is forming with fairly active and dynamic buyers. A breakout and consolidation of prices above resistance will trigger further growth.
Focus on consolidation at 1.6052 - 1.5977. The market is not updating local lows, volatility is decreasing (consolidation pattern) and the assault on resistance continues. Strong prerequisites for the movement to continue
Support levels: 1.6011, 1.5977
Resistance levels: 1.6052, 1.6118
A smooth approach to resistance, a breakout and consolidation above the key level (trigger) could trigger further growth within the global and local bullish trend.
Best regards, R. Linda!
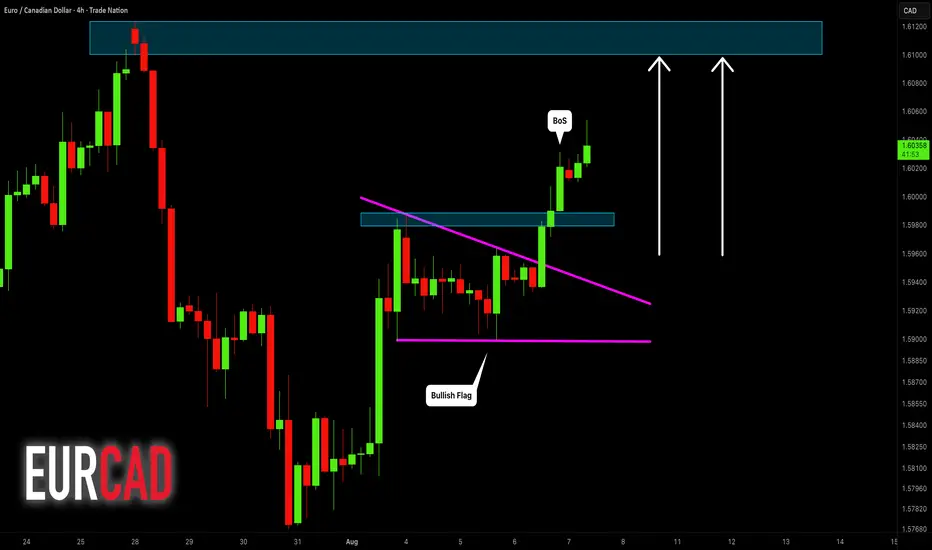
EURCAD: More Growth Ahead 🇪🇺🇨🇦
EURCAD broke a resistance line of a bullish flag pattern yesterday.
A consequent confirmed Break of Structure BoS indicates
that the rise will most likely continue.
The next strong resistance is 1.61.
The market is going to reach that soon.
❤️Please, support my work with like, thank you!❤️
I am part of Trade Nation's Influencer program and receive a monthly fee for using their TradingView charts in my analysis.
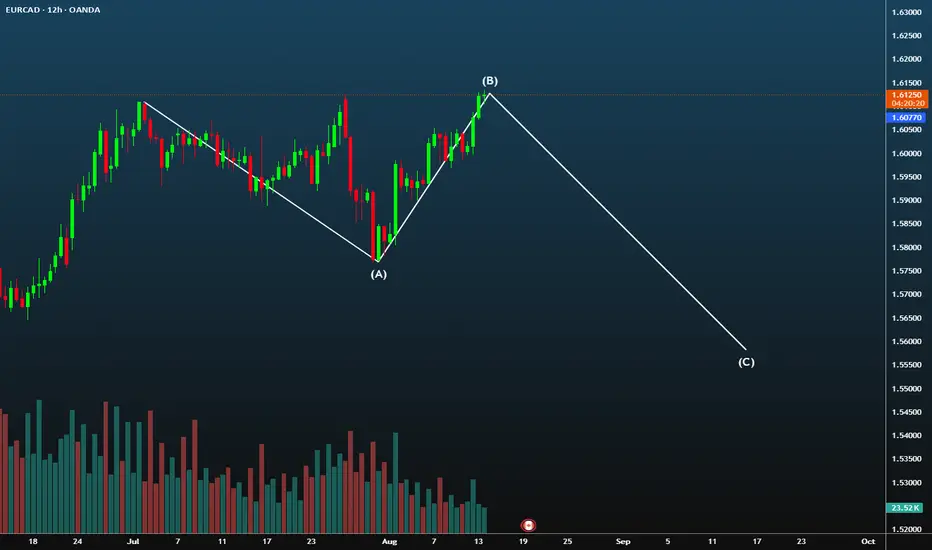
EURCAD SHORT ✅ Why This Could Be the Next Move
1. Wave Structure Integrity
- If the current price action shows a completed Wave A (impulsive down) and Wave B (corrective up), then Wave C is likely next.
- Wave C typically mirrors Wave A in length and momentum — a classic zigzag.
2. Market Context
- If EURCAD recently hit resistance near 1.68–1.69 and failed to break higher, that’s a textbook B-wave top.
- The current price at 1.67736 suggests it’s hovering near the B peak — ripe for reversal.
3. Momentum Divergence
- If MACD or RSI shows bearish divergence at B, it signals weakening bullish momentum — a precursor to Wave C.
- Your MACD Tango logic could confirm this with a fading histogram and apex crossover.
4. Fibonacci Confluence
- If Wave B retraced ~61.8% of Wave A, and price is now rejecting that level, it’s a strong signal.
- You can project Wave C using the 100% or 127.2% extension of Wave A from B — a common Elliott target.
5. Volume & Volatility
- If volume peaked during Wave A and faded in Wave B, it supports the corrective nature of B.
- A sudden spike in volatility (ATR or candle % filter) could mark the start of Wave C.
🔧 How to Trade It (If Confirmed)
- Entry: Below B with confirmation (e.g., bearish engulfing or MACD crossover).
- Stop Loss: Above B, buffered by ATR.
- Take Profit: Projected C target — ideally near 1.6650 or lower, depending on Wave A length.
EURCAD selling Opportunity.Looking @ the current market structure of SAXO:EURCAD , The price is trying telling a very sweet stories, so i have tried packaging the info that i was able to come up with while making my analysis, which i have already shared on this video Combining both daily, H4 and H2 Timeframe to make up this trade ideas. All the best.

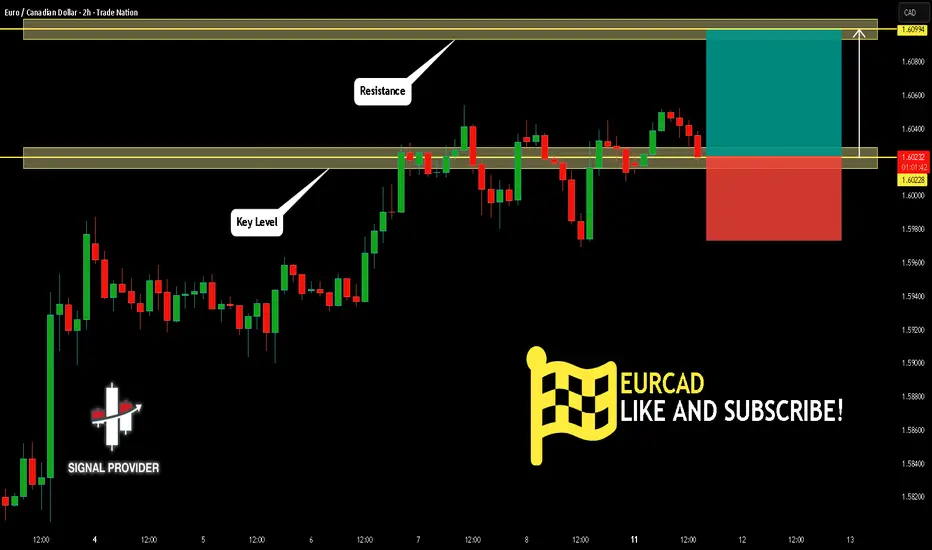
EURCAD Will Grow! Long!
Please, check our technical outlook for EURCAD.
Time Frame: 2h
Current Trend: Bullish
Sentiment: Oversold (based on 7-period RSI)
Forecast: Bullish
The market is trading around a solid horizontal structure 1.602.
The above observations make me that the market will inevitably achieve 1.609 level.
P.S
Please, note that an oversold/overbought condition can last for a long time, and therefore being oversold/overbought doesn't mean a price rally will come soon, or at all.
Disclosure: I am part of Trade Nation's Influencer program and receive a monthly fee for using their TradingView charts in my analysis.
Like and subscribe and comment my ideas if you enjoy them!
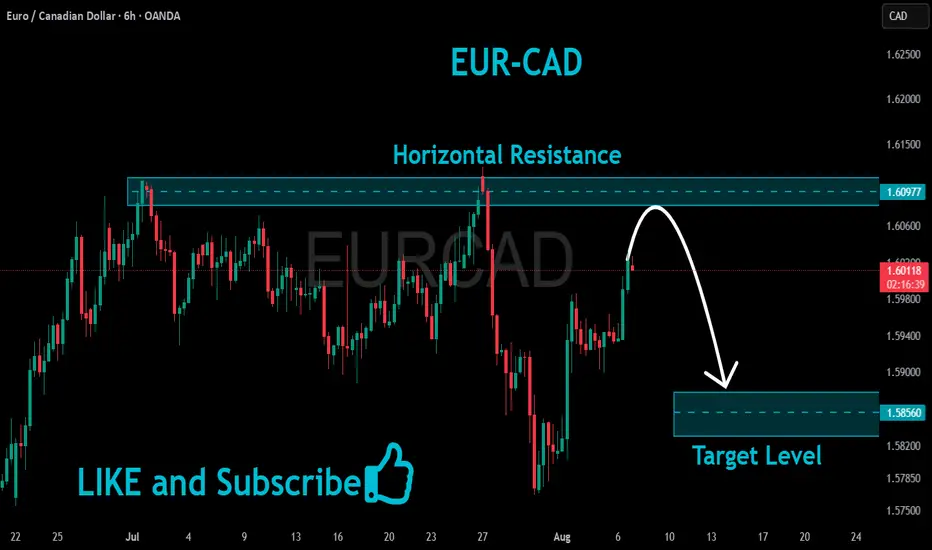
EUR/CAD is falling.What I see in EUR/CAD across multiple timeframes confirms that a bearish trend has begun.
Therefore, I have entered a sell position from the marked zone.
The target is the specified area, with an expected drop of approximately 3.5% or around 530 pips.

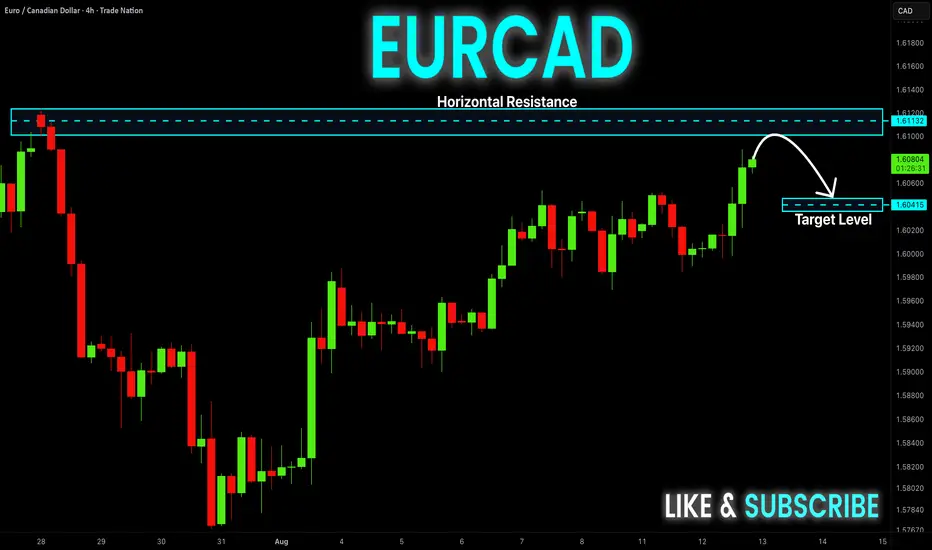
EUR-CAD Resistance Ahead! Sell!
Hello,Traders!
EUR-CAD keeps going up
But the pair will retest a
Horizontal resistance
Of 1.6124 and from there
A local bearish correction
Is to be expected
Sell!
Comment and subscribe to help us grow!
Check out other forecasts below too!
Disclosure: I am part of Trade Nation's Influencer program and receive a monthly fee for using their TradingView charts in my analysis.
EURCAD Is Overbought!
HI,Traders !
#EURCAD is trading in a
Strong uptrend and the pair
Will soon hit a horizontal
Resistance of 149.200
So after the retest a
Local bearish pullback
Is to be expected !
Comment and subscribe to help us grow !
Sell eurcadBig drop expected in this month
Monthly strong selling area reached
Monthly overbought indicators
We expecting the weakening of Euro in all cross pairs
EURCADRSI Bearish Divergence: The Relative Strength Index (RSI) indicates a Bearish divergence.
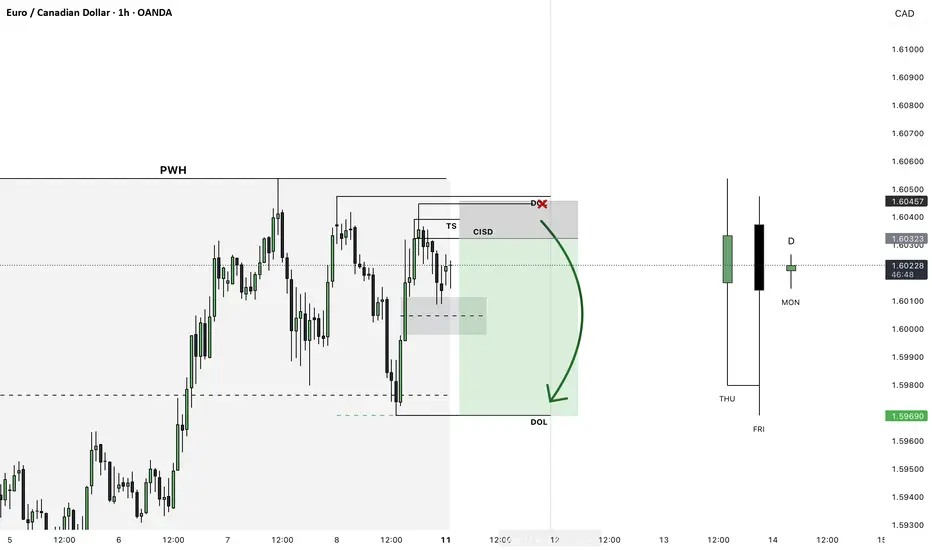
EURCAD has broken the previous Higher Low (HL) level, shifting the market structure from bullish to bearish.
Price is now printing a new Lower Low (LL), confirming a possible downtrend continuation.

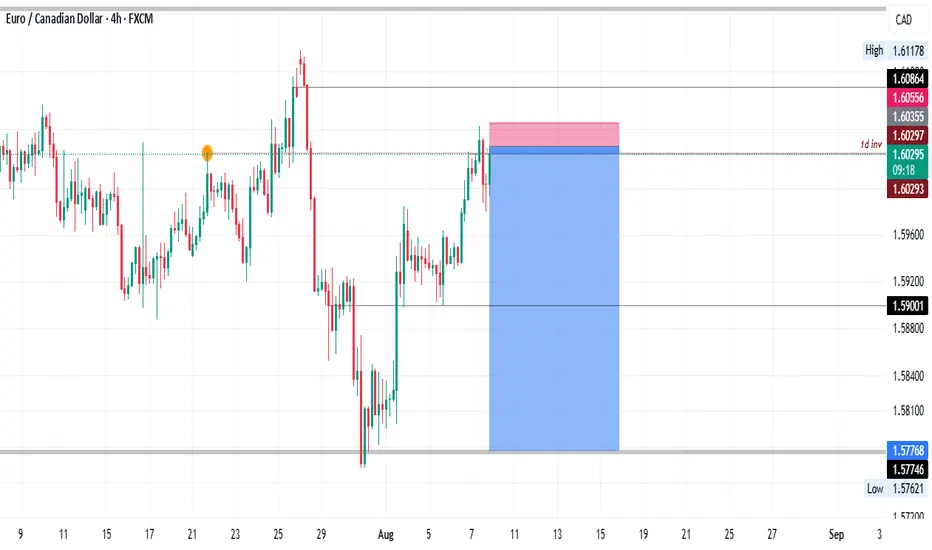
EURCAD Selling Trade Zone setup; 1.60475-1.6060EURCAD Selling Zone; 1.60475-1.6060
Stop Loss: 1.61330
Take Profit: 1.59700
Take Profit: 1.57700
*Note: Use 1% risk on trade as per your trading plan.
EURCAD, We should have waited for confirmation.EURCAD re entry, is bullish in higher time frames.
In the daily timeframe it is bearish due to a higher time frame retracement.
Our entry is a low risk (20 Pips) with our targets eyeing a 1:10.
DISCAIMER: This is not a financial advice, trade with caution.

EURCAD: Another Bullish Confirmation?! 🇪🇺🇨🇦
Earlier last week, I already shared my bullish outlook for EURCAD
and a highly probable bullish continuation to 1.61.
I see another bullish confirmation today - a confirmed breakout
of a falling trend line on a 4H.
I guest that the pair will continue rising soon.
❤️Please, support my work with like, thank you!❤️
I am part of Trade Nation's Influencer program and receive a monthly fee for using their TradingView charts in my analysis.

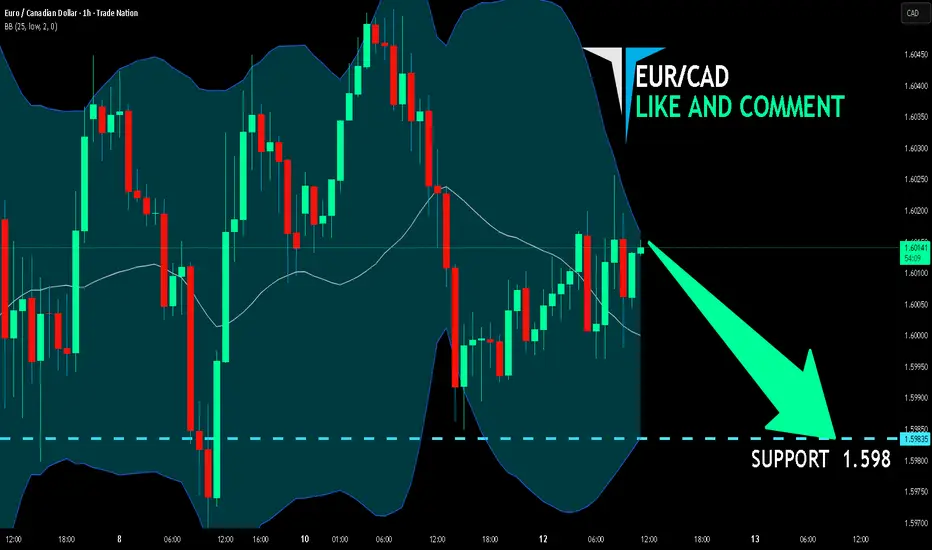
EUR/CAD BEARS ARE STRONG HERE|SHORT
Hello, Friends!
Previous week’s green candle means that for us the EUR/CAD pair is in the uptrend. And the current movement leg was also up but the resistance line will be hit soon and upper BB band proximity will signal an overbought condition so we will go for a counter-trend short trade with the target being at 1.598.
Disclosure: I am part of Trade Nation's Influencer program and receive a monthly fee for using their TradingView charts in my analysis.
✅LIKE AND COMMENT MY IDEAS✅
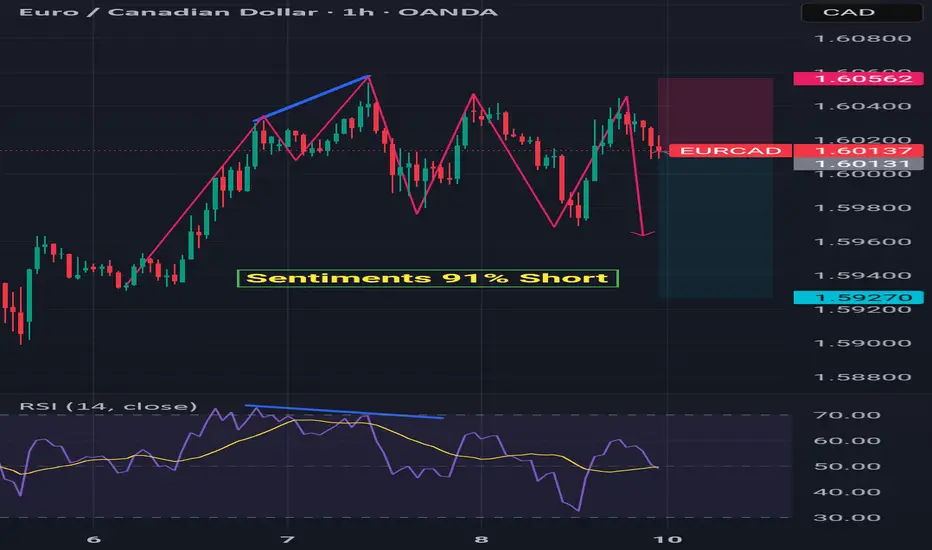
EURCAD SHORTSentiments are short about 91%
After Bearish Divergence it is making LL LH's already.
Taking instant sell
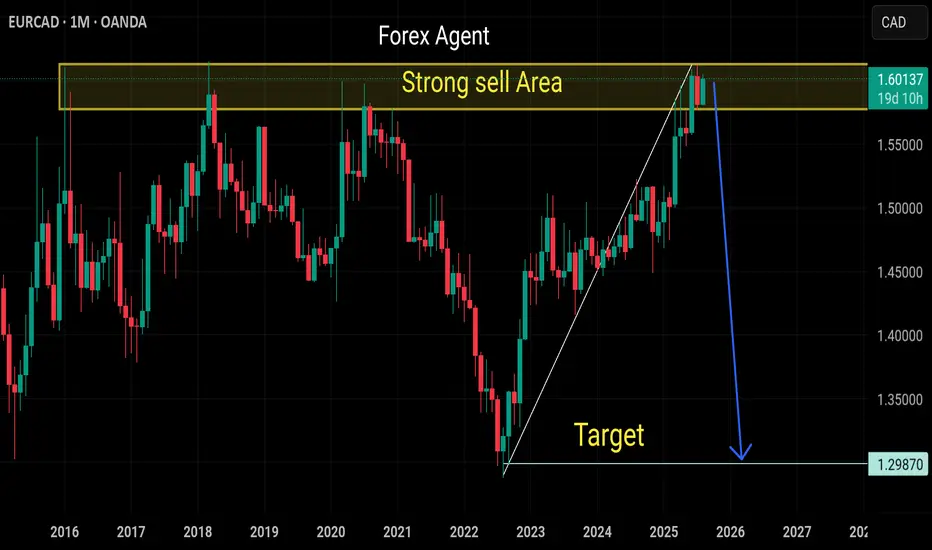
EurCad long term shortPatience in key in trading forex. A prime example of the EC pair where prices should rally to the upside to tap into the supply OB before shorting to the downside.

EURCAD SWING: SHORT-TERM SHORT OPPORTUNITYHi there,
Been a while... I was motivated resume sharing my trade ideas by a follower turned Pal (Shloydo). I say this to say - I'd be sharing my thoughts on price more often.
After running equal highs on the monthly chart, price created a MSS and I'd like to see a short-term bearish movement in price.
Once price trades into the highlighted key level (which aligns with the quarterly open price), I'd be looking for a setup to go short.
You could add this to the pairs on your radar.
Cheers,
Jabari