MORNING FORECASTING LESSONSIt's important to recognise that the position of our trades is just as critical as the entry point. We need to clearly understand how to get involved and have a solid grasp of our trade setups. of our trade setups!
EURCAD trade ideas

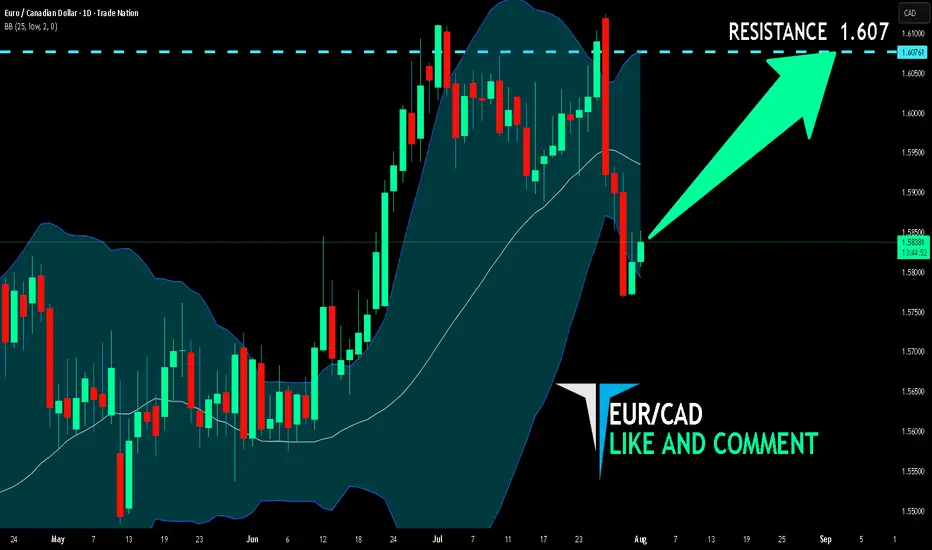
EUR/CAD BUYERS WILL DOMINATE THE MARKET|LONG
Hello, Friends!
We are going long on the EUR/CAD with the target of 1.607 level, because the pair is oversold and will soon hit the support line below. We deduced the oversold condition from the price being near to the lower BB band. However, we should use low risk here because the 1W TF is red and gives us a counter-signal.
Disclosure: I am part of Trade Nation's Influencer program and receive a monthly fee for using their TradingView charts in my analysis.
✅LIKE AND COMMENT MY IDEAS✅
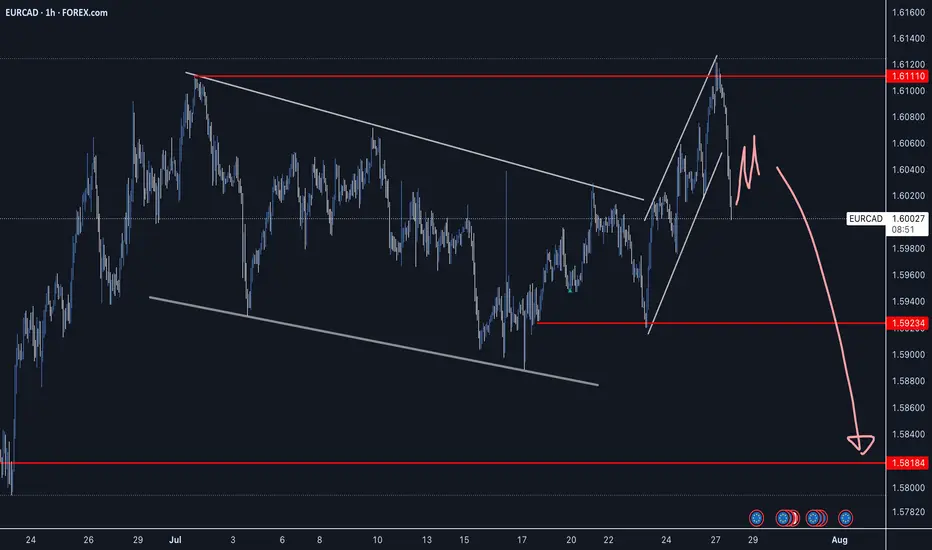
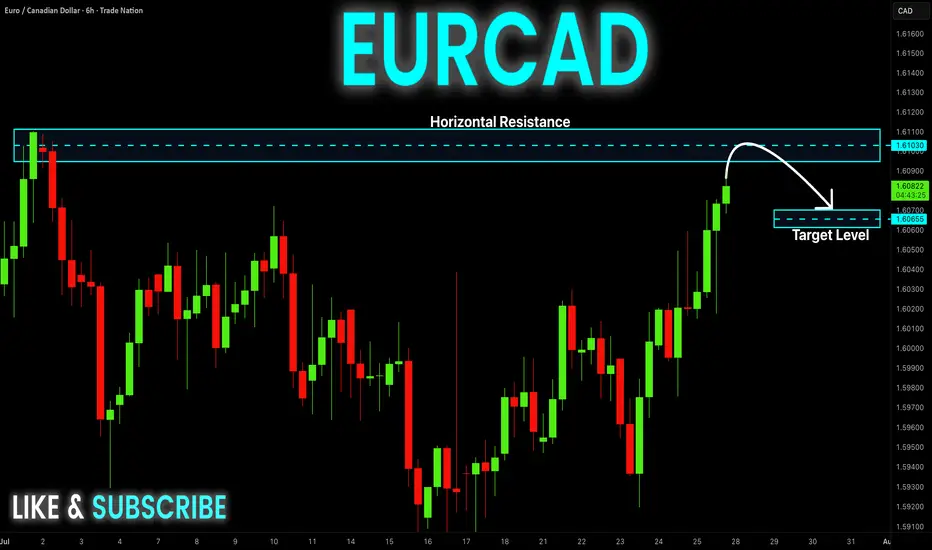
HEAD & SHOULDER PATTERN SPOTTED IN EUR/CADHEAD & SHOULDER PATTERN SPOTTED IN EUR/CAD.
Price is expected to remain bearish in upcoming trading sessions.
On higher side 1.61100 level may act as a key resistance level.
On lower side market may hit the target of 1.58150.

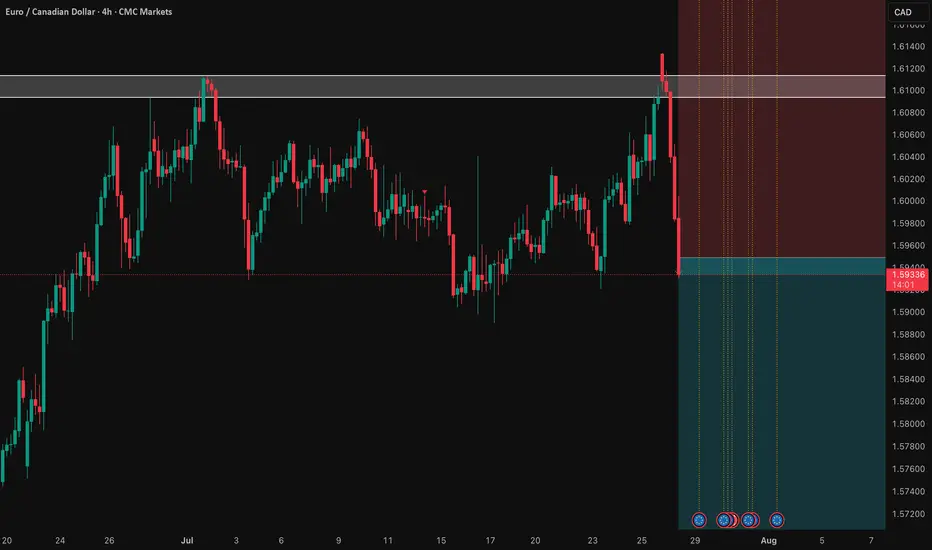
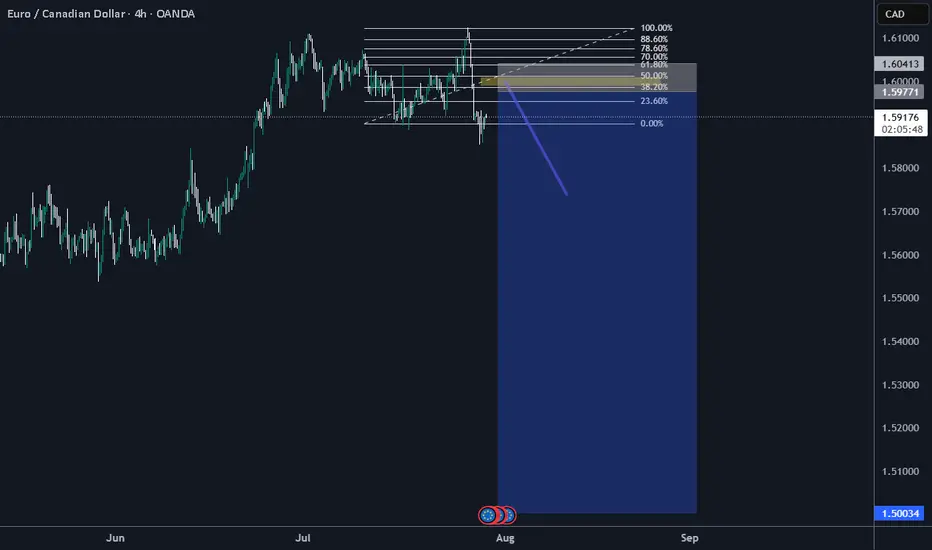
EUR/CAD: Shorting the Climactic Rally Near 1.6000The strong rally in EUR/CAD has pushed the pair into extreme territory, approaching a major psychological and structural resistance zone. While momentum has been strong, this looks like a potential climactic or "blow-off" top, offering a highly favorable risk/reward opportunity to short the pair in alignment with the weak underlying Euro fundamentals.
The Fundamental Why 📰
The core thesis remains bearish for the Euro. The European Central Bank (ECB) maintains a distinctly dovish tone, signaling a willingness to ease policy further to support a slowing Eurozone economy. This fundamental headwind suggests that extreme rallies in Euro pairs are often exhaustive and present prime shorting opportunities.
The Technical Picture 📊
Major Supply Zone: The price is entering a critical multi-month supply zone between 1.5950 and the key psychological level of 1.6000. This is a major ceiling where significant selling pressure is anticipated.
Fibonacci Extension: This area aligns with a key Fibonacci extension level (1.272) from the last major impulse wave, a common zone where trending moves become exhausted and reversals begin.
Pronounced RSI Divergence: A clear bearish divergence is forming on the daily chart. As price makes this final push to a new high, the Relative Strength Index (RSI) is making a significantly lower high, signaling a deep exhaustion of buying momentum.
The Counter-Trade Rationale 🧠
This is a high-level fade. We are positioning for a reversal at a major, technically significant ceiling. The extreme price extension, combined with clear momentum divergence, indicates that the risk of buying at these highs is substantial. By shorting here, we are betting that the powerful technical resistance and weak fundamentals will trigger a significant correction.
The Setup ✅
📉 Pair: EUR/CAD
👉 Direction: Short
⛔️ Stop Loss: 1.63230
🎯 Entry: 1.59490
✅ Take Profit: 1.52008
⚖️ Risk/Reward: ≈ 2:1
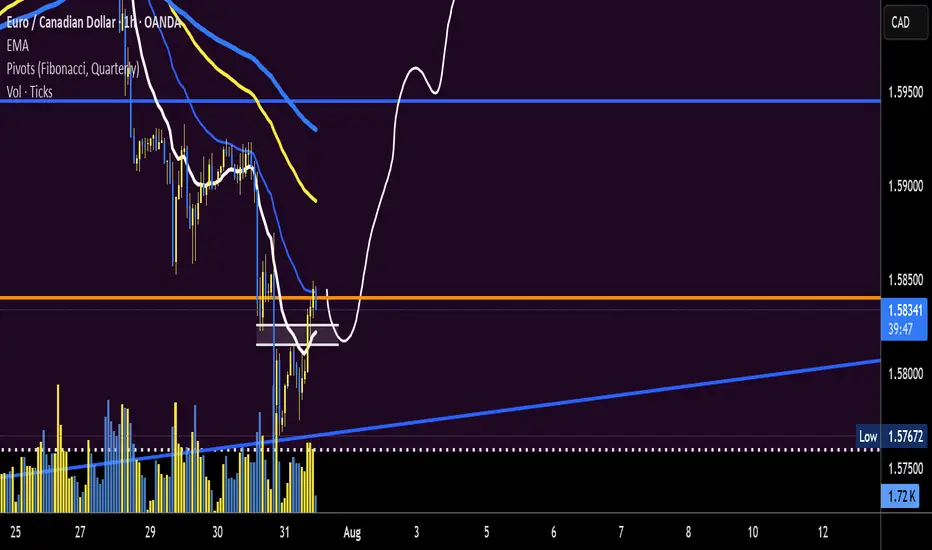
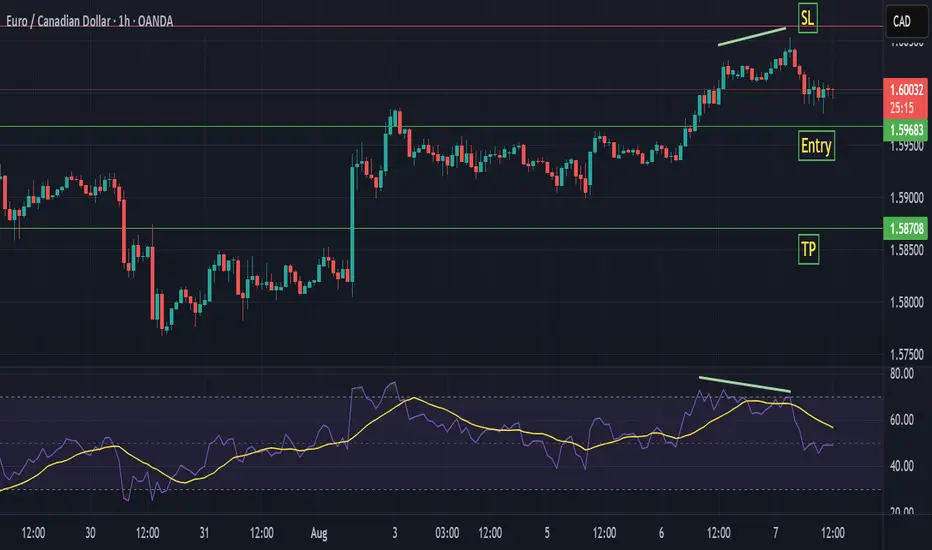
EURCAD 1H longEURCAD 1 H made a beatiful sharp drop, now stalling arround some good support levels.
When such a drop happens with no pullback formed yet I'm happy to buy the way down.
Because the pullback has to come soon buyers step in at the support levels.
My plan is simple I open a manual grid at the support levels I draw and aim for a 2R profit
Current grid 3 levels
1 market order
2 buy limits
Tp 2R
extra confirmation RSI is oversold
Shorts ConfirmationPrepare to sell! Be Ready! Its preparing a move like eurusd, we try to make a similiar down push, this patern is ready to drain al that liquidity downstairs
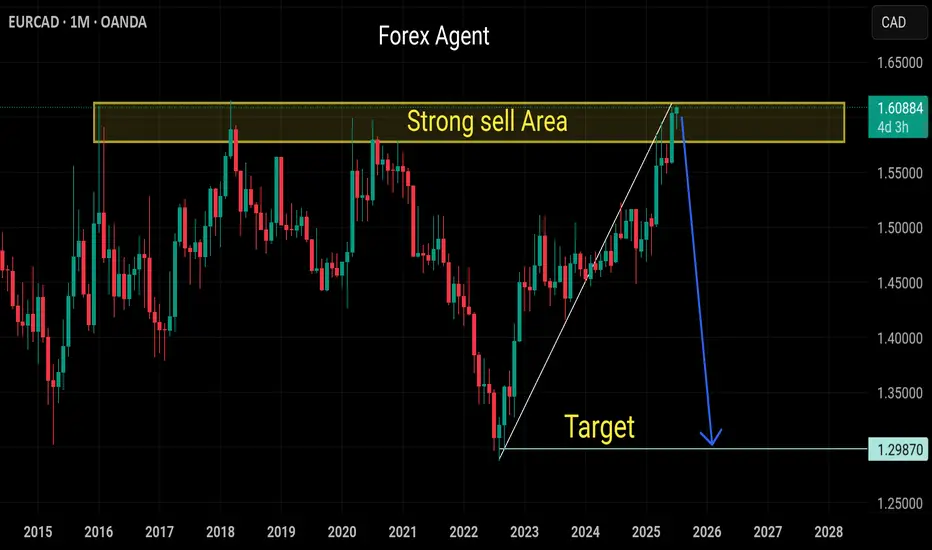
Sell eurcadStrong sell expected from next month
Monthly overbought indicators
Strong selling area minimum drop expected 500 pips
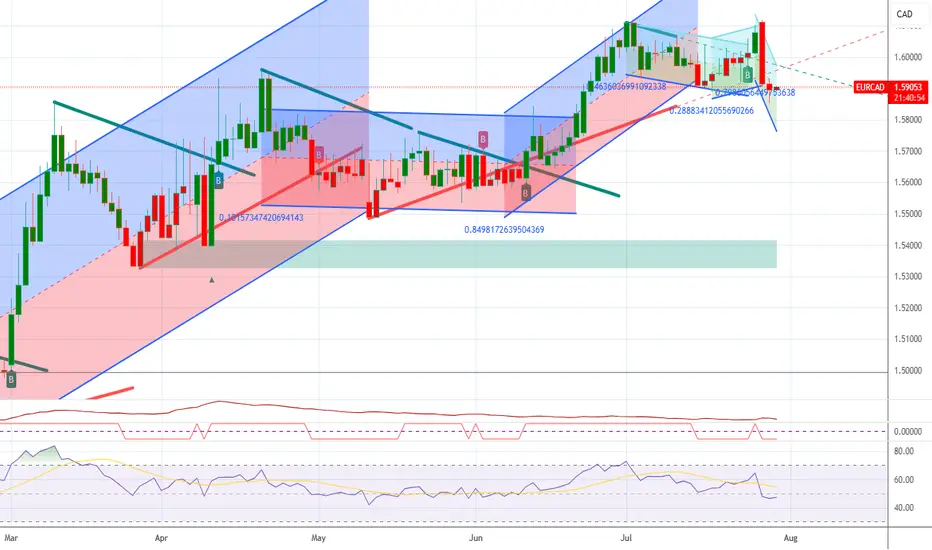
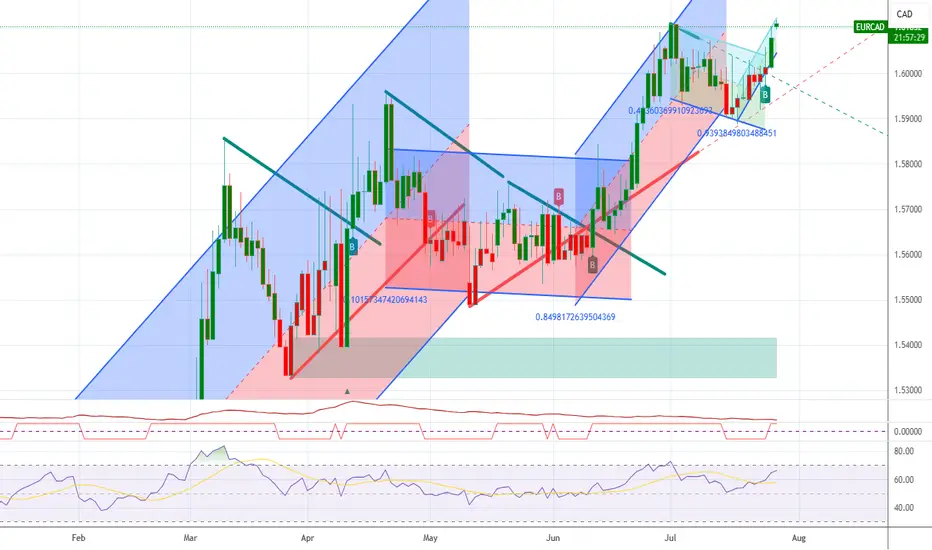
EURCAD ShortEURCAD is now net short on the regression break.
I am considering this trade as oil has move over night.
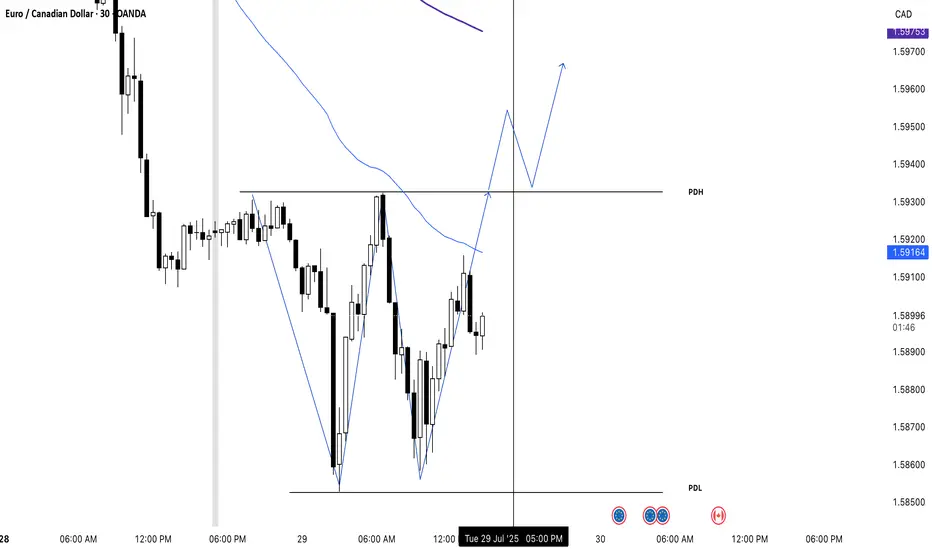
EURCAD Looking for longs after breakoutAs you can see the price its trying to be in a consolidatioon zone and gave formed a double bottom too that we can posibly get buys on tomorows london sesion
EURCAD is BearishPrice was in a strong uptrend, however now it seems that bulls are exhausted, the notion is further validated by a double top reversal pattern with bearish divergence. If previous higher low is broken with good volume, then we can expect a bearish reversal as per Dow theory. Targets are mentioned on the chart.
EURCAD - Strong Reversal Impulse off Double TopEURCAD has created bearish price action with a strong reversal impulse pushing down from the double top level. Waiting for a continuation to confirm a sell opportunity with a good R:R.
Good Luck
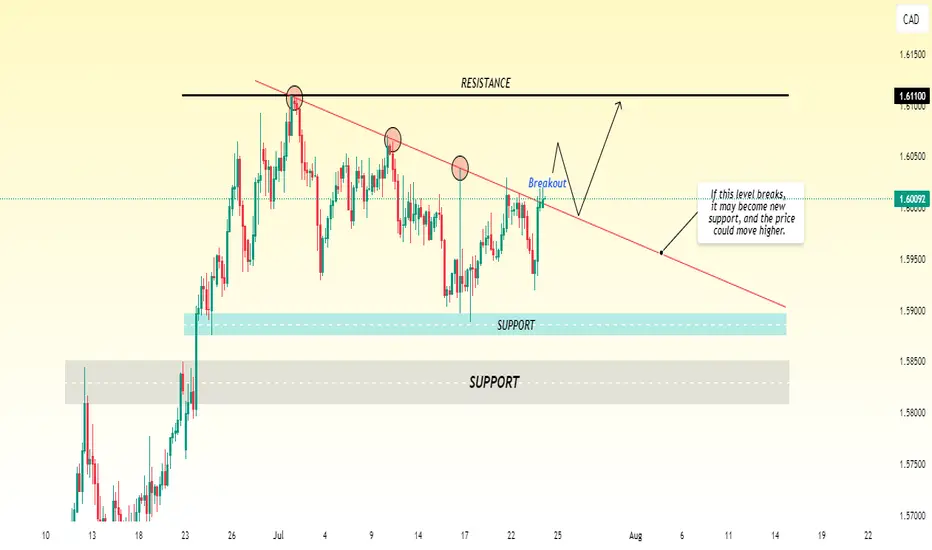
EUR/CAD Tests Resistance — Bullish Breakout in Sight?EUR/CAD appears to be showing bullish momentum and is likely heading toward the 1.6110 level. Currently, the pair is testing a key resistance zone. If the price manages to break above this resistance with strong volume or confirmation, we could see further upside continuation toward the next target at 1.6110. Traders should watch for a clear breakout and possible retest of the broken level turning into support, which could provide a good entry point for long positions.
EURCAD The Target Is DOWN! SELL!
My dear subscribers,
EURCAD looks like it will make a good move, and here are the details:
The market is trading on 1.6089 pivot level.
Bias - Bearish
My Stop Loss - 1.6104
Technical Indicators: Both Super Trend & Pivot HL indicate a highly probable Bearish continuation.
Target - 1.6061
About Used Indicators:
The average true range (ATR) plays an important role in 'Supertrend' as the indicator uses ATR to calculate its value. The ATR indicator signals the degree of price volatility.
Disclosure: I am part of Trade Nation's Influencer program and receive a monthly fee for using their TradingView charts in my analysis.
———————————
WISH YOU ALL LUCK

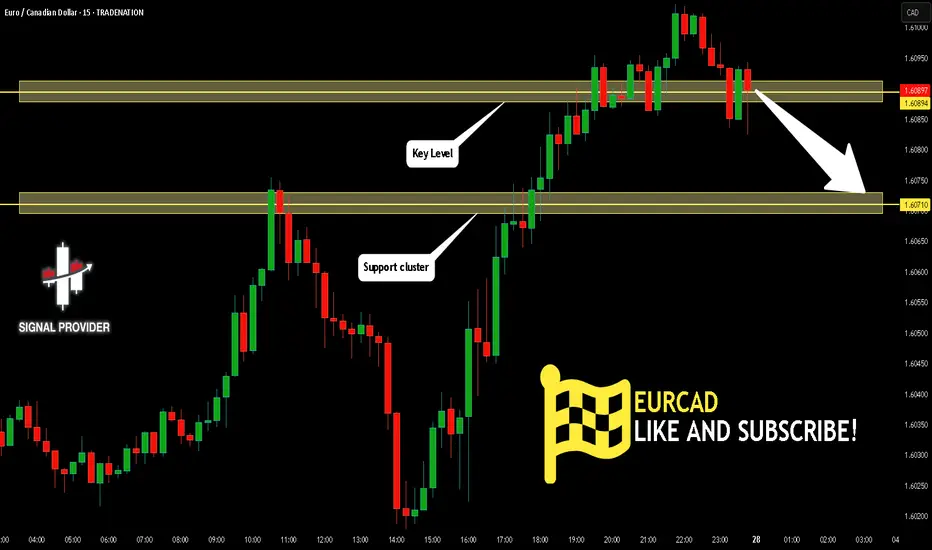
EURCAD Will Go Down! Short!
Please, check our technical outlook for EURCAD.
Time Frame: 15m
Current Trend: Bearish
Sentiment: Overbought (based on 7-period RSI)
Forecast: Bearish
The market is approaching a significant resistance area 1.608.
Due to the fact that we see a positive bearish reaction from the underlined area, I strongly believe that sellers will manage to push the price all the way down to 1.607 level.
P.S
The term oversold refers to a condition where an asset has traded lower in price and has the potential for a price bounce.
Overbought refers to market scenarios where the instrument is traded considerably higher than its fair value. Overvaluation is caused by market sentiments when there is positive news.
Disclosure: I am part of Trade Nation's Influencer program and receive a monthly fee for using their TradingView charts in my analysis.
Like and subscribe and comment my ideas if you enjoy them!
EUR-CAD Risky Short! Sell!
Hello,Traders!
EUR-CAD is trading in a
Strong uptrend so we are
Bullish biased long-term
However a strong horizontal
Resistance is ahead at 1.6110
And the pair is overbought
So after the retest of the
Resistance we will be
Expecting a bearish correction
Sell!
Comment and subscribe to help us grow!
Check out other forecasts below too!
Disclosure: I am part of Trade Nation's Influencer program and receive a monthly fee for using their TradingView charts in my analysis.
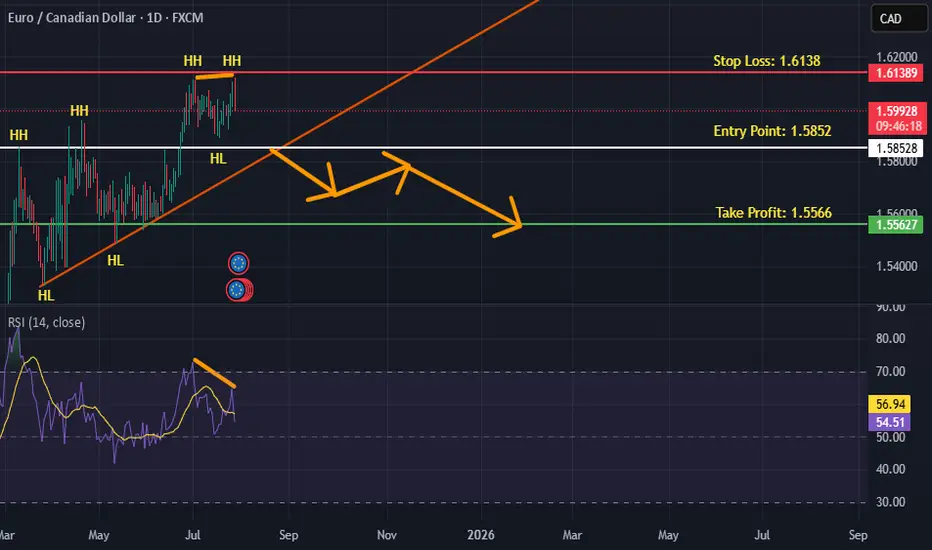
EUR/CAD – 93% Traders Are SHORT! Bearish Reversal Brewing?The EUR/CAD pair is currently in a bullish trend, but multiple technical and sentiment signals are pointing toward a possible trend reversal.
🔍 Key Observations:
Trend: Bullish (but losing momentum)
Bearish Divergence: Price making higher highs while RSI indicators show lower highs.
Pattern: Rising Wedge – a classic bearish reversal formation.
Harmonic Analysis: AB=CD pattern is approaching the potential reversal zone (PRZ).
EMA Insight: Price candles have moved across the 20 EMA and 50 EMA, signaling weakening bullish momentum.
Sentiment (Myfxbook.com): 93% of traders are currently short on EUR/CAD — strong crowd bias toward the downside.
📌 Trade Setup:
Bias: Bearish
Strategy: Sell Stop at breakout of previous Higher Low (HL)
Entry Price (EP): Sell Stop @ 1.59755
Stop Loss (SL): 1.60626
Take Profit 1 (TP1): 1.58884 (R:R = 1:1)
Take Profit 2 (TP2): 1.58013 (R:R = 1:2)
Lot Size: 0.15
Risk: $200 | Potential Reward: $200–$300
💡 Trade Execution Plan:
We will enter only after HL breakout confirmation to avoid false moves. This setup aligns Rising Wedge pattern, Bearish Divergence, EMA cross weakness, Harmonic PRZ zone, and bearish sentiment — a powerful confluence for a potential downside move.
📊 Technical Summary:
Combining price action, chart patterns, harmonics, momentum, and trader sentiment gives this short setup high probability.
📢 Your Turn:
What’s your take on this trade? Will the market follow the 93% bearish sentiment, or could this be a trap?
💬 Drop your analysis in the comments, let’s discuss!
👍 Like, 🔁 Share, and Follow for more trade setups & technical breakdowns.
#EURCAD #Forex #ForexTrading #BearishReversal #PriceAction #HarmonicPatterns #TechnicalAnalysis #EMA #Divergence #TradingView #ChartPatterns #SwingTrading #ForexSetups #ABCDPattern #PriceActionTrading #ForexSignals #RisingWedge #1HRTimeFrame #ForexLife #DayTrading #MarketSentiment #Myfxbook

EURCAD, We should have waited for confirmation.EURCAD re entry, is bullish in higher time frames.
In the daily timeframe it is bearish due to a higher time frame retracement.
Our entry is a low risk (20 Pips) with our targets eyeing a 1:10.
DISCAIMER: This is not a financial advice, trade with caution.
eurcadPrice consolidating after a strong bullish move
Support at 1.5965, resistances at 1.6020 / 1.6054 / 1.6098
📈 If price breaks above 1.6020:
Target 1 → 1.6054
Target 2 → 1.6098
📉 If price breaks below 1.5965:
Target 1 → 1.5940
Target 2 → 1.5900
📌 No entries inside the range — waiting for a clear breakout with confirmation
Strong move likely after this consolidation.

EURCAD - ReversalMaking Double Top and clear Divergence can be observed. Seasonals also support the reversal.

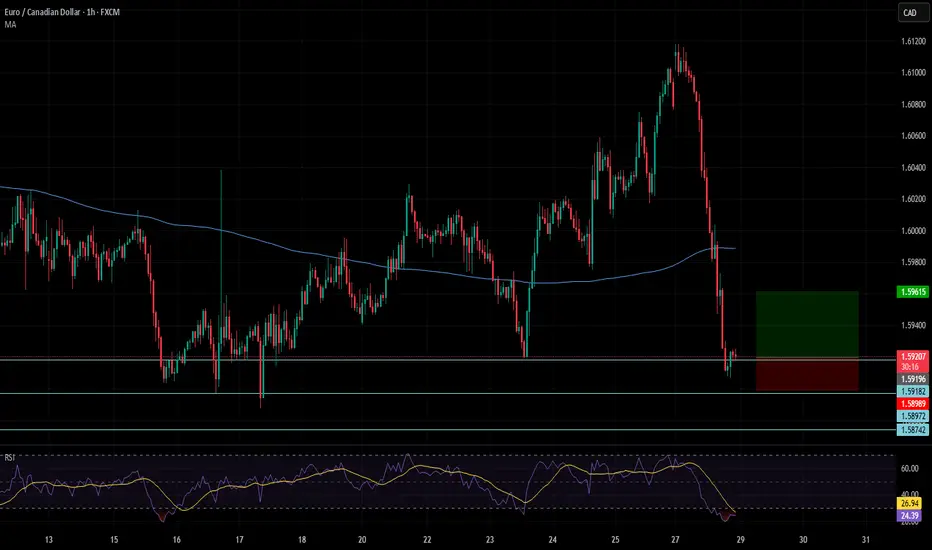
EURCAD | Eyes on the 50EMA — One Bold Candle and I’m All In💌 Still in Love with the Trend — Just Waiting for My Candle to Say “Yes”
1-hour chart has already whispered sweet nothings — a clean buy range has formed, and we’ve just dipped into a lovely little retracement. But guess what?
All my signals say the pullback is over — and it’s almost time to get back on this romantic ride! 😍
💘 WHAT TO DO NOW
✨Entry : I’m waiting for one bold Marubozu candle to confidently close above my 50EMA — no hesitation. Once that happens, I’m jumping in like it’s the last dance of the night. 💃🕺
🛡️Stop Loss:
If the candle is strong and healthy — like a partner I can trust — I’ll place my SL just below it.
If not, I’ll let it go… there’s always another setup waiting with love. ❤️
TP: 1.5985
❓WHAT IF PRICE REFUSES TO COMMIT?
No worries — this is a day trading love story.
While I keep an eye on the 15m chart flirting with the 50EMA, I’ll also glance at the 1-hour to make sure the romantic spark (a.k.a. bullish range) is still alive.
As long as the 1H trend is holding strong, this setup is still valid. 💍
Wish me luck… and may the markets fall in love with me today! 📈💕

EUR/CAD a potential leg up formingEUR/CAD trend line seems to be holding. look for a entry signal up after pull back. 14 ema and 34 ema may offer resistance on 15 min chart. monitor volume decrease on pull back and spike for upward force and continuation