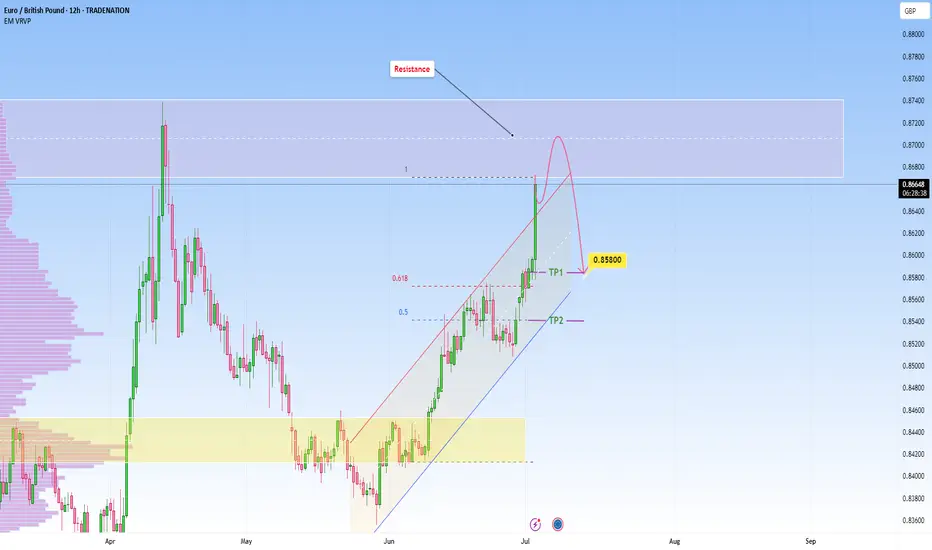
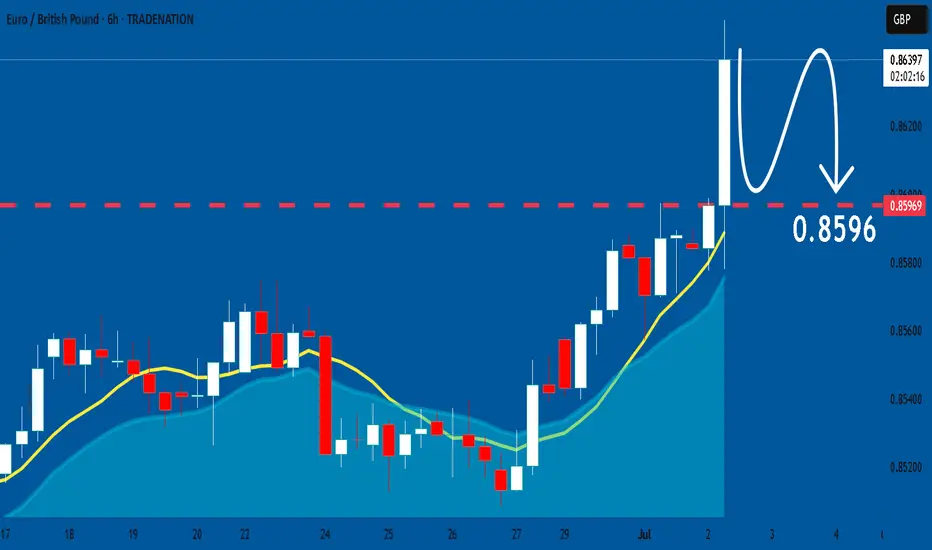
EURGBP reached strong resistance: Likely reversal incomingPrice has been in a strong impulsive rally, pushing aggressively into a well established resistance zone. This zone is marked by a prior sharp sell-off, suggesting it could trigger selling interst again.
The current move appears overextended in the short term. The ascending channel is extremly vertical, showing momentum, but this type of movement often leads to exhaustion, especially when met with a key zone like so. Volume profile shows a lack of recent trading activity at these levels, which can exaggerate volatility once price enters this area.
Given how clean and one-sided the climb has been, a pullback is not only likely, but it would be healthy. The projected reaction toward the 0.85800 area makes sense technically: it corresponds with key Fibonacci retracement levels (between 0.5 and 0.618), adding confluence to the idea of a corrective move before any continuation or reversal.
Until there’s a clear break above the upper bound of this zone with sustained volume, this remains a high-probability area for short-term rejection or distribution.
If price starts printing long upper wicks, slowing momentum, or bearish engulfing patterns on lower timeframes, that could offer early signals of weakness and a shift in momentum.
Just sharing my thoughts on support and resistance, this isn’t financial advice . Always confirm your setups and manage your risk properly.
Disclosure: I am part of Trade Nation's Influencer program and receive a monthly fee for using their TradingView charts in my analysis.
EURGBP trade ideas
EURGBP - Follow The Bulls!Hello TradingView Family / Fellow Traders. This is Richard, also known as theSignalyst.
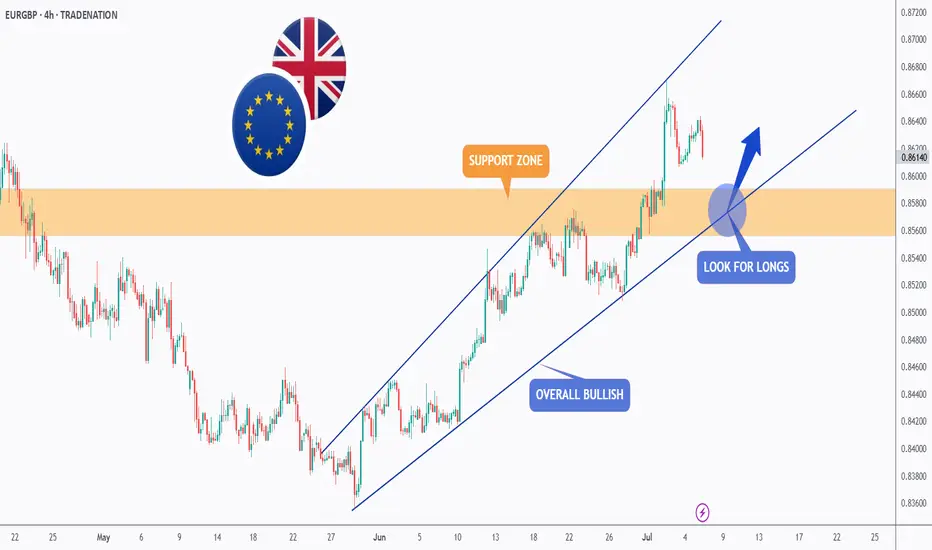
📈EURGBP has been overall bullish trading within the rising channel marked in blue. And it is currently retesting the lower bound of the channel.
Moreover, the orange zone is a strong daily support.
🏹 Thus, the highlighted blue circle is a strong area to look for buy setups as it is the intersection of the lower blue trendline and support.
📚 As per my trading style:
As #EURGBP approaches the blue circle zone, I will be looking for bullish reversal setups (like a double bottom pattern, trendline break , and so on...)
📚 Always follow your trading plan regarding entry, risk management, and trade management.
Good luck!
All Strategies Are Good; If Managed Properly!
~Rich
Disclosure: I am part of Trade Nation's Influencer program and receive a monthly fee for using their TradingView charts in my analysis.
EURGBP – Trading the Price Where It Is, Not Where You Want It toWhen trading price movements, traders always strive to determine where the price will go.
This compulsion leads most of them to close losing positions!
The strong urge that comes from this — that price must do what the trader predicted — is what ruins the position.
Price must always be handled as and where it is! This we know. This is certain.
Until 2016, EURGBP was my favorite pair. I traded it with a very well-functioning and manageable strategy. However, Brexit changed its movement.
In the 9 years since, I haven’t given up, and I’m still a trader! A trader who builds everything around personal development.
Thanks to this mindset, I can use the simplest strategy. I always analyze the chart based on existing information and make decisions according to the levels visible there.
The entry point is not the most important!
Our exit point is what matters! Because if that’s in profit, then even 100 points can be enough as annual profit. You just need a high lot size for that. But if you knew you’d have 100 points, how much would you risk? A lot! Everything…
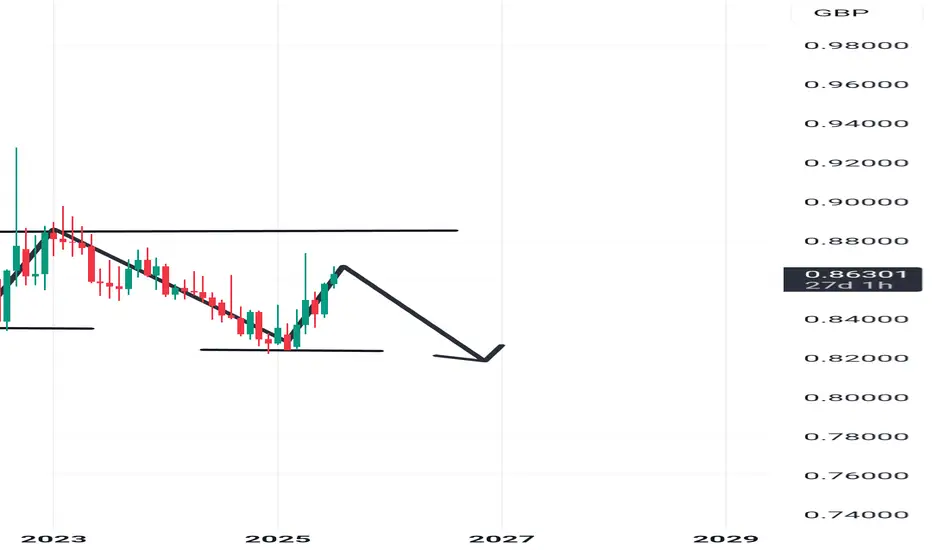
So in the image, you can see the “sideways” channel formed over the past 9 years of EURGBP, yet you can still identify a series of lower highs and lower lows.
Currently, it’s moving within a 600-point range upward from the most recent low after the confirmation of the latest high. It's now only 200 points away from that point.
If a new lower high forms here, then in time, price could close below the previous low.
A tight stop can be used at this entry point and a very large limit. I aim to achieve a 1:20 position with this trade this year.
Follow the price, and if proper confirmation occurs, a short entry may be made.
Two interesting FX technical strategies under close watchWhile the US dollar is the weakest major currency on the foreign exchange (FX) market this year 2025, and the question of its low point arises, two other currencies seem important to me to put under close watch for this month of July: the Pound Sterling (GBP) and the Hong Kong dollar (HKD). To begin with, you can reread our latest analysis below (by clicking on the chart), which raises the question of a possible future low point for the US dollar on the FX.
The British pound, which was buoyed by positive momentum at the start of the year, is now facing fiscal and bond risks that are weakening it. At the same time, the Hong Kong dollar is testing the solidity of its parity mechanism with the greenback, forcing the local monetary authority to step up interventions to preserve its credibility. The EUR/GBP rate could be a good strategy for hedging against the risk of a fall in sterling. As for the USD/HKD rate, the upper end of the PEG could once again provide good resistance for a trading strategy.
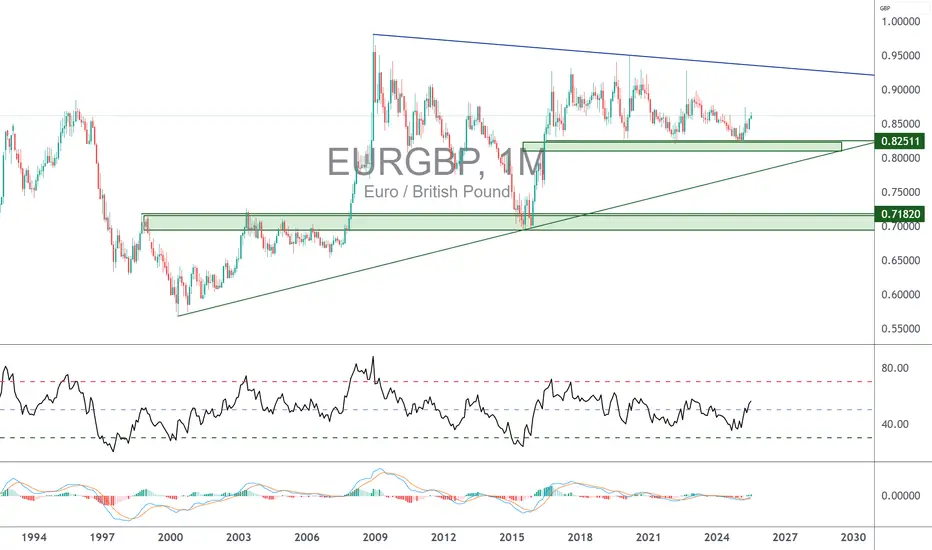
1) Sterling is under pressure from UK bond yields, and the EUR/GBP rate presents an interesting chart configuration
The EUR/GBP rate, a barometer of confidence in the British currency, could come under upward pressure if UK budget fears persist. Tensions intensified after Keir Starmer's Labour government abandoned several budget-saving measures, deepening an already worrying deficit. As a result, yields on 30-year British government bonds jumped 19 basis points in a single session, their biggest rise since April, triggering a sharp decline in the pound. This context is reminiscent of the episodes of 2022 under Liz Truss, when British fiscal credibility wavered sharply. In the short term, the prospect of an autumn tax hike by Chancellor Rachel Reeves could fuel volatility.
From a technical analysis point of view, the EUR/GBP rate is following an underlying uptrend, and the guarantor of this trend is support at 0.8250. We must therefore keep a close eye on the evolution of British long rates and tax announcements, which will condition the trajectory of the EUR/GBP rate. If British debt continues to worry the market, then the EUR/GBP rate could continue its rise towards resistance at 0.90. Breaking support at 0.8250 would invalidate this chart scenario.
2) The USD/HKD rate is testing the upper end of the PEG defended by the Hong Kong monetary authorities
The USD/HKD rate is once again testing the upper limit of the “peg” set between 7.75 and 7.85 HKD per US dollar. Since the end of June, the weakness of local interest rates, with the one-month Hibor falling to 0.86%, i.e. almost 350 basis points below the cost of the dollar, has encouraged speculative positions against the Hong Kong dollar. To defend parity, the Hong Kong Monetary Authority (HKMA) intervened on several occasions, repurchasing a total of 59 billion Hong Kong dollars and significantly reducing the liquidity of the banking system. The latest operation, for HK$29.6 billion, is testimony to the extent of the pressure on the peg.
For traders, this context offers short-term technical opportunities, by playing the bounces near the upper limit of the convertibility band. Nevertheless, the persistence of a high interest-rate differential between the United States and Hong Kong raises the risk of prolonged tension. In recent years, the Hong Kong Monetary Authority has always succeeded in preventing the 7.85 resistance level from being breached, but caution and risk awareness are required before using this resistance for FX trading strategies.
DISCLAIMER:
This content is intended for individuals who are familiar with financial markets and instruments and is for information purposes only. The presented idea (including market commentary, market data and observations) is not a work product of any research department of Swissquote or its affiliates. This material is intended to highlight market action and does not constitute investment, legal or tax advice. If you are a retail investor or lack experience in trading complex financial products, it is advisable to seek professional advice from licensed advisor before making any financial decisions.
This content is not intended to manipulate the market or encourage any specific financial behavior.
Swissquote makes no representation or warranty as to the quality, completeness, accuracy, comprehensiveness or non-infringement of such content. The views expressed are those of the consultant and are provided for educational purposes only. Any information provided relating to a product or market should not be construed as recommending an investment strategy or transaction. Past performance is not a guarantee of future results.
Swissquote and its employees and representatives shall in no event be held liable for any damages or losses arising directly or indirectly from decisions made on the basis of this content.
The use of any third-party brands or trademarks is for information only and does not imply endorsement by Swissquote, or that the trademark owner has authorised Swissquote to promote its products or services.
Swissquote is the marketing brand for the activities of Swissquote Bank Ltd (Switzerland) regulated by FINMA, Swissquote Capital Markets Limited regulated by CySEC (Cyprus), Swissquote Bank Europe SA (Luxembourg) regulated by the CSSF, Swissquote Ltd (UK) regulated by the FCA, Swissquote Financial Services (Malta) Ltd regulated by the Malta Financial Services Authority, Swissquote MEA Ltd. (UAE) regulated by the Dubai Financial Services Authority, Swissquote Pte Ltd (Singapore) regulated by the Monetary Authority of Singapore, Swissquote Asia Limited (Hong Kong) licensed by the Hong Kong Securities and Futures Commission (SFC) and Swissquote South Africa (Pty) Ltd supervised by the FSCA.
Products and services of Swissquote are only intended for those permitted to receive them under local law.
All investments carry a degree of risk. The risk of loss in trading or holding financial instruments can be substantial. The value of financial instruments, including but not limited to stocks, bonds, cryptocurrencies, and other assets, can fluctuate both upwards and downwards. There is a significant risk of financial loss when buying, selling, holding, staking, or investing in these instruments. SQBE makes no recommendations regarding any specific investment, transaction, or the use of any particular investment strategy.
CFDs are complex instruments and come with a high risk of losing money rapidly due to leverage. The vast majority of retail client accounts suffer capital losses when trading in CFDs. You should consider whether you understand how CFDs work and whether you can afford to take the high risk of losing your money.
Digital Assets are unregulated in most countries and consumer protection rules may not apply. As highly volatile speculative investments, Digital Assets are not suitable for investors without a high-risk tolerance. Make sure you understand each Digital Asset before you trade.
Cryptocurrencies are not considered legal tender in some jurisdictions and are subject to regulatory uncertainties.
The use of Internet-based systems can involve high risks, including, but not limited to, fraud, cyber-attacks, network and communication failures, as well as identity theft and phishing attacks related to crypto-assets.
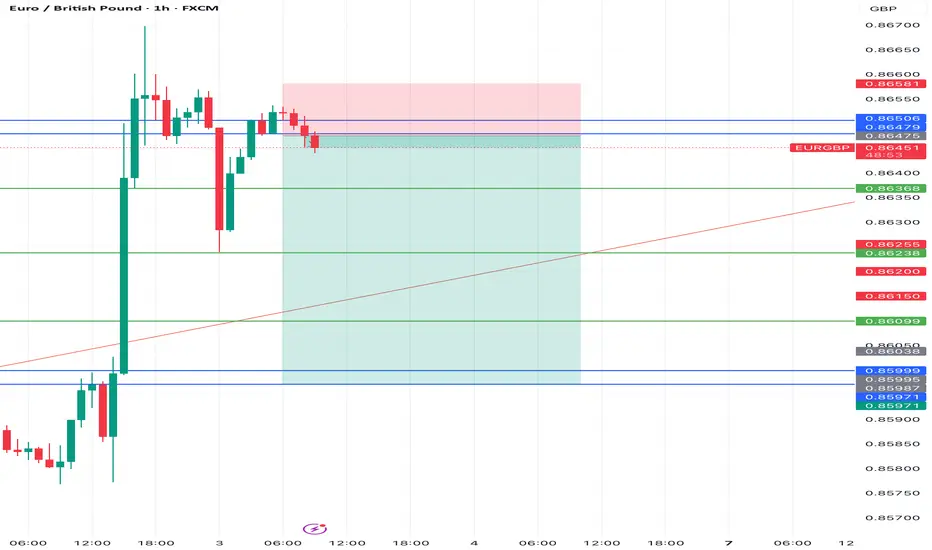
EURGBP sell Opportunity 1:3 Risk rewards , IT is time to sell the EURGBP from the resistance area. price is resistance in this zone for several times and it gave the downwards signal . Do not risk more than 1% from your capital .
Market Analysis: EUR/GBP Accelerates HigherMarket Analysis: EUR/GBP Accelerates Higher
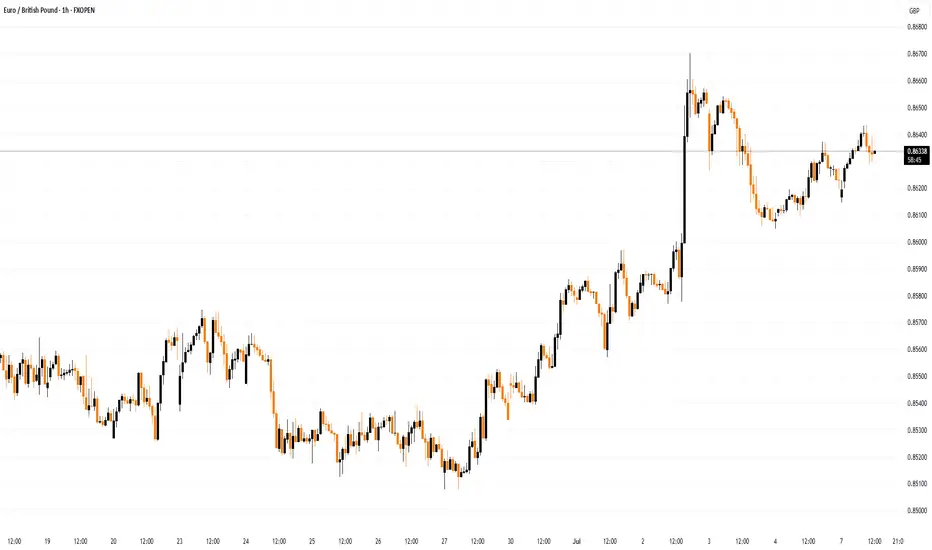
EUR/GBP is rising and might climb above the 0.8670 resistance.
Important Takeaways for EUR/GBP Analysis Today
- EUR/GBP is gaining pace and trading above the 0.8600 zone.
- There was a break above a contracting triangle with resistance at 0.8630 on the hourly chart at FXOpen.
EUR/GBP Technical Analysis
On the hourly chart of EUR/GBP at FXOpen, the pair started a decent increase from the 0.8500 zone. The Euro traded above the 0.8580 resistance level to enter a positive zone against the British Pound.
The pair settled above the 50-hour simple moving average and 0.8620. It traded as high as 0.8670 before a downside correction. There was a move below the 23.6% Fib retracement level of the upward move from the 0.8507 swing low to the 0.8670 high.
However, the pair is stable above the 0.8600 support zone. The next major support is near the 50% Fib retracement level of the upward move from the 0.8507 swing low to the 0.8670 high at 0.8590.
A downside break below 0.8590 might call for more downsides. In the stated case, the pair could drop toward the 0.8545 support level. Any more losses might call for an extended drop toward the 0.8505 pivot zone.
The EUR/GBP chart suggests that the pair is facing resistance near the 0.8635 zone. A close above the 0.8635 level might accelerate gains. In the stated case, the bulls may perhaps aim for a test of 0.8670. Any more gains might send the pair toward the 0.8700 level.
This article represents the opinion of the Companies operating under the FXOpen brand only. It is not to be construed as an offer, solicitation, or recommendation with respect to products and services provided by the Companies operating under the FXOpen brand, nor is it to be considered financial advice.
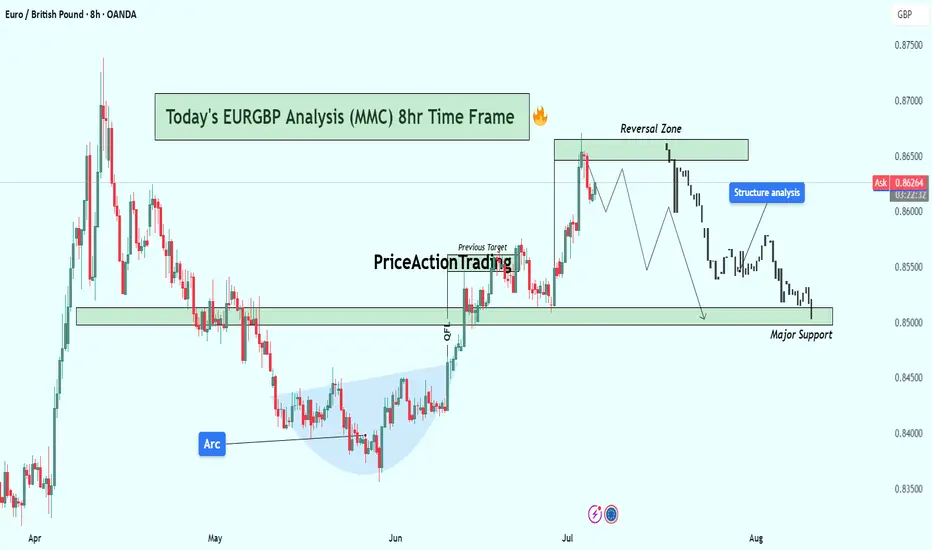
EURGBP 8H Analysis : Breakdown + Smart Money Structure + Target🧠 Phase 1: Arc Formation – Accumulation by Smart Money
The arc (May to June) reflects an accumulation base where price made higher lows with consolidative wicks and slow momentum, ideal conditions for institutional orders to build long positions.
Liquidity is swept below swing lows, stopping out early longs — this is classic smart money accumulation.
Volume compression during the arc followed by expansion on breakout confirms smart interest.
🔑 Psychology: Retail was likely selling here due to lower highs, while smart money was accumulating quietly at the bottom of the arc.
🚀 Phase 2: Breakout & Rally to Previous Highs
Price cleanly breaks above the arc’s neckline and previous resistance (labeled as Previous Target).
Momentum accelerates rapidly toward the reversal zone, likely due to stop hunts and FOMO buyers entering after confirmation.
Structure shifts bullish, creating strong impulsive candles — but these are often final exit points for smart money.
📌 Key Sign: Breakout aligns perfectly with market inefficiencies being filled, often a sign of a short-term top formation brewing.
🔄 Phase 3 : Reversal Zone – Distribution Phase
Inside the Reversal Zone (0.8650–0.8680), price shows exhaustion with multiple upper wicks and slowing bullish momentum.
Distribution signs: choppy movement, lower highs, and eventual breakdown.
Retail is often caught entering longs here on confirmation, while institutions offload their positions.
🧠 MMC Insight: This is where Mind Market Curve transitions from bullish impulse to corrective leg down — phase of deception.
📉 Phase 4: Structure Breakdown & Bearish Market Behavior
Price breaks through short-term higher low structure — confirmation of bearish intent.
The formation of lower highs and lower lows marks the beginning of a bearish trend shift.
Market is now targeting Major Support (0.8500–0.8520 zone), which is currently being tested.
🧭 If price breaks below 0.8500 with volume and aggression, next level is likely near 0.8430–0.8450.
⚖️ Current Price Location: Major Support Test
We’re at a critical decision point.
If support holds → expect a bounce to 0.8600–0.8620.
If it breaks → expect continuation to next liquidity pool below 0.8450.
This zone is where buyers and sellers will battle. Wait for:
Bullish confirmation (reversal pattern / engulfing candle) to go long.
Bearish breakout (close below zone + retest) to go short.
🔁 Summary of Scenarios
Scenario Conditions Target
✅ Bullish Bounce Rejection at support with bullish engulfing/pin bar 0.8600–0.8620
❌ Bearish Break Close below 0.8500 + retest as resistance 0.8430–0.8450
🔖 Educational Takeaway
This chart teaches how to:
Identify accumulation via arc and understand smart money behavior.
Recognize false confirmation zones (where retail enters late).
Understand structure shift as a trend reversal signal.
Execute trades based on reaction zones, not emotions.
If you follow MMC (Mind Market Curve), this is a textbook transition from:
Accumulation →
Expansion →
Distribution →
Breakdown
EURGBP AnalysisPrice has reached its true average and has shown a large amount of supply side volume, therefore I'm looking to short at this price level. It could consolidate later when the London/New York crossover happens.
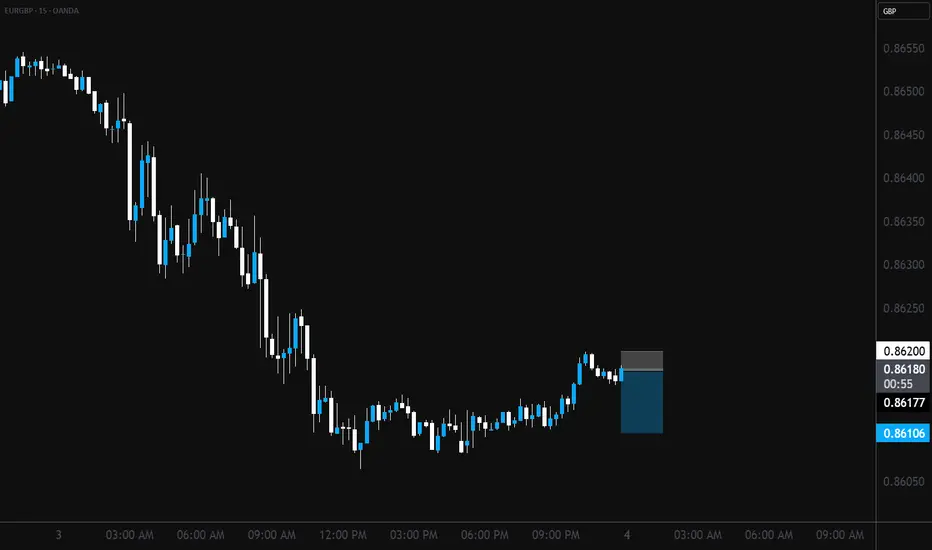
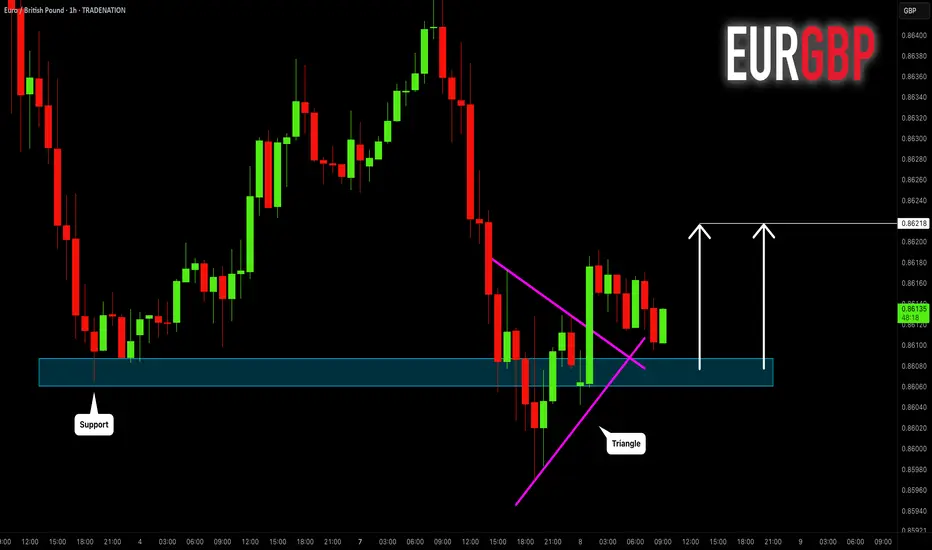
EURGBP: Bullish Move After False Breakout 🇪🇺🇬🇧
EURGBP will likely go up from a key daily/intraday support,
following a bullish breakout of a resistance line
of a bullish triangle on an hourly time frame.
The price may go up to 0.86218 level then.
❤️Please, support my work with like, thank you!❤️
I am part of Trade Nation's Influencer program and receive a monthly fee for using their TradingView charts in my analysis.
EURGBP: Weak Market & Bearish Forecast
Our strategy, polished by years of trial and error has helped us identify what seems to be a great trading opportunity and we are here to share it with you as the time is ripe for us to sell EURGBP.
Disclosure: I am part of Trade Nation's Influencer program and receive a monthly fee for using their TradingView charts in my analysis.
❤️ Please, support our work with like & comment! ❤️
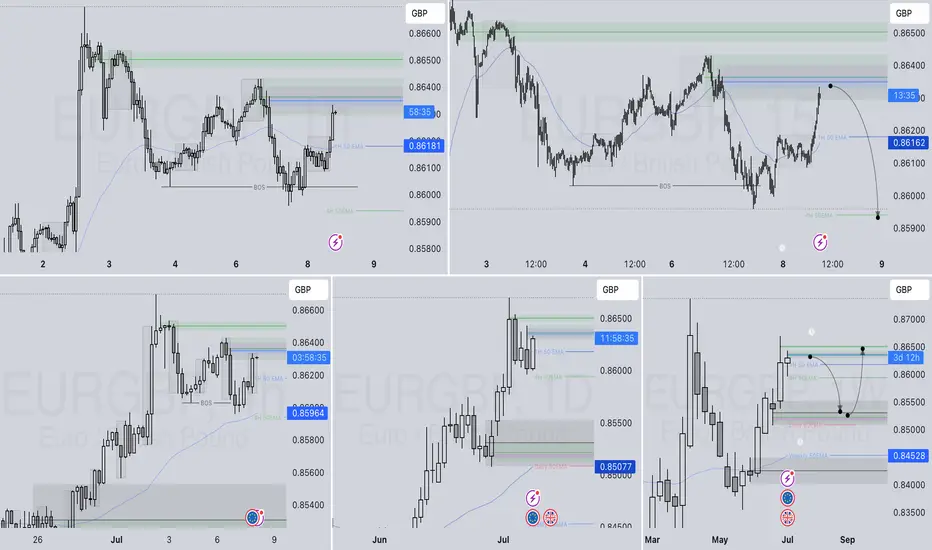
EURGBP SHORT DAILY FORECAST Q3 D8 W28 Y25EURGBP SHORT DAILY FORECAST Q3 D8 W28 Y25
Professional Risk Managers👋
Welcome back to another FRGNT chart update📈
Diving into some Forex setups using predominantly higher time frame order blocks alongside confirmation breaks of structure.
Let’s see what price action is telling us today! 👀
💡Here are some trade confluences📝
✅Daily Order block identified
✅4H Order Block identified
✅1H Order Block identified
🔑 Remember, to participate in trading comes always with a degree of risk, therefore as professional risk managers it remains vital that we stick to our risk management plan as well as our trading strategies.
📈The rest, we leave to the balance of probabilities.
💡Fail to plan. Plan to fail.
🏆It has always been that simple.
❤️Good luck with your trading journey, I shall see you at the very top.
🎯Trade consistent, FRGNT X
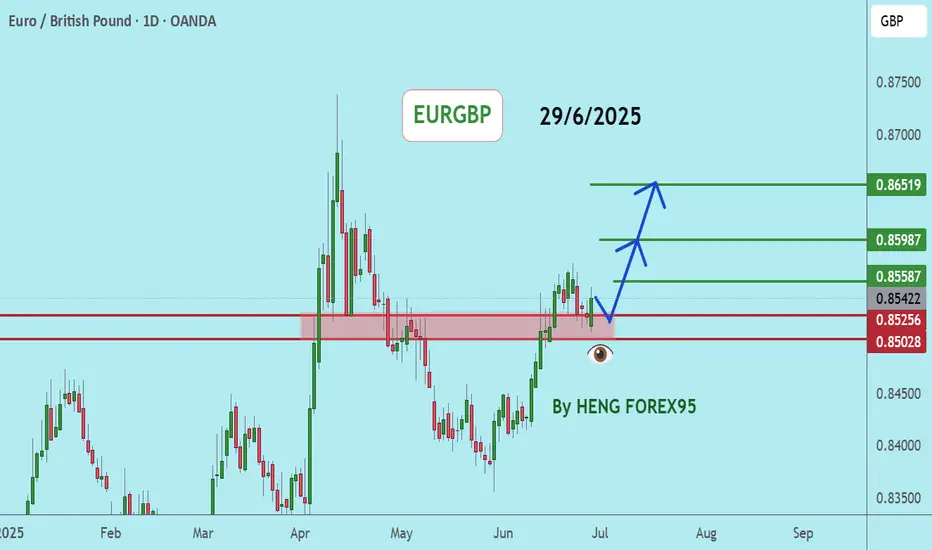
EURGBPEURGBP If the price can stay above 0.85028, it is likely to increase.
Consider buying the red zone.
🔥Trading futures, forex, CFDs and stocks carries a risk of loss.
Please consider carefully whether such trading is suitable for you.
>>GooD Luck 😊
❤️ Like and subscribe to never miss a new idea!
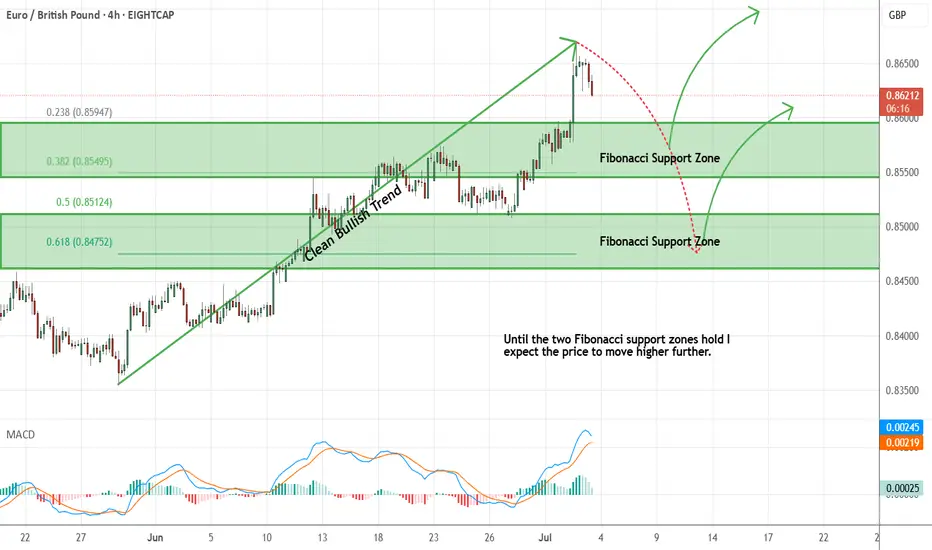
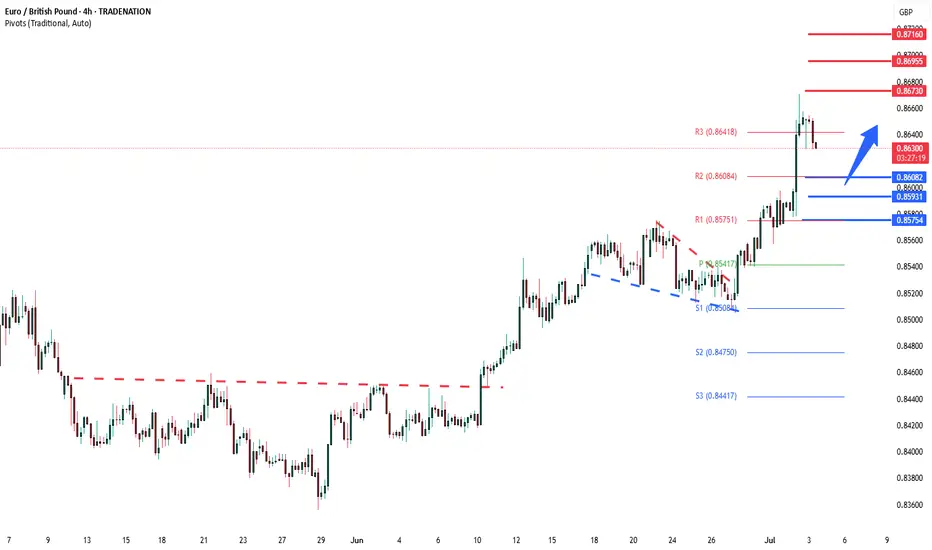
EURGBP - Expecting Bullish Continuation In The Short TermH4 - We have a clean bullish trend with the price creating a series of higher highs, higher lows structure.
This strong bullish momentum is followed by a pullback.
No opposite signs.
Until the two Fibonacci support zones hold I expect the price to move higher further.
If you enjoy this idea, don’t forget to LIKE 👍, FOLLOW ✅, SHARE 🙌, and COMMENT ✍! Drop your thoughts and charts below to keep the discussion going. Your support helps keep this content free and reach more people! 🚀
--------------------------------------------------------------------------------------------------------------------
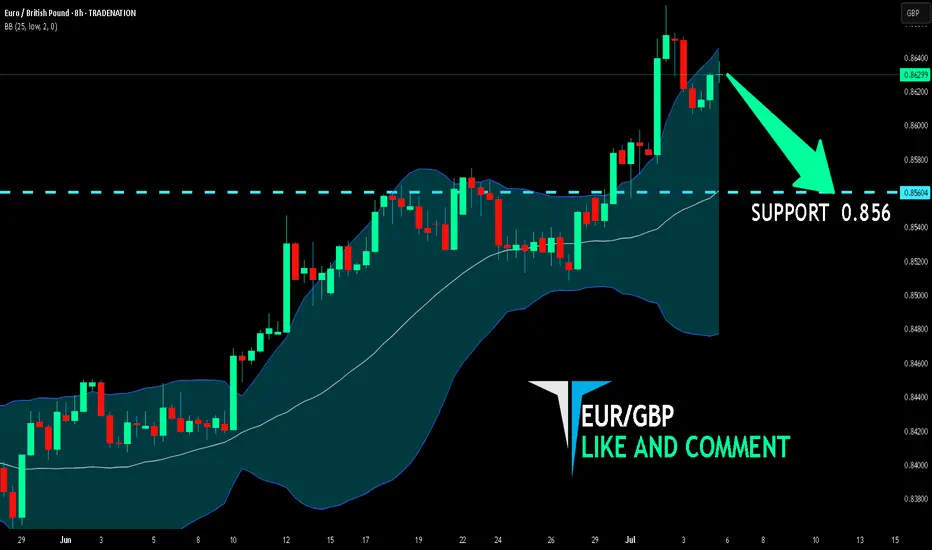
EUR/GBP BEST PLACE TO SELL FROM|SHORT
Hello, Friends!
The BB upper band is nearby so EUR-GBP is in the overbought territory. Thus, despite the uptrend on the 1W timeframe I think that we will see a bearish reaction from the resistance line above and a move down towards the target at around 0.856.
Disclosure: I am part of Trade Nation's Influencer program and receive a monthly fee for using their TradingView charts in my analysis.
✅LIKE AND COMMENT MY IDEAS✅
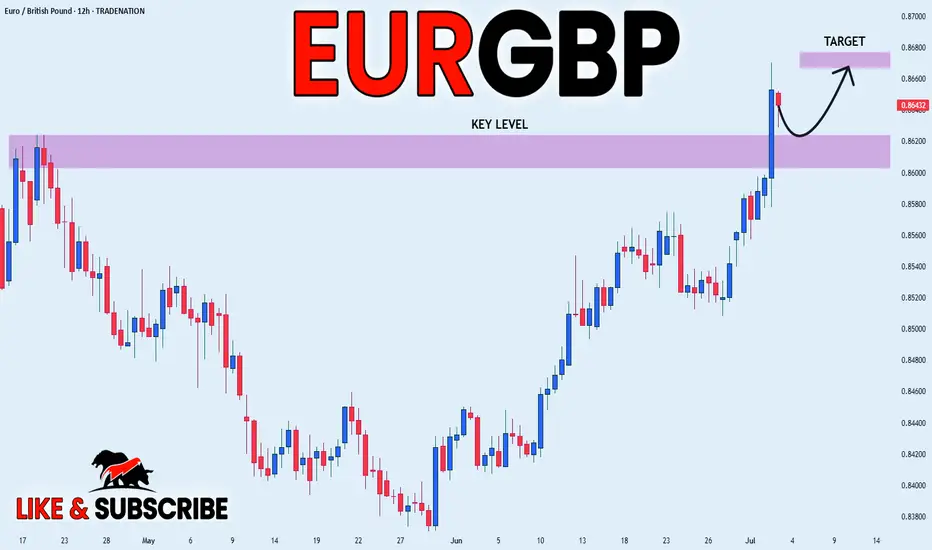
EUR_GBP BULLISH BIAS|LONG|
✅EUR_GBP broke the key
Structure level of 0.8620
While trading in an local uptrend
Which makes me bullish
And I think that after the retest
Of the broken level is complete
A rebound and bullish continuation will follow
LONG🚀
✅Like and subscribe to never miss a new idea!✅
Disclosure: I am part of Trade Nation's Influencer program and receive a monthly fee for using their TradingView charts in my analysis.
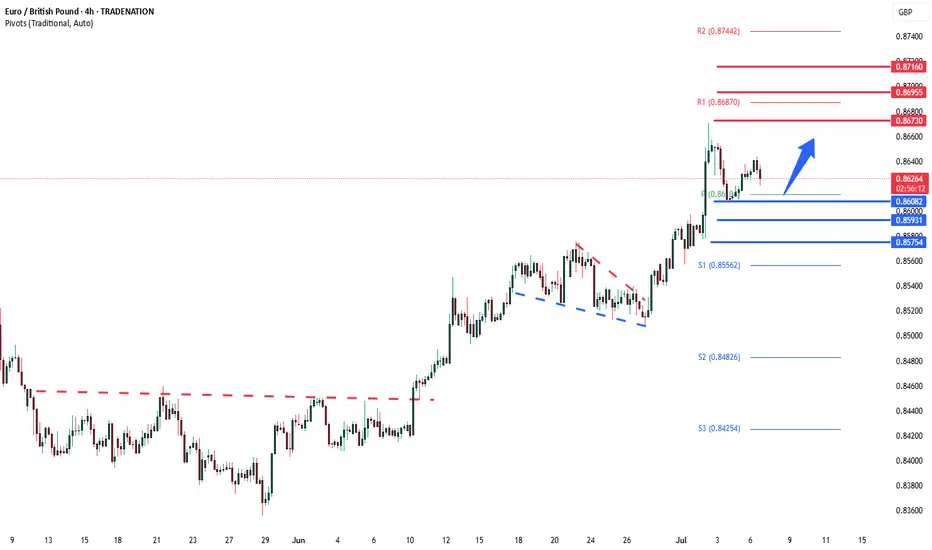
EURGBP corrective pullback support at 0.8600The EURGBP remains in a bullish trend, with recent price action showing signs of a corrective pullback within the broader uptrend.
Support Zone: 0.8600 – a key level from previous consolidation. Price is currently testing or approaching this level.
A bullish rebound from 0.8600 would confirm ongoing upside momentum, with potential targets at:
0.8670 – initial resistance
0.8700 – psychological and structural level
0.8720 – extended resistance on the longer-term chart
Bearish Scenario:
A confirmed break and daily close below 0.8600 would weaken the bullish outlook and suggest deeper downside risk toward:
0.8590 – minor support
0.8570 – stronger support and potential demand zone
Outlook:
Bullish bias remains intact while the EURGBP holds above 0.8600. A sustained break below this level could shift momentum to the downside in the short term.
This communication is for informational purposes only and should not be viewed as any form of recommendation as to a particular course of action or as investment advice. It is not intended as an offer or solicitation for the purchase or sale of any financial instrument or as an official confirmation of any transaction. Opinions, estimates and assumptions expressed herein are made as of the date of this communication and are subject to change without notice. This communication has been prepared based upon information, including market prices, data and other information, believed to be reliable; however, Trade Nation does not warrant its completeness or accuracy. All market prices and market data contained in or attached to this communication are indicative and subject to change without notice.
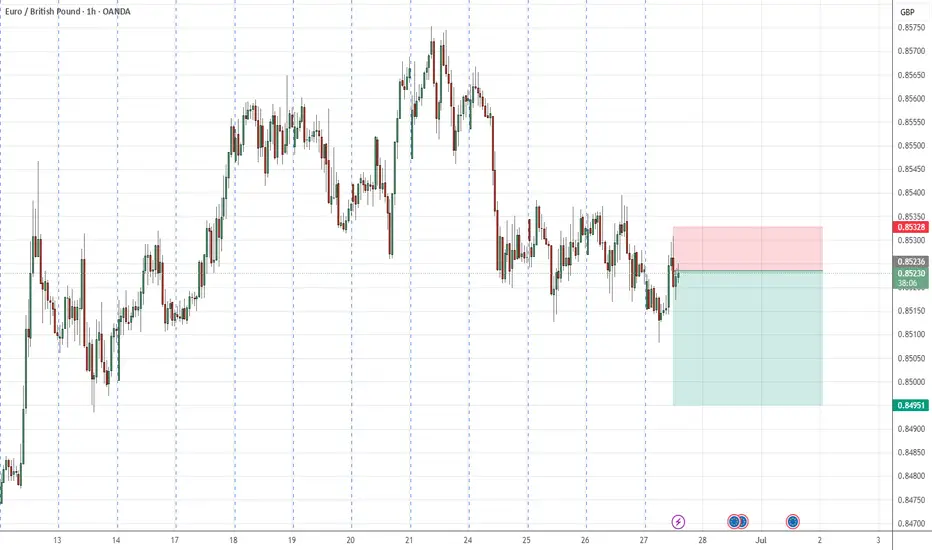
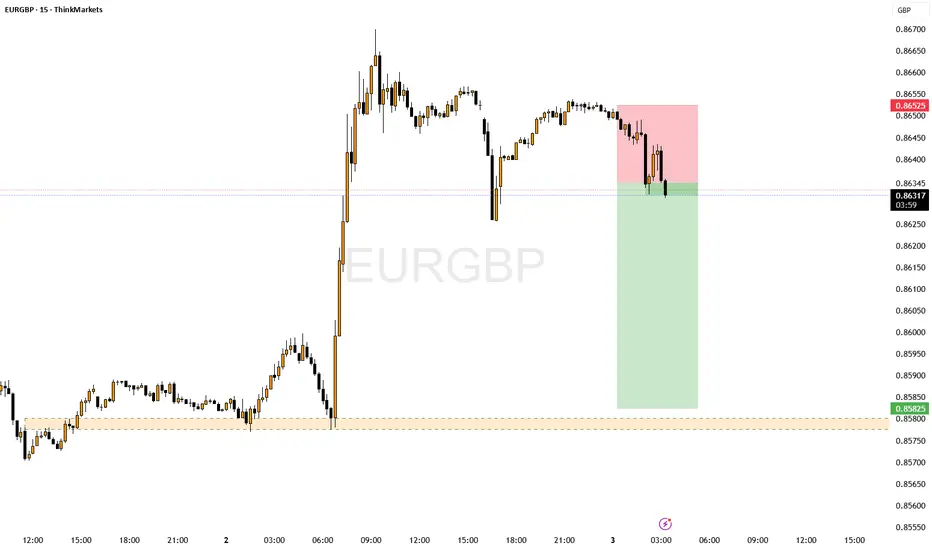
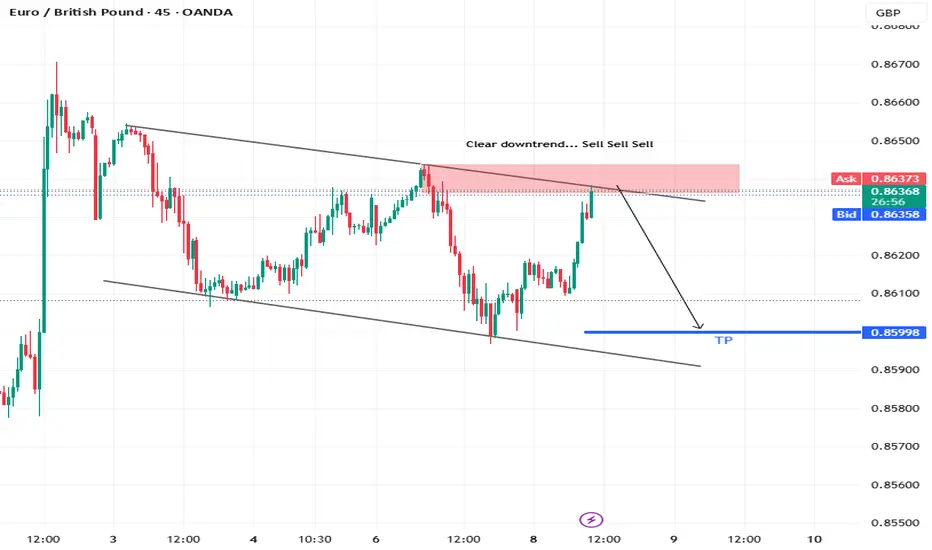
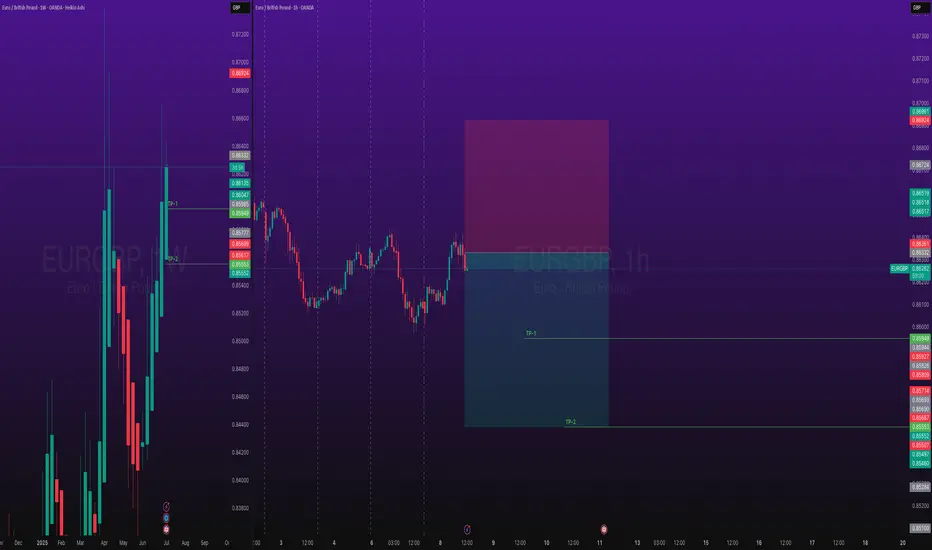
EURGBP Short Trade Risking 1% to make 1.3%OANDA:EURGBP Short swing trade, with my back testing of this strategy, it hits multiple possible take profits, manage your position accordingly.
Risking 1% to make 1.35%
Don't overload your risk like greedy, be disciplined trader, this is good trade.
Use proper risk management
Looks like good trade.
Lets monitor.
Use proper risk management.
Disclaimer: only idea, not advice
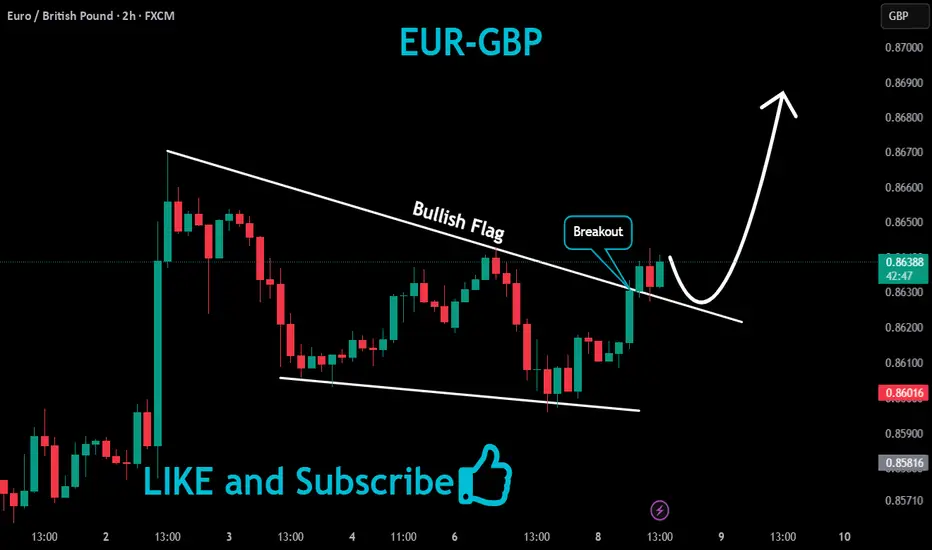
EURGBP Bullish Flag Pattern!
HI,Traders !
EURGBP is trading in an
Uptrend and made a bullish
Breakout out of bullish flag
Pattern so we are
Bullish biased and we
Will be expecting a
Further bullish move up !
Comment and subscribe to help us grow !
EURGBP uptrend support retest at 0.8600The EURGBP remains in a bullish trend, with recent price action showing signs of a corrective pullback within the broader uptrend.
Support Zone: 0.8600 – a key level from previous consolidation. Price is currently testing or approaching this level.
A bullish rebound from 0.8600 would confirm ongoing upside momentum, with potential targets at:
0.8670 – initial resistance
0.8700 – psychological and structural level
0.8720 – extended resistance on the longer-term chart
Bearish Scenario:
A confirmed break and daily close below 0.8600 would weaken the bullish outlook and suggest deeper downside risk toward:
0.8590 – minor support
0.8570 – stronger support and potential demand zone
Outlook:
Bullish bias remains intact while the EURGBP holds above 0.8600. A sustained break below this level could shift momentum to the downside in the short term.
This communication is for informational purposes only and should not be viewed as any form of recommendation as to a particular course of action or as investment advice. It is not intended as an offer or solicitation for the purchase or sale of any financial instrument or as an official confirmation of any transaction. Opinions, estimates and assumptions expressed herein are made as of the date of this communication and are subject to change without notice. This communication has been prepared based upon information, including market prices, data and other information, believed to be reliable; however, Trade Nation does not warrant its completeness or accuracy. All market prices and market data contained in or attached to this communication are indicative and subject to change without notice.
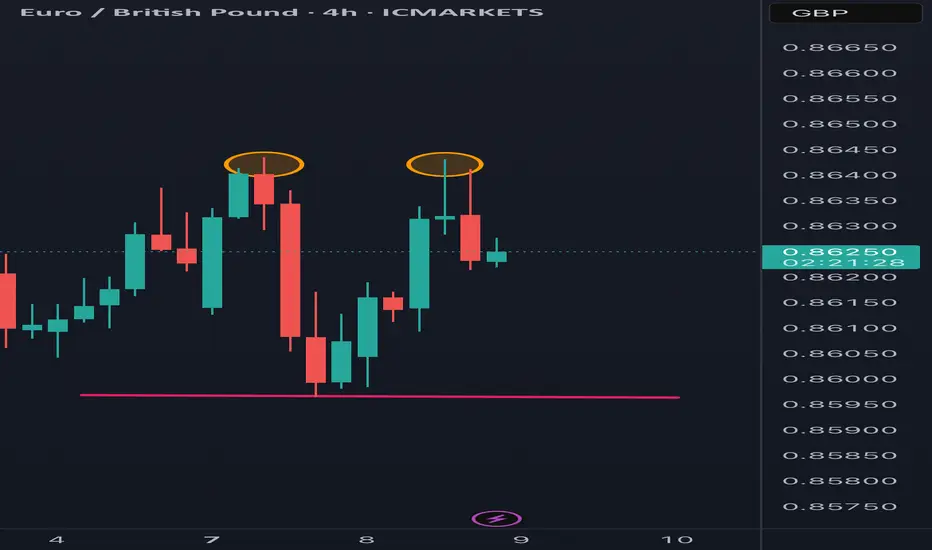
Double top pattern gives selling opportunity-ForexbdA double top pattern has formed on the EURGBP H-4 timeframe. If the price breaks the neckline of this pattern, the market will go into a downtrend.
⭕️Risk Warning : Trading on financial markets carries risks!
©FXBD Official Team