19.06.25 Morning ForecastPairs on Watch -
FX:EURGBP
FX:EURAUD
FX:AUDNZD
A short overview of the instruments I am looking at for today, multi-timeframe analysis down to what I will be looking at for an entry. Enjoy!
EURGBP trade ideas

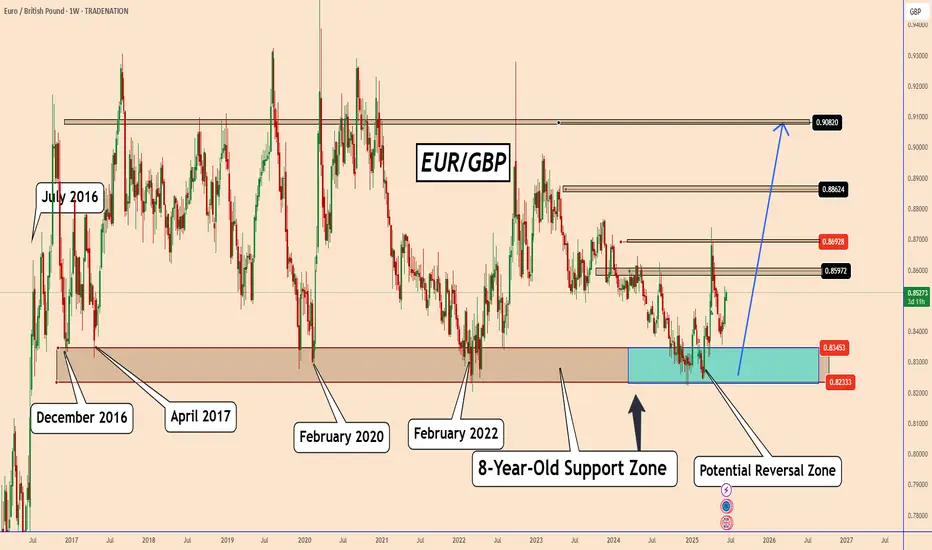
EURGBP: A Bullish Weekly OutlookEURGBP: A Bullish Weekly Outlook
This is an analysis I shared last months from a weekly perspective. The chart shows that the price increased by approximately 500 pips.
EURGBP tested an old weekly support zone that has consistently proven strong over time. Once again, the price reacted well, though it remains hesitant to extend its rise. However, bullish pressure is evident each time the price dips into the blue zone.
In May, this area was tested again, and EURGBP responded clearly, reinforcing the significance of this support. Historically, EURGBP has tested this zone in 2016, 2017, 2020, and 2022, each time showing notable reactions.
Following the start of an uptrend, EURGBP has previously gained between 400 to 900 pips, highlighting the potential strength of future movements.
You may find more details in the chart!
Thank you and Good Luck!
❤️PS: Please support with a like or comment if you find this analysis useful for your trading day❤️
Disclosure: I am part of Trade Nation's Influencer program and receive a monthly fee for using their TradingView charts in my analysis.
Previous analysis:
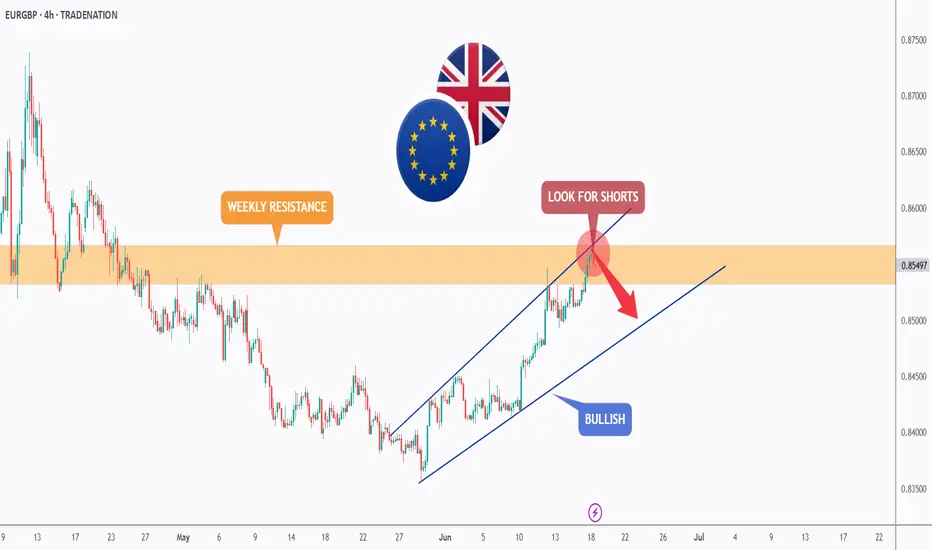
EURGBP - Bullish No More!Hello TradingView Family / Fellow Traders. This is Richard, also known as theSignalyst.
📈 EURGBP has been overall bullish trading within the rising channel marked in blue. And it is currently retesting the upper bound of the channel.
Moreover, the orange zone is a strong weekly resistance.
🏹 Thus, the highlighted red circle is a strong area to look for sell setups as it is the intersection of the upper blue trendline and resistance.
📚 As per my trading style:
As #EURGBP is around the red circle zone, I will be looking for bearish reversal setups (like a double top pattern, trendline break , and so on...)
📚 Always follow your trading plan regarding entry, risk management, and trade management.
Good luck!
All Strategies Are Good; If Managed Properly!
~Rich
Disclosure: I am part of Trade Nation's Influencer program and receive a monthly fee for using their TradingView charts in my analysis.
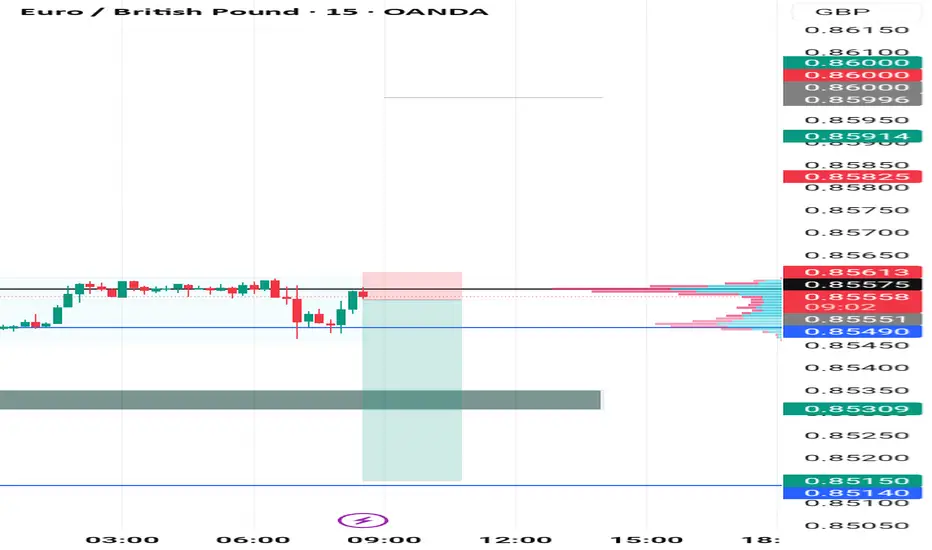
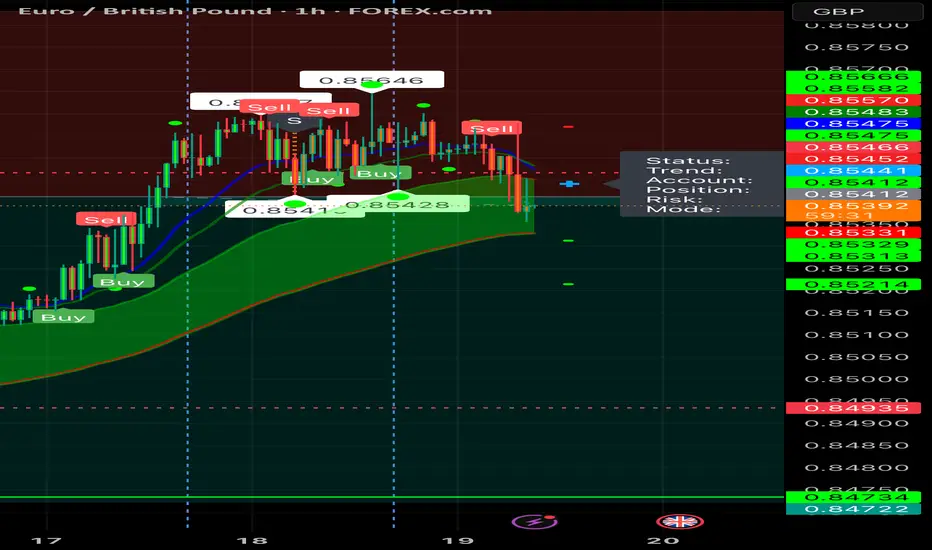
EURGBP draws a false breakoutExit from consolidation provokes distribution and price growth by 1%, the daily ATR is exhausted. The currency pair is forming a false breakout of resistance. The retest of the zone of interest 0.8526 and price consolidation below the level may provoke distribution
Scenario: there is no potential for growth continuation beyond 0.8538. The distribution ends with a false break of resistance and price entry into the selling zone. Consolidation under 0.8526 will confirm the break of the structure, which may be the first step towards 0.8482 or 0.8458.

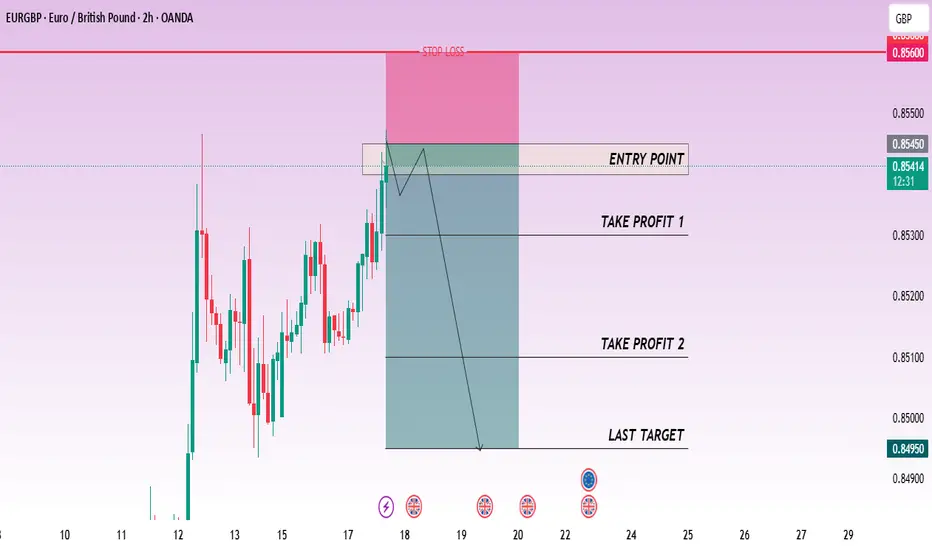
CHECK EURGBP SIGNAL READ CAPTAINeurgbp sell now ✅
entry point (0.85450) (0.85400)
TAKE PROFIT 1: (0.85300)
TAKE PROFIT 2: (0.85100)
LAST TARGET (0.84950)
STOP LOSS (0.85600)
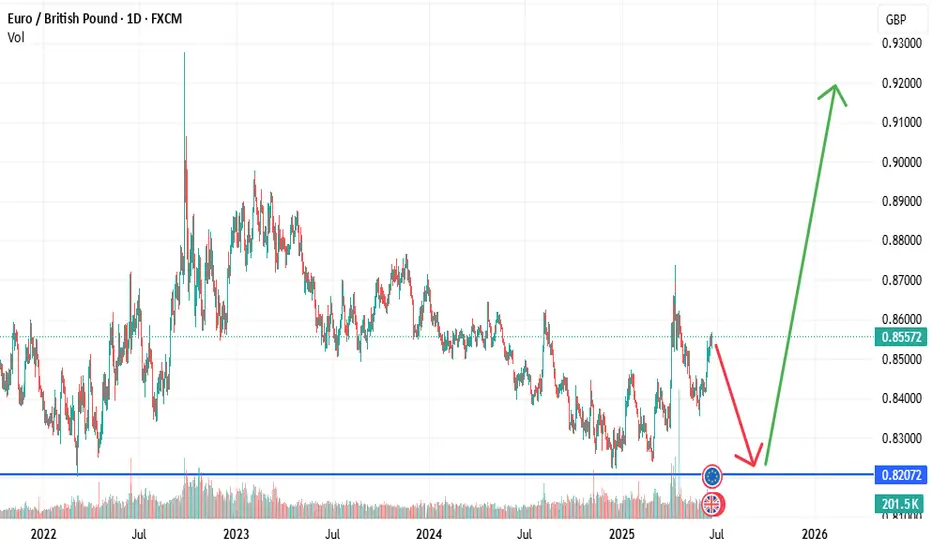
EurGbp | Short and then Long | Confirm Trends The BoE held interest rates as expected last month, but they did deliver a shock vote split. Three members of the vote-setting committee voted to cut rates by 0.25%, which was more than expected, with 6 voting to keep rates on hold.
The BOE’s statement that accompanied the decision also stressed the disinflation in the UK’s economy in recent years, and the weakness in the economy, along with the loosening in the labour market. The Bank noted the ‘two-sided risks to inflation’ but continued to say that a ‘gradual and careful approach’ to rate cuts remains appropriate.
EURGBP: Bearish Forecast & Outlook
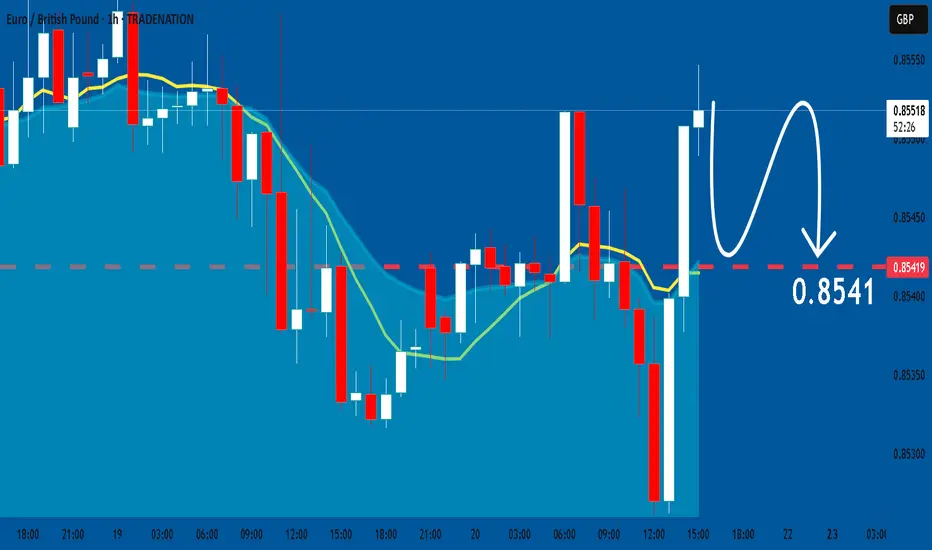
The charts are full of distraction, disturbance and are a graveyard of fear and greed which shall not cloud our judgement on the current state of affairs in the EURGBP pair price action which suggests a high likelihood of a coming move down.
Disclosure: I am part of Trade Nation's Influencer program and receive a monthly fee for using their TradingView charts in my analysis.
❤️ Please, support our work with like & comment! ❤️
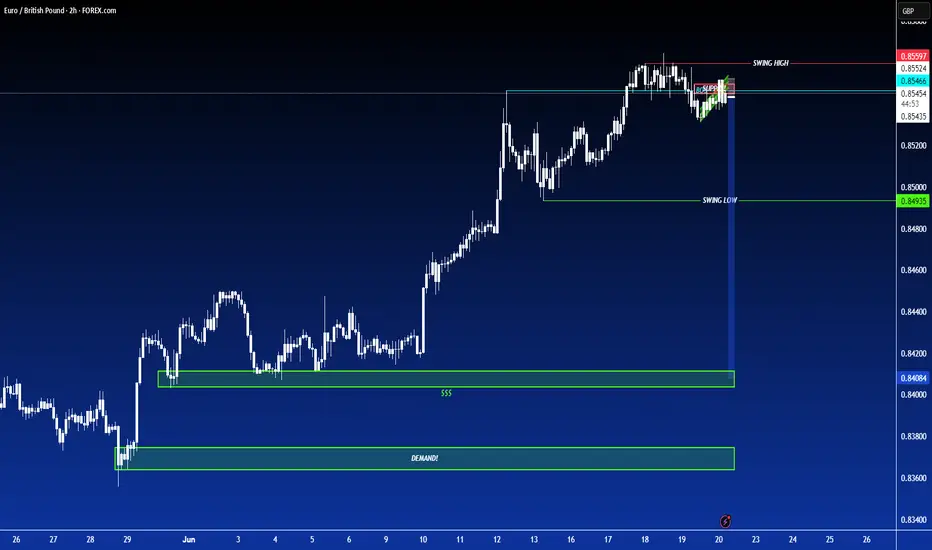
EURGBP Sell Opportunity Am looking at a sell opportunity on EURGBP
Entry: 0.85551
Sl: 0.85620
TP: 0.85150
Comment your opinion
For fund management. DM on X @shajudeakinoba1
EURGBP Bearish signal (Quick intra day trade) scalp trade only4H down trend 1H, M15, 5M
LL created, waiting for a LH to form at 50% Fib level
We will like to see price action formation e.g 50 ema rejecting price, bearish engulfing candle
or a long wick rejecting this resistance level and the 50% fib level
The more confirmations the better.

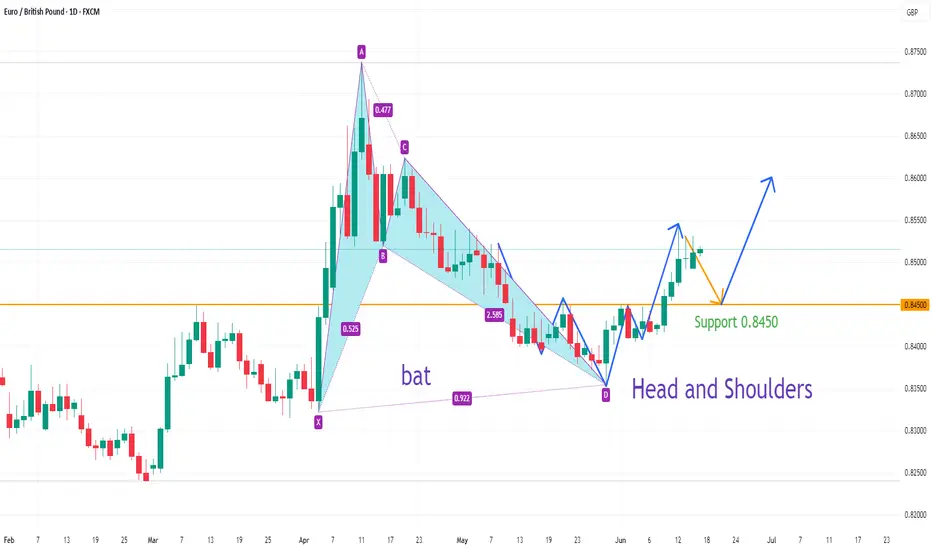
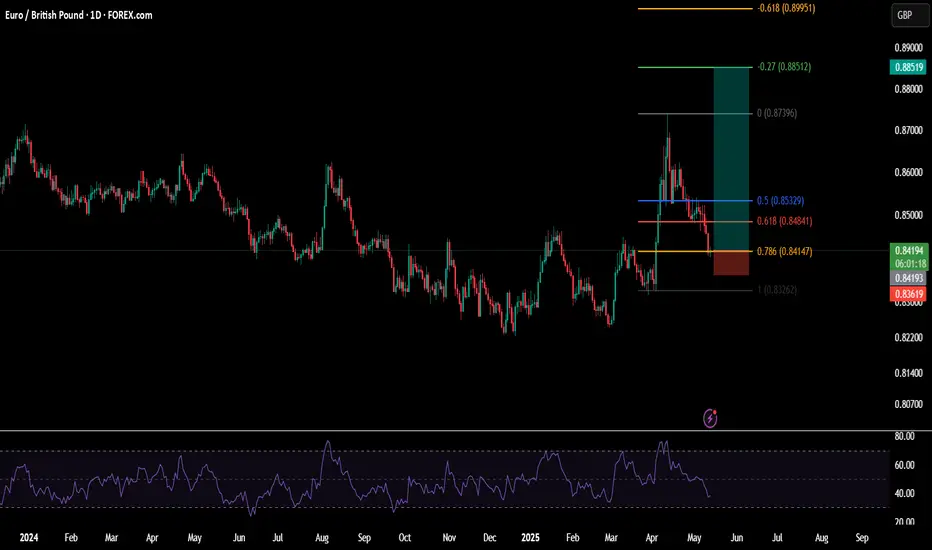
EURGBP upside target 0.8600On the daily chart, EURGBP stabilized after the bullish bat pattern. At the same time, the current market formed a head and shoulders bottom pattern. At present, we can pay attention to the support near 0.8450. If it falls back and does not break, it is expected to continue to rise, and the upward target is around 0.8600.
SHORT ON EUR/GPBWe have a rising channel (bearish reversal chart pattern) at a major level of resistance (confluence)
Price has given us a breakout of the channel to the downside and is currently respecting resistance.
I will be selling EUR/GBP to the next support level looking to catch over 120 pips.

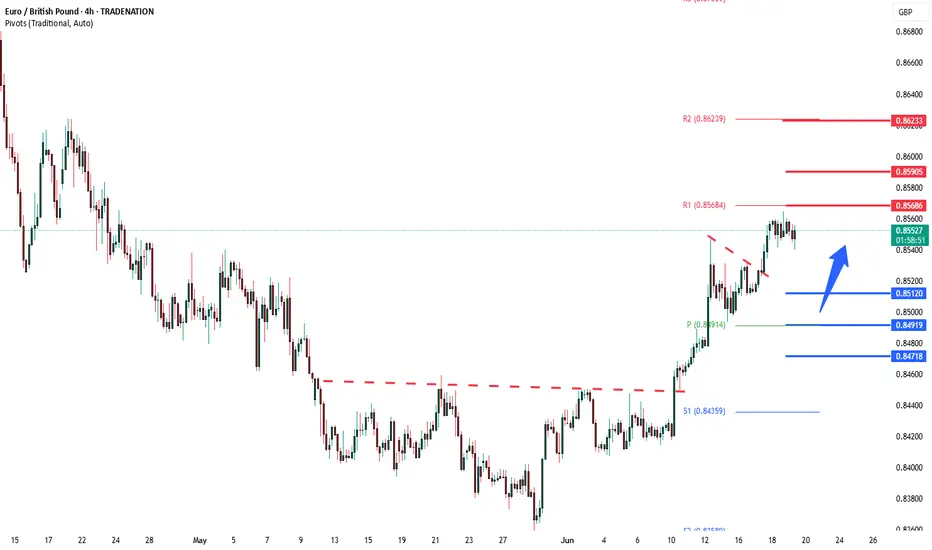
EURGBP uptrend pause supported at 0.8510Trend Overview:
EURGBP remains in a bullish trend, characterised by higher highs and higher lows. The recent intraday price action is forming a continuation consolidation pattern, suggesting a potential pause before a renewed move higher.
Key Technical Levels:
Support: 0.8510 (primary pivot), followed by 0.8490 and 0.8470
Resistance: 0.8570 (initial), then 0.8590 and 0.8620
Technical Outlook:
A pullback to the 0.8510 level, which aligns with the previous consolidation zone, could act as a platform for renewed buying interest. A confirmed bounce from this support may trigger a continuation toward the next resistance levels at 0.8570, 0.8590, and ultimately 0.8620.
Conversely, a daily close below 0.8510 would suggest weakening bullish momentum. This scenario would shift the bias to bearish in the short term, potentially targeting 0.8490 and 0.8470 as downside levels.
Conclusion:
WTI Crude Oil maintains a bullish structure while trading above the 0.8510 support. A bounce from this level would validate the consolidation as a continuation pattern, with upside potential toward the 08570 area. A breakdown below 0.8510, however, would invalidate this view and suggest deeper corrective risk.
This communication is for informational purposes only and should not be viewed as any form of recommendation as to a particular course of action or as investment advice. It is not intended as an offer or solicitation for the purchase or sale of any financial instrument or as an official confirmation of any transaction. Opinions, estimates and assumptions expressed herein are made as of the date of this communication and are subject to change without notice. This communication has been prepared based upon information, including market prices, data and other information, believed to be reliable; however, Trade Nation does not warrant its completeness or accuracy. All market prices and market data contained in or attached to this communication are indicative and subject to change without notice
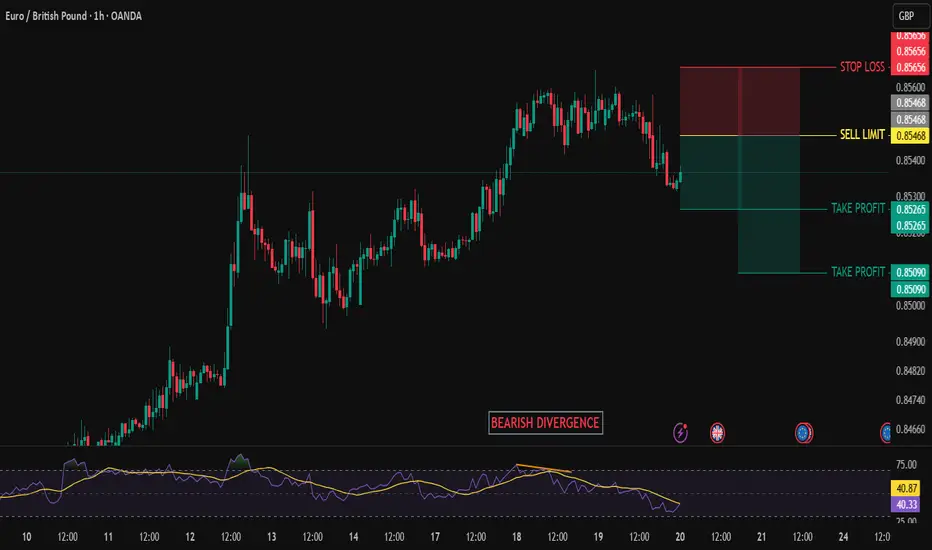
EURGBP BEARISH SETUPEURGBP has been a bullish trend.
At rsi bearish divergence formed.
And also price break previous HL, i would like to take entry with sell limit order at fib level 0.382.
Manage your trade accordingly.
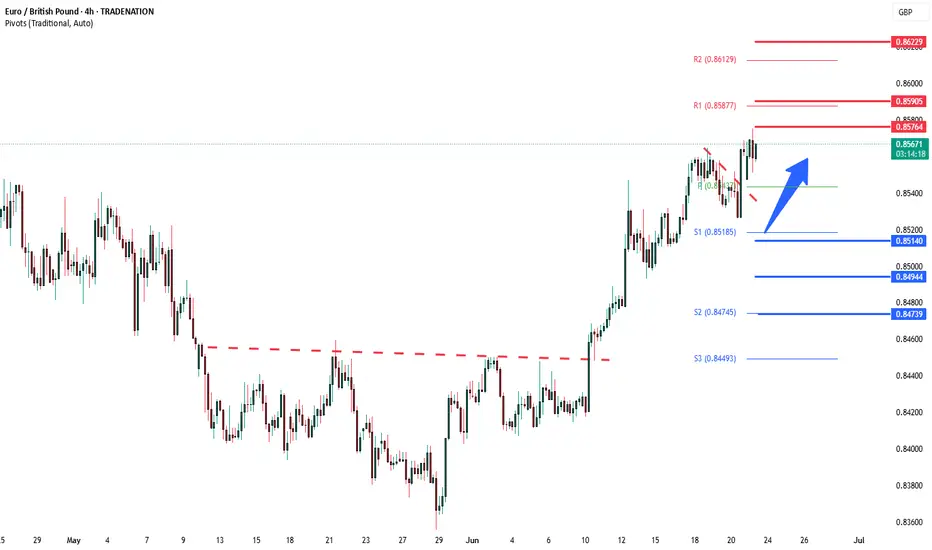
EURGBP INTRADAY Bullish breakout supported at 0.8510Trend Overview:
EURGBP remains in a bullish trend, characterised by higher highs and higher lows. The recent intraday price action is forming a continuation consolidation pattern, suggesting a potential pause before a renewed move higher.
Key Technical Levels:
Support: 0.8510 (primary pivot), followed by 0.8490 and 0.8470
Resistance: 0.8570 (initial), then 0.8590 and 0.8620
Technical Outlook:
A pullback to the 0.8510 level, which aligns with the previous consolidation zone, could act as a platform for renewed buying interest. A confirmed bounce from this support may trigger a continuation toward the next resistance levels at 0.8570, 0.8590, and ultimately 0.8620.
Conversely, a daily close below 0.8510 would suggest weakening bullish momentum. This scenario would shift the bias to bearish in the short term, potentially targeting 0.8490 and 0.8470 as downside levels.
Conclusion:
WTI Crude Oil maintains a bullish structure while trading above the 0.8510 support. A bounce from this level would validate the consolidation as a continuation pattern, with upside potential toward the 08570 area. A breakdown below 0.8510, however, would invalidate this view and suggest deeper corrective risk.
This communication is for informational purposes only and should not be viewed as any form of recommendation as to a particular course of action or as investment advice. It is not intended as an offer or solicitation for the purchase or sale of any financial instrument or as an official confirmation of any transaction. Opinions, estimates and assumptions expressed herein are made as of the date of this communication and are subject to change without notice. This communication has been prepared based upon information, including market prices, data and other information, believed to be reliable; however, Trade Nation does not warrant its completeness or accuracy. All market prices and market data contained in or attached to this communication are indicative and subject to change without notice
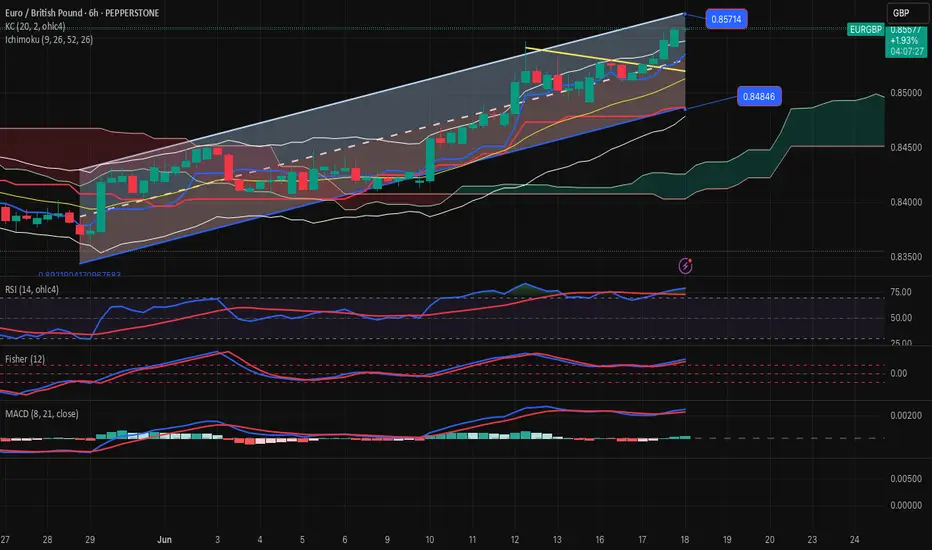
EURGBP-SELL Strategy 6 hourly chart Reg. ChannelThe pair is slightly overbought, and we are nearing the top of the channel. Indicators are not as yet negative, however, it feels we may have seen near the top for now, and it may be worthwhile to start scaling in on SELL side slowly.
Strategy SELL @ 0.8550-0.8575 and take profit near 0.8463 for now.
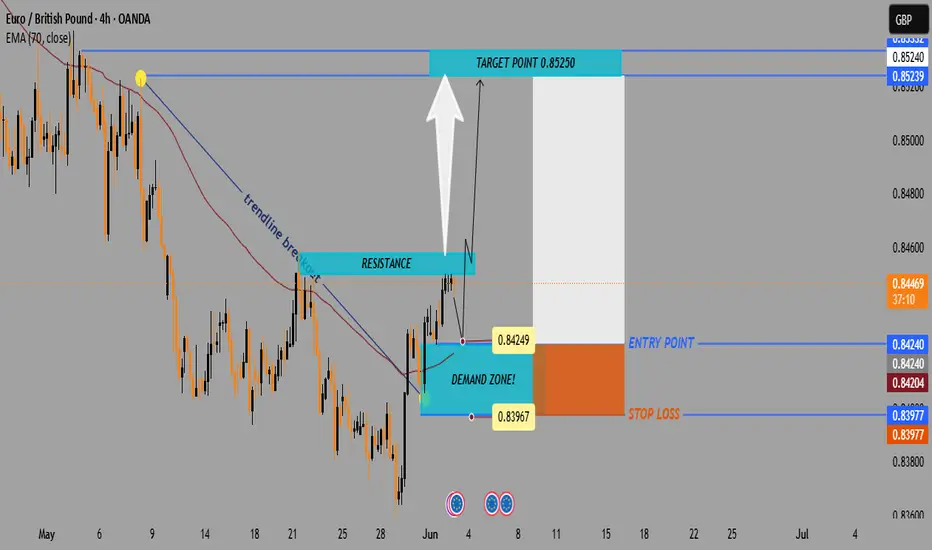
EUR/GBP 4H Bullish Breakout Trade Setup – Demand Zone to 0.85250📉 Trendline Break
🔵 A key trendline was broken 🔽 (bearish ➡️ bullish shift).
✂️ This break signals potential upside movement as sellers lose control.
🟦 Demand Zone (BUY Area)
📍 Zone: 0.83967 – 0.84249
🛒 Buyers expected here!
🟢 Price may pull back here before heading up.
🟡 This is marked as the ENTRY POINT zone.
🔴 Stop Loss Zone
📍 Level: 0.83977
❌ Place stop loss just below the demand zone.
🛡️ Protects against downside breakout risk.
🟧 Resistance Zone
📍 Around: 0.84500 – 0.84600
⚠️ Price may face resistance temporarily before continuing the upward move.
📏 Testing this area confirms strength.
🟩 Target Zone
🎯 Target Point: 0.85250
💸 If the trade plays out, this is where profit is expected.
🚀 Bullish target above the resistance zone.
✅ Trade Setup Summary
🧩 Details
🟦 Entry 0.84240 (inside demand zone)
🔴 Stop Loss 0.83977 (below demand zone)
🟩 Target 0.85250 (above resistance)
📈 R/R Ratio ~1:4 (great risk/reward!)
🔍 Final Outlook:
🟠 Watch for: Pullback to entry zone
🟢 Then look for: Bullish candlestick confirmation
🚀 Goal: Ride it up to 0.85250 with strong momentum
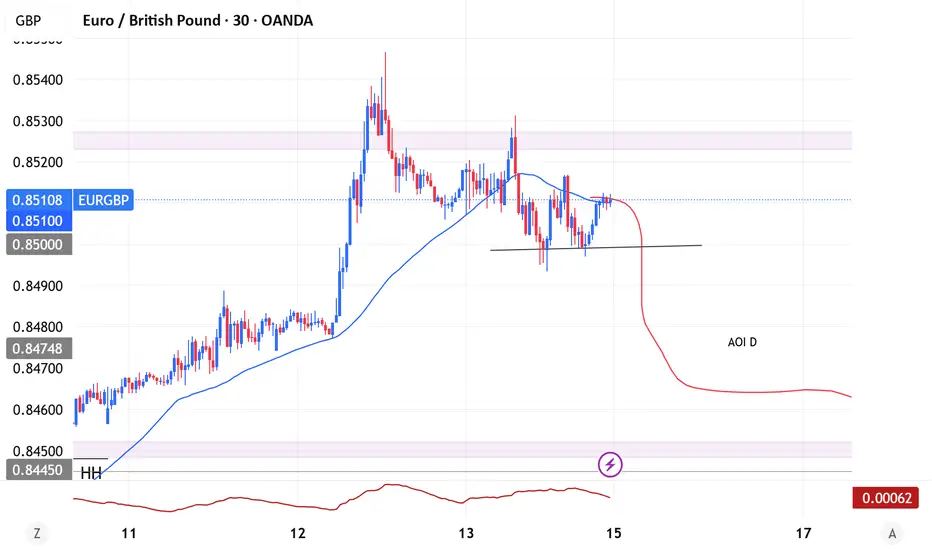
EUR/GBP 4H Technical Analysis📊 EUR/GBP 4H Technical Analysis
EUR/GBP is currently in a clear uptrend, forming consecutive higher highs (HH) and higher lows. Price is trading above the 50 EMA, which is acting as dynamic support and confirming bullish momentum.
🔻 After reaching a recent high near 0.8510, the pair is now pulling back. A key Area of Interest (AOI D) is identified between 0.8450–0.8475, aligning with:
Previous structure (resistance turned support)
The rising 50 EMA
Demand zone from earlier consolidation
📈 A bullish reaction is expected from this zone, with potential continuation toward new highs above 0.8550.
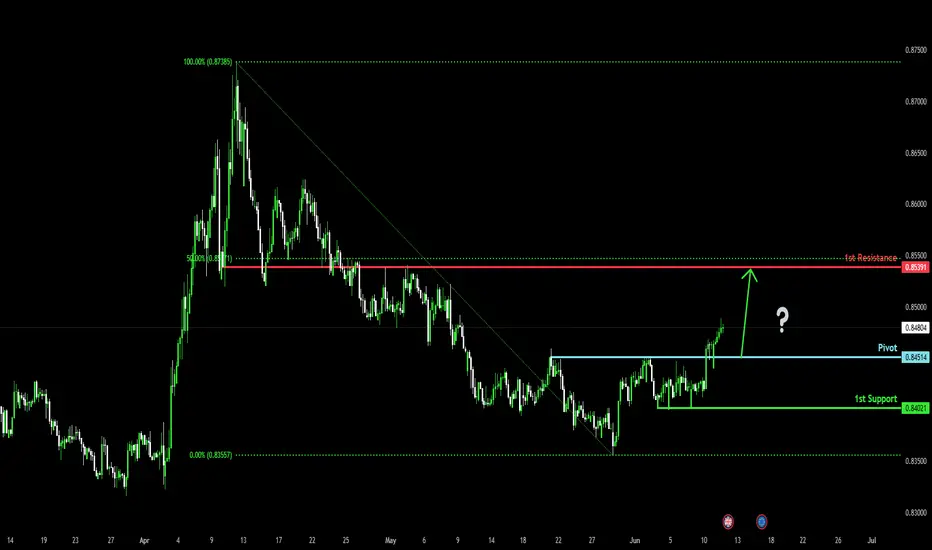
Bullish rise?EUR/GBP has reacted off the pivot and could rise to the 1st resistance.
Pivot: 0.8451
1st Support: 0.8402
1st Resistance: 0.8539
Risk Warning:
Trading Forex and CFDs carries a high level of risk to your capital and you should only trade with money you can afford to lose. Trading Forex and CFDs may not be suitable for all investors, so please ensure that you fully understand the risks involved and seek independent advice if necessary.
Disclaimer:
The above opinions given constitute general market commentary, and do not constitute the opinion or advice of IC Markets or any form of personal or investment advice.
Any opinions, news, research, analyses, prices, other information, or links to third-party sites contained on this website are provided on an "as-is" basis, are intended only to be informative, is not an advice nor a recommendation, nor research, or a record of our trading prices, or an offer of, or solicitation for a transaction in any financial instrument and thus should not be treated as such. The information provided does not involve any specific investment objectives, financial situation and needs of any specific person who may receive it. Please be aware, that past performance is not a reliable indicator of future performance and/or results. Past Performance or Forward-looking scenarios based upon the reasonable beliefs of the third-party provider are not a guarantee of future performance. Actual results may differ materially from those anticipated in forward-looking or past performance statements. IC Markets makes no representation or warranty and assumes no liability as to the accuracy or completeness of the information provided, nor any loss arising from any investment based on a recommendation, forecast or any information supplied by any third-party.
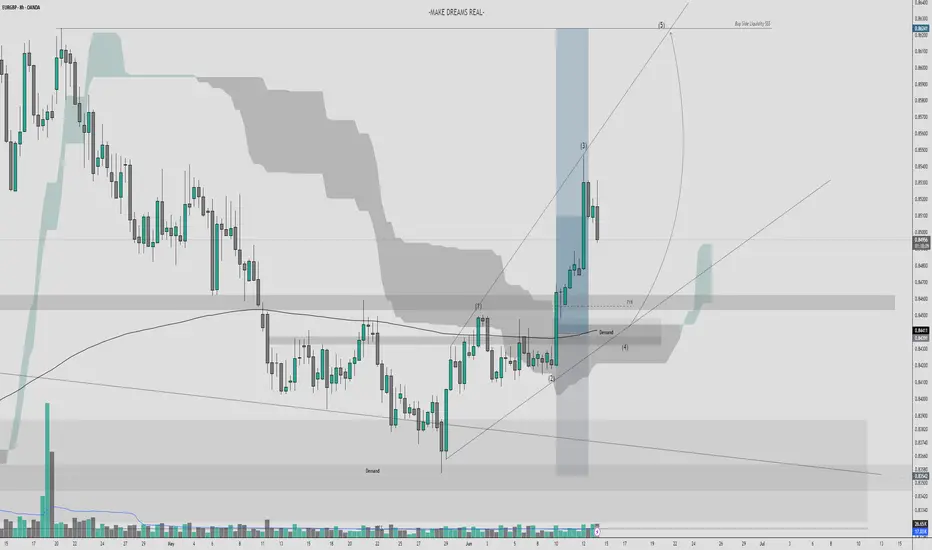
EUR/GBP 8H Buy Setup (Free Trade)📍 EUR/GBP 8H Buy Setup
Price just tapped into a clear demand zone at the 71% Fibonacci retracement — textbook wave (4) retrace in a bullish Elliott sequence. This is also our Point of Interest (POI) to catch the next leg higher into wave (5), targeting buy-side liquidity.
🟢 Confluences:
Demand zone respected
71% Fib retracement
Ichimoku Kumo twist → bullish confirmation
Structure break + strong impulsive wave (3)
🔔 Buying from here offers a clean R:R back to the highs. Let’s ride this final wave!
EURGBP BUY?Market is reacting to Fib area on Weekly time frame. Based on 4HR TF, the market seems to be forming a possible reversal pattern which could lead to a possible reversal.
We could see BUYERS coming in strong should the current level hold.
Disclaimer:
Please be advised that the information presented on TradingView is solely intended for educational and informational purposes only.The analysis provided is based on my own view of the market. Please be reminded that you are solely responsible for the trading decisions on your account.
High-Risk Warning
Trading in foreign exchange on margin entails high risk and is not suitable for all investors. Past performance does not guarantee future results. In this case, the high degree of leverage can act both against you and in your favor
EURGBP: Overbought Market & Pullback🇪🇺🇬🇧
EURGBP nicely respected a key daily horizontal resistance.
After a liquidity grab above that, the price formed
a strong bearish imbalance candle on an hourly time frame.
I think that the pair will retrace to 0.85
❤️Please, support my work with like, thank you!❤️
I am part of Trade Nation's Influencer program and receive a monthly fee for using their TradingView charts in my analysis.
