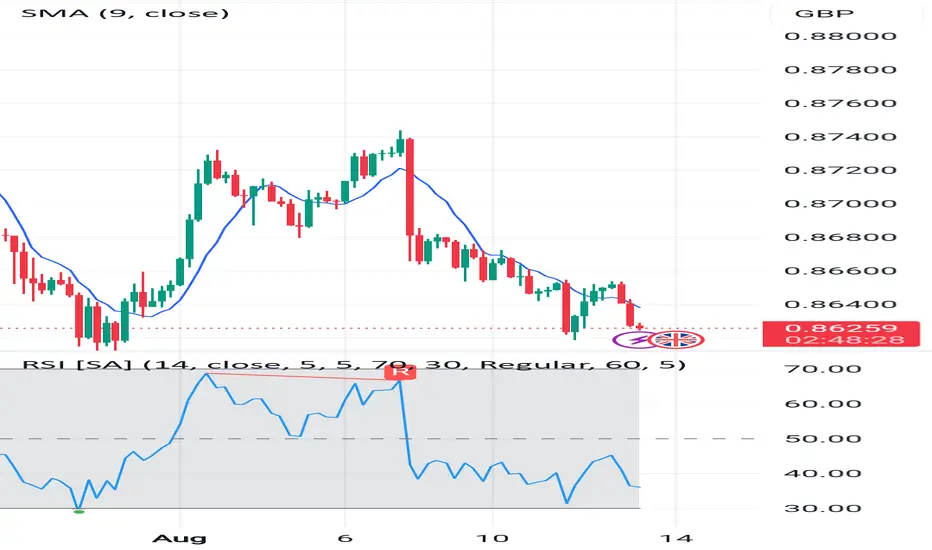
The pair is currently in a clear downtrend.Price is trading below the 9-period SMA, indicating strong bearish momentum.
Recent candles show consecutive lower highs and lower lows.
Support & Resistance
Immediate Support: 0.8620 – If broken, the next key support lies near 0.8600 psychological level.
Immediate Resistance: 0.8645 (recent minor swing high) and 0.8680 (major resistance area).
RSI (Relative Strength Index) – 14
Current RSI is hovering near 35, suggesting the market is approaching oversold territory but not yet deeply oversold.
Past RSI behavior shows bearish divergence earlier in August, confirming selling pressure.
Price Action
Strong bearish candles indicate sellers remain in control.
Short-term pullbacks have been limited, with sellers stepping in at the SMA9 resistance.
No bullish reversal patterns are visible yet on the 4H chart.
Market Sentiment
Bias remains bearish as long as price stays below 0.8645.
Weakness in EUR compared to GBP is consistent with recent movement.
Possible Scenarios
Bearish Continuation:
If price breaks below 0.8620, expect a move toward 0.8600 and possibly 0.8580.
Bullish Reversal:
A break and close above 0.8645 with strong volume could target 0.8680.
Trading Plan
For Bears (Short Setup):
Entry: 0.8620 break
TP1: 0.8600
TP2: 0.8580
SL: Above 0.8645
For Bulls (Long Setup):
Entry: Above 0.8645 close
TP1: 0.8680
TP2: 0.8720
SL: Below 0.8620
Summary:
EUR/GBP is in a strong bearish trend with sellers dominating. RSI is nearing oversold, so a short-term pullback is possible, but until price breaks above 0.8645, downside pressure is likely to continue.
EURGBP trade ideas
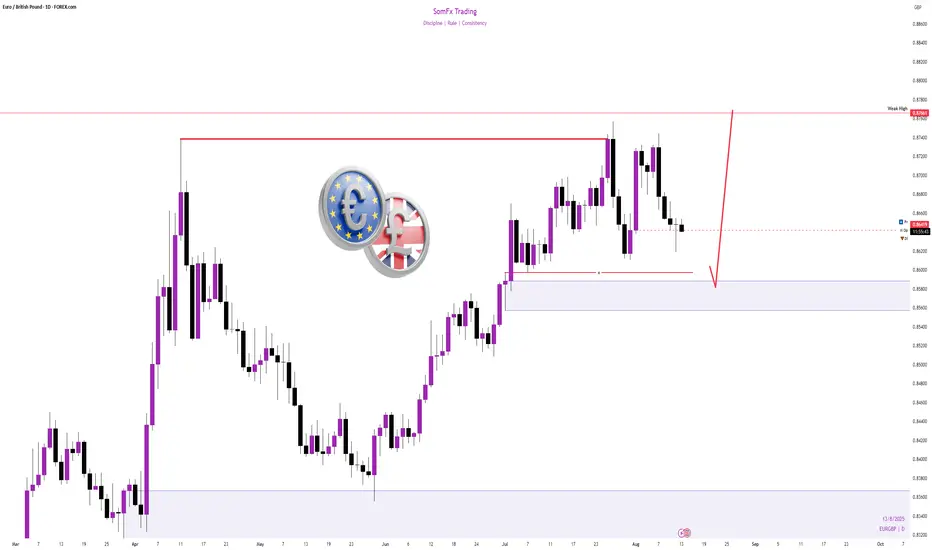
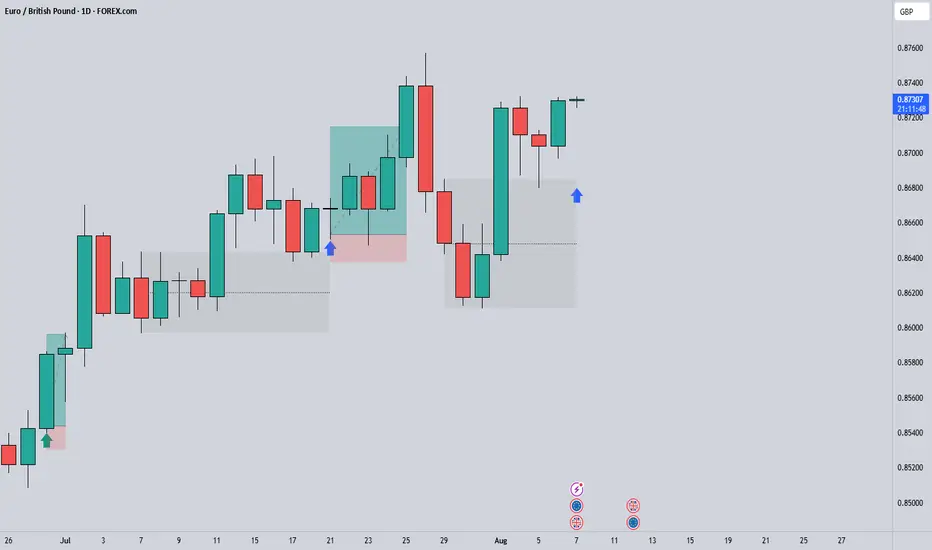
CONTINUATION TRADE EURGBPEURGBP has been Trending to the upside recently now we are looking for a continuation on the Daily Chart, we can clearly see that the market left a DEMAND Zone which qualifies for a strong demand area lets see and wait this demand.
The Day Ahead Economic Data
Japan: Producer prices rose 2.6% YoY (slowest in a year), machine tool orders up 3.6% YoY thanks to foreign demand.
Germany: Wholesale prices –0.1% MoM, +0.5% YoY.
Central Banks
Fed’s Barkin: Says consumers are key to inflation and jobs trends; rates seen as appropriate.
Goolsbee & Bostic: Speaking later today/week.
Earnings Highlights
Tencent: Results due; sentiment positive on low valuation.
Cisco: Reports later today; modest growth expected, AI demand in focus.
E.ON: H1 profit +13%, sales +5%; outlook confirmed, calls for better grid returns.
Venture Global: Q2 revenue tripled to $3.1B; strong LNG growth.
Straumann: Solid organic sales growth but FX hit profit; guidance unchanged.
Vestas: Back to profit; revenue +14%, orders –44%; guidance steady.
Coherent: Results due; AI networking driving growth.
This communication is for informational purposes only and should not be viewed as any form of recommendation as to a particular course of action or as investment advice. It is not intended as an offer or solicitation for the purchase or sale of any financial instrument or as an official confirmation of any transaction. Opinions, estimates and assumptions expressed herein are made as of the date of this communication and are subject to change without notice. This communication has been prepared based upon information, including market prices, data and other information, believed to be reliable; however, Trade Nation does not warrant its completeness or accuracy. All market prices and market data contained in or attached to this communication are indicative and subject to change without notice.
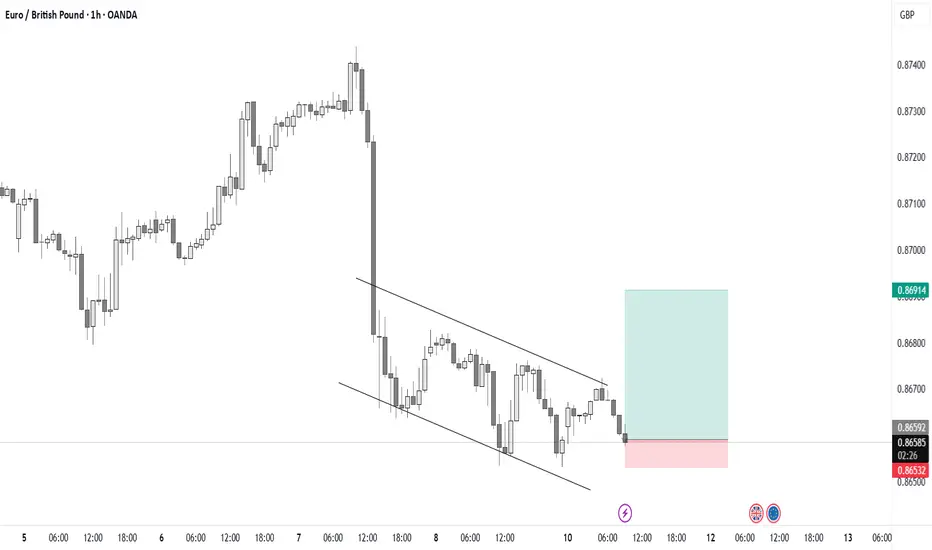
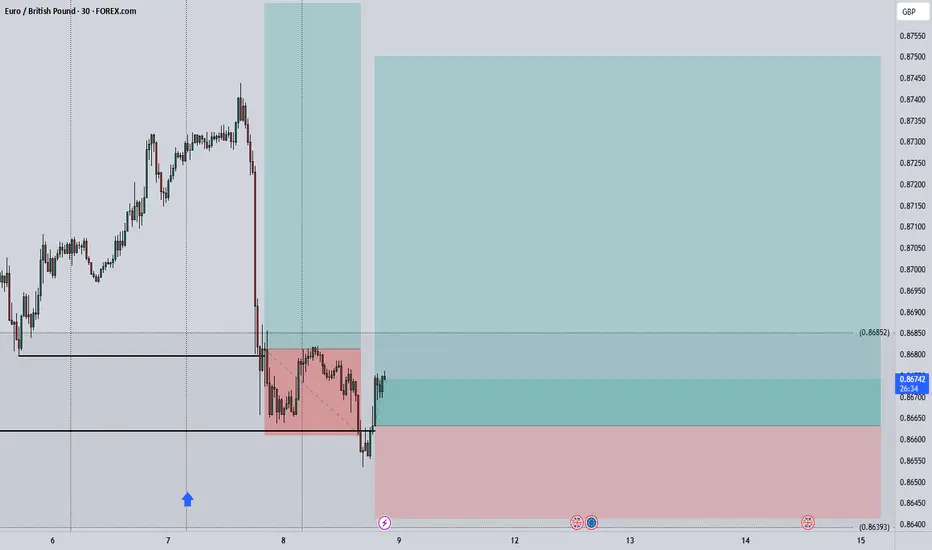
Buy EURGBPCounter trend trade opportunity on EURGBP. Price displays a falling channel pattern. Price will move up to fill up gaps created by the engulfing candle from last week.
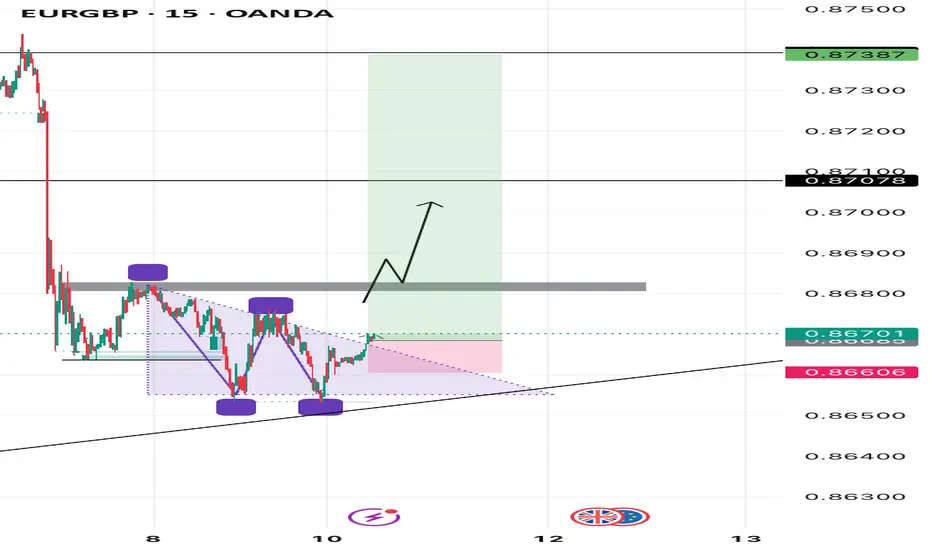
Long opportunity on EURGBP Let’s expect bulls to take over the EURGBP market since price has broken out of the descending wedge pattern while respecting the ascending trendline, with liquidity sweeps below previous lows followed by bullish momentum, I’m suggesting a potential push toward the next key resistance zone around 0.87078 and higher

EURGBP Long ProjectHi guys...😎
It's time to do a Long Project on EURGBP with 3 key reasons:
1. Price Drivers: Daily Demand
2. Trend: up
3. Momentum: bullish
Action: waiting for entry on the intraday timeframe (entry will be published further)
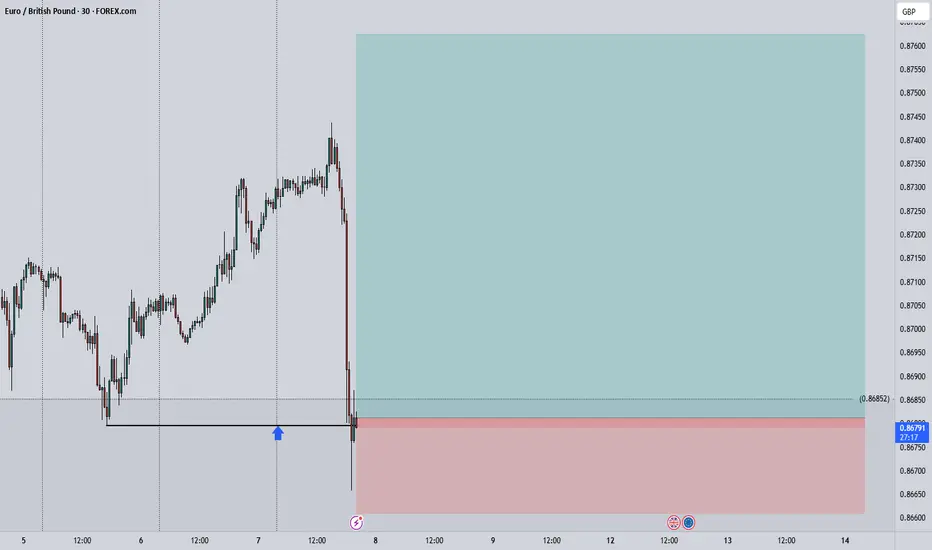
EURGBP 2nd Buy EntryEntry: 0.86633
Take Profit (4R): 0.87501
Stop Loss (R): 0.86416
*Sorry, I'm late to post due to being out of the computer
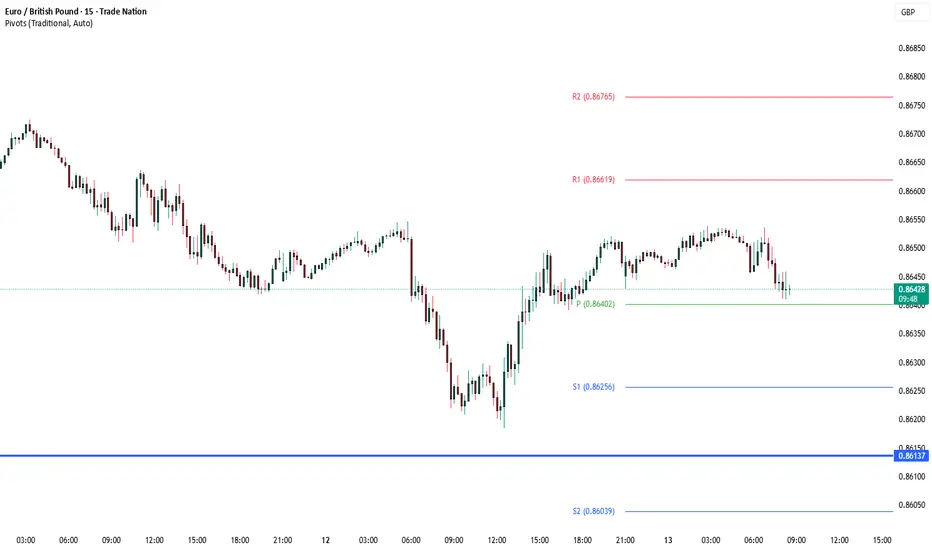
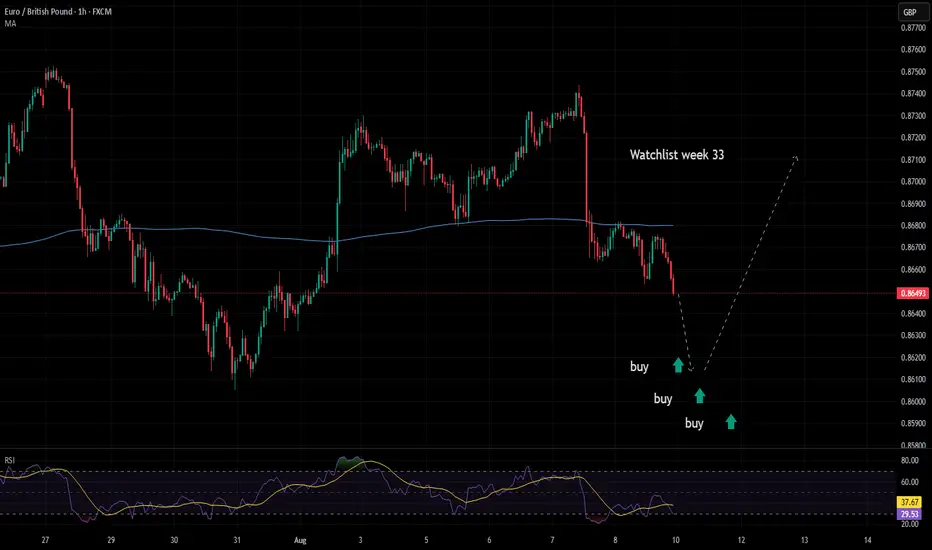
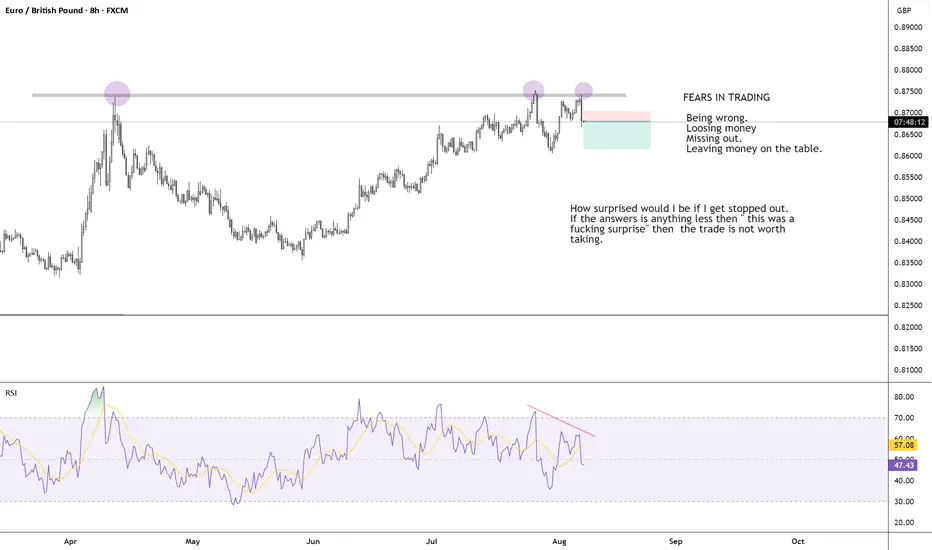
EURGBP 1 H longOnly chart I'm interested in next week, IF the price falls down like I want. otherwise I happy to skip this setup :)
What do I want to see? Like the start of the downtrend long red candles rushing to the support line. No consolidation. When that happens my buy orders are waiting at he the support line all the way down till the trend starts bullish again.
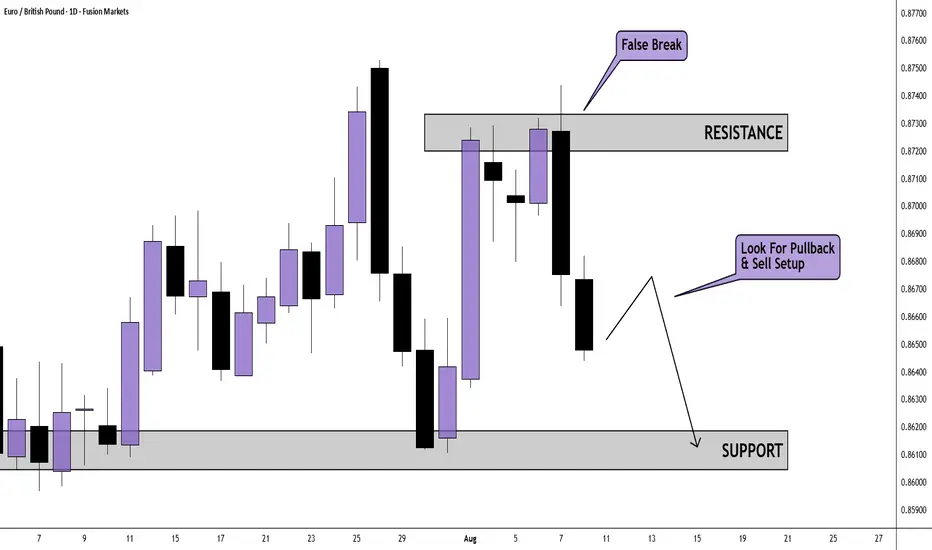
EUR/GBP Daily AnalysisPrice has rejected the 0.8730 zone after a couple of failed attempts from the buyers.
After 2 solid days of selling, we may see a temporary correction where there could be opportunities to sell at a higher price.
Support at 0.8610 may be a target aim for.
Look for a trade setup that meets your rules if you agree with this analysis.
EURGBP: Bullish Forecast & Bullish Scenario
The analysis of the EURGBP chart clearly shows us that the pair is finally about to go up due to the rising pressure from the buyers.
Disclosure: I am part of Trade Nation's Influencer program and receive a monthly fee for using their TradingView charts in my analysis.
❤️ Please, support our work with like & comment! ❤️

EURGBP Setup So Clear It Feels IllegalHey, it’s Skeptic.
Spotted a super clean breakout forming on EURGBP — and it lines up across multiple tools (RSI, 7SMA, momentum candles).
In this video, I’ll walk you through the daily trend, explain why I’m only looking for longs, and show the exact 15m trigger I’m watching.
No hype, no FOMO, just reason.
If it helps, boost it. Appreciate you 🫡
Disclaimer: This is not financial advice. Do your own research, manage your risk, and stay sharp out there.

The Day AheadFriday, August 8 – Summary
Data Highlights:
China: Released Q2 Balance of Payments (BoP) data for the current account, providing insight into trade and capital flows.
Japan: A data-heavy day with the July Economy Watchers Survey, bank lending figures, June household spending, and BoP data (both trade and current account balances), offering a comprehensive view of economic momentum and consumer behavior.
Canada: Published its July jobs report, closely watched for signs of labor market strength and implications for monetary policy.
Central Banks:
Federal Reserve: St. Louis Fed President Musalem delivered remarks, potentially offering forward guidance on rate paths or economic risks.
Bank of Japan: Released the Summary of Opinions from the July policy meeting, shedding light on internal policy debates and inflation outlooks.
Earnings:
Munich Re: Reported quarterly results, providing insight into the state of the reinsurance sector amid global catastrophe exposure.
Wendy’s: Posted earnings, reflecting consumer demand trends and cost pressures in the fast food sector.
This communication is for informational purposes only and should not be viewed as any form of recommendation as to a particular course of action or as investment advice. It is not intended as an offer or solicitation for the purchase or sale of any financial instrument or as an official confirmation of any transaction. Opinions, estimates and assumptions expressed herein are made as of the date of this communication and are subject to change without notice. This communication has been prepared based upon information, including market prices, data and other information, believed to be reliable; however, Trade Nation does not warrant its completeness or accuracy. All market prices and market data contained in or attached to this communication are indicative and subject to change without notice.

ENTRY EURGBPDisclaimer:
This is merely a chart-based analytical trading idea and is not considered investment advice. Please manage your risks carefully and conduct your own research before making any trading decisions.
EURGBP Short – Liquidity Grab & CHoCH at SupplyIf we go on tha W1 TF we see a significant price action From the Smart Money Concepts (SMC) perspective, this candlestick formation shows a classic example of how institutional traders manipulate liquidity to shift market direction. The strong bullish candle represents an inducement phase, where retail traders are encouraged to go long as price pushes higher. This creates buy-side liquidity above the recent high.
Following that, the next candle sharply wicks below the previous bullish candle’s low. This is a liquidity grab—smart money is targeting the sell-side liquidity (stop-losses of buyers) resting just below that low. Even though price briefly breaks down, it closes higher, signaling that the move down was not genuine but rather a manipulation to trap retail traders.
The third candle then confirms a change in momentum. It fails to make a new high and closes bearish, indicating a possible shift in market structure. At this point, the bullish trend has likely been broken, and smart money is now preparing to sell after accumulating positions from retail traders. This change of character marks the beginning of a potential bearish move.
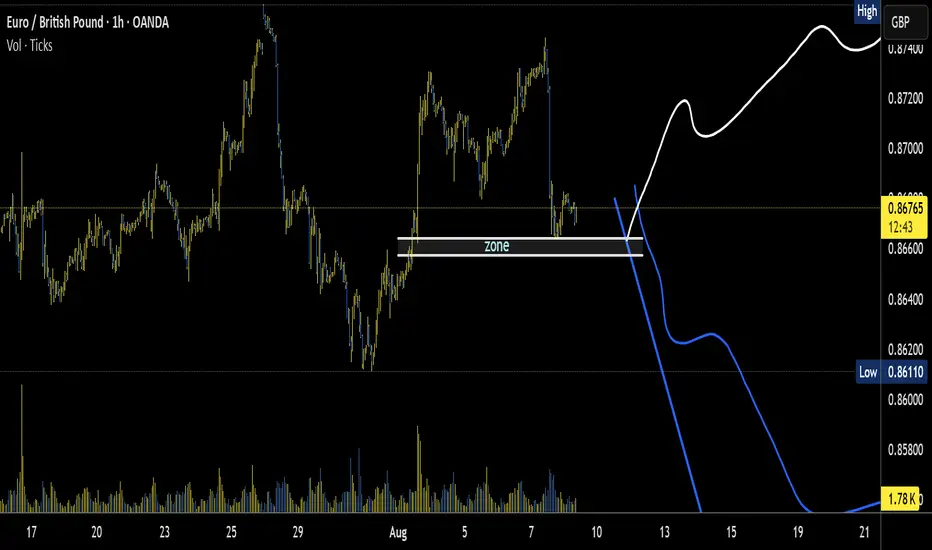
EURGBP EURGBP- 2 main roadmaps. ABC and abc structures could be complete. decision can be made on a high probability entry signal at zone.
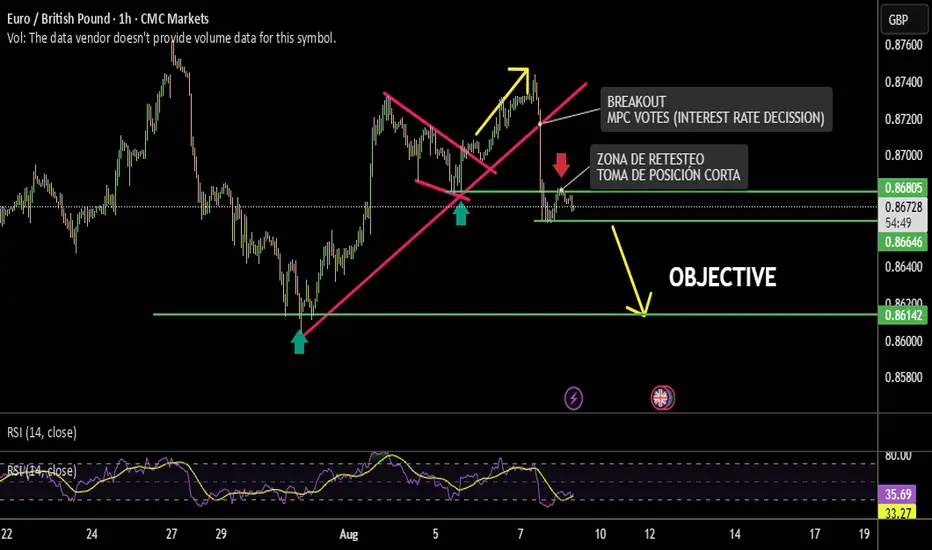
EUR/GBP SHORT - SELL IDEAWe took advantage of the long position shared earlier on EUR/GBP 💰, and now the trend has shifted — we're currently shorting 📉.
🗞 Yesterday, the Bank of England cut interest rates from 4.25% to 4.00% 🇬🇧.
The decision wasn’t unanimous among the 9 members of the Monetary Policy Committee (MPC): 5 voted in favor of the cut and 4 against, whereas markets had expected a much stronger majority of 8 to 1.
Let see if this will work out.Triple top, RSI divergence and strong news with huge engulfing bearish candle. Hope to get a pullback to that lower lever but everything is possible as always. I have took risk on this trade.
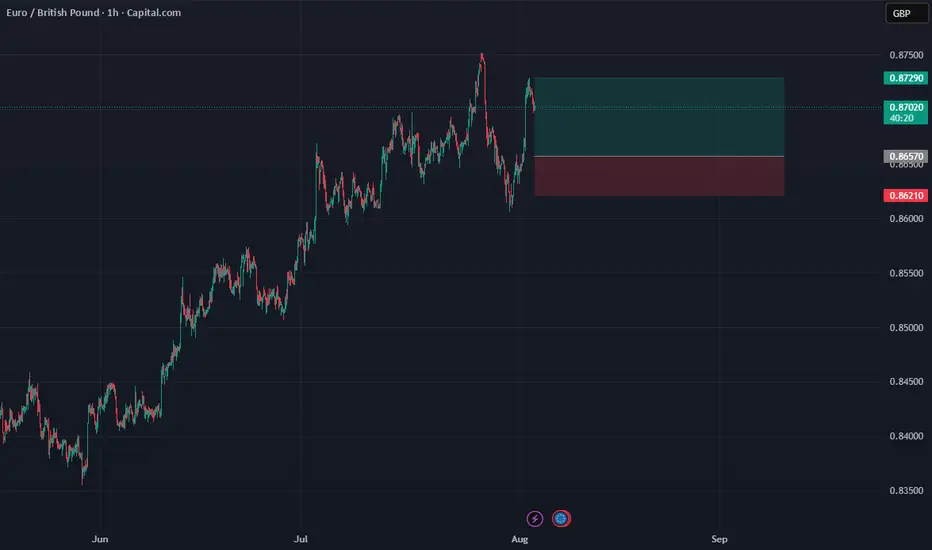
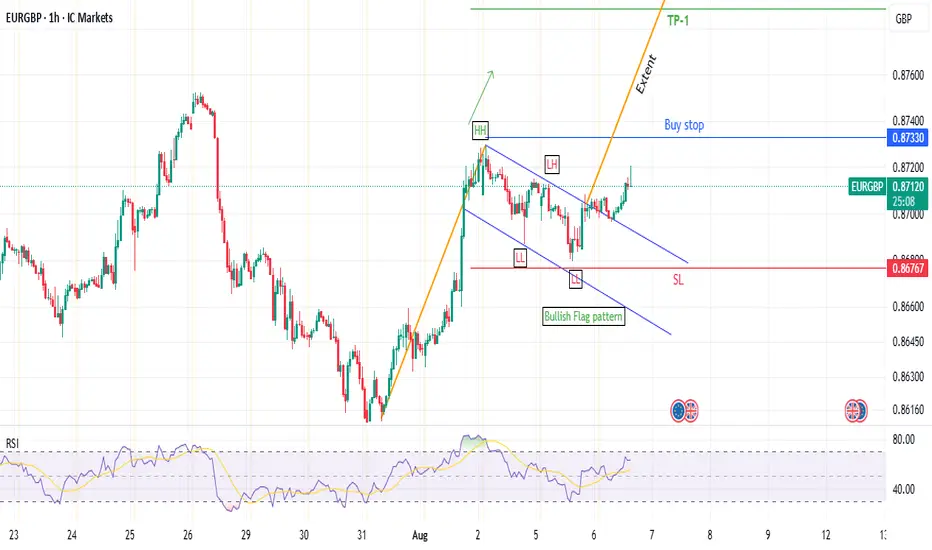
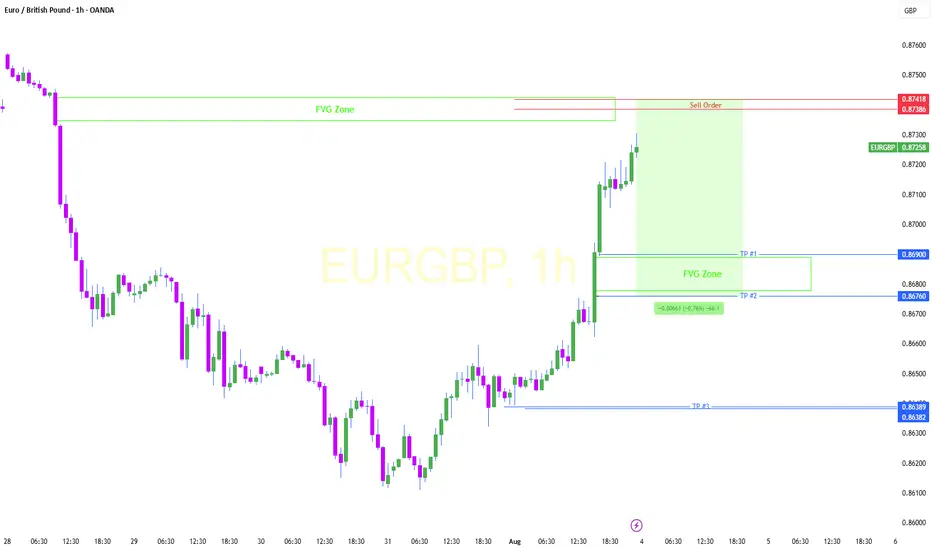
EUR/GBP: Bull Flag Forming for a Potential Breakout?Hey everyone,
Sharing my view on EUR/GBP on the 1-hour chart. I've spotted what looks like a classic Bullish Flag pattern developing after a strong upward surge. This is a continuation pattern, and I'm looking to trade the breakout.
My Game Plan: I'm playing this with a conservative entry, waiting for a clear break of the top of Flag pole. Here are the specific levels for my trade plan:
🎯 Entry (Buy Stop): $0.8733
🛡️ Stop Loss: $0.8677 (A break below here would invalidate the bullish setup for me)
💰 Take Profit 1: $0.8789 (A clean 1:1 Risk/Reward)
🏆 Take Profit 2: $0.8822 (Length of the flag pole)
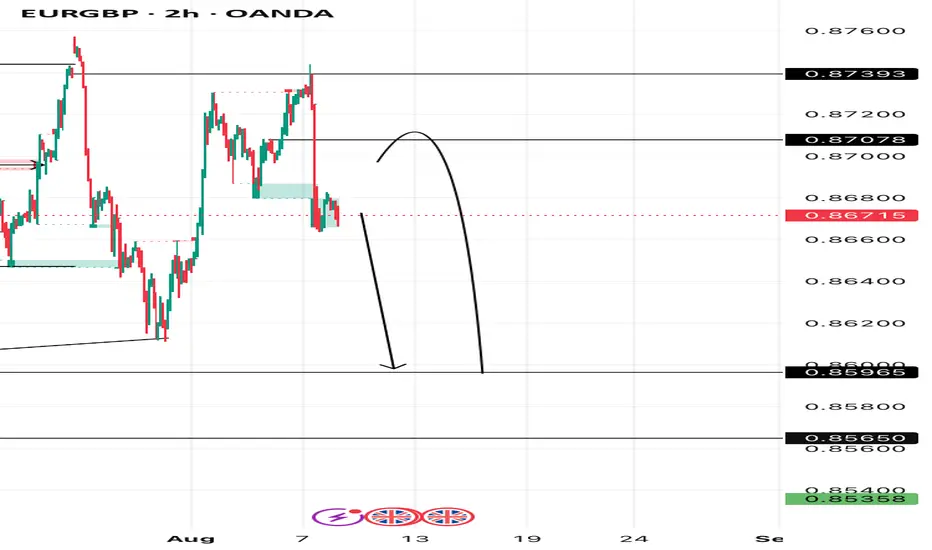
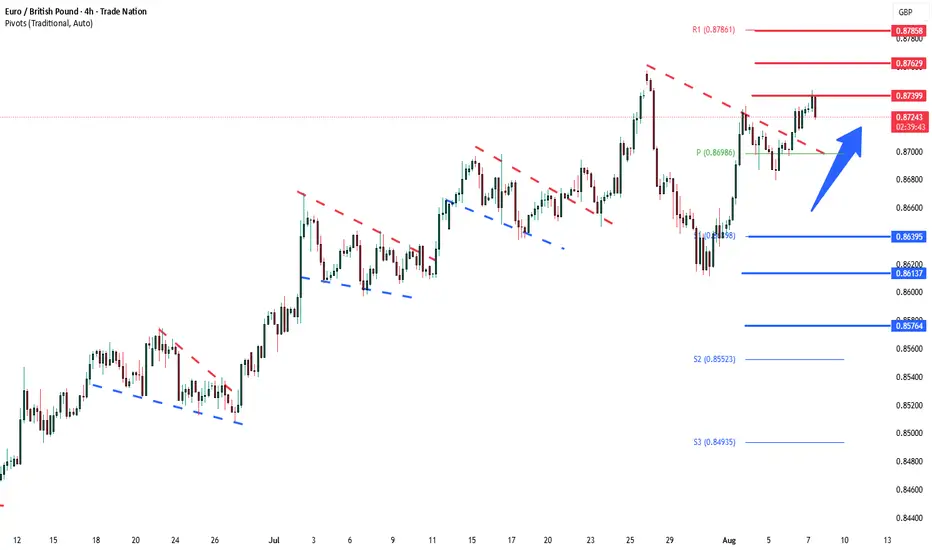
EURGBP awaits BoE rate decisionThe EURGBP remains in a bullish trend, with recent price action showing signs of a corrective pullback within the broader uptrend.
Support Zone: 0.8640 – a key level from previous consolidation. Price is currently testing or approaching this level.
A bullish rebound from 0.8640 would confirm ongoing upside momentum, with potential targets at:
0.8740 – initial resistance
0.8760 – psychological and structural level
0.8785 – extended resistance on the longer-term chart
Bearish Scenario:
A confirmed break and daily close below 0.8640 would weaken the bullish outlook and suggest deeper downside risk toward:
0.8613 – minor support
0.8576 – stronger support and potential demand zone
Outlook:
Bullish bias remains intact while the EURGBP holds above 0.8640 A sustained break below this level could shift momentum to the downside in the short term.
This communication is for informational purposes only and should not be viewed as any form of recommendation as to a particular course of action or as investment advice. It is not intended as an offer or solicitation for the purchase or sale of any financial instrument or as an official confirmation of any transaction. Opinions, estimates and assumptions expressed herein are made as of the date of this communication and are subject to change without notice. This communication has been prepared based upon information, including market prices, data and other information, believed to be reliable; however, Trade Nation does not warrant its completeness or accuracy. All market prices and market data contained in or attached to this communication are indicative and subject to change without notice.
EURGBP – DAILY FORECAST Q3 | W32 | D7 | Y25📊 EURGBP – DAILY FORECAST
Q3 | W32 | D7 | Y25
Daily Forecast 🔍📅
Here’s a short diagnosis of the current chart setup 🧠📈
Higher time frame order blocks have been identified — these are our patient points of interest 🎯🧭.
It’s crucial to wait for a confirmed break of structure 🧱✅ before forming a directional bias.
This keeps us disciplined and aligned with what price action is truly telling us.
📈 Risk Management Protocols
🔑 Core principles:
Max 1% risk per trade
Only execute at pre-identified levels
Use alerts, not emotion
Stick to your RR plan — minimum 1:2
🧠 You’re not paid for how many trades you take, you’re paid for how well you manage risk.
🧠 Weekly FRGNT Insight
"Trade what the market gives, not what your ego wants."
Stay mechanical. Stay focused. Let the probabilities work.
FX:EURGBP
