EURGBP Bullish Momentum Trade PlanWatching EUR/GBP closely 🔍 — after an extended bullish trend 🐂 and a sharp corrective pullback 📉, we’re now seeing renewed upside momentum and signs of bullish continuation 📈. My current bias is long ✅. Price has retraced back into equilibrium, and with movement beginning to pick up, I’m actively hunting for an entry 🎯 — aiming for a retest of the previous high, with stops tucked below the most recent low 🛡️. Everything is broken down in the video and should not be taken as financial advice ⚠️.
EURGBP trade ideas

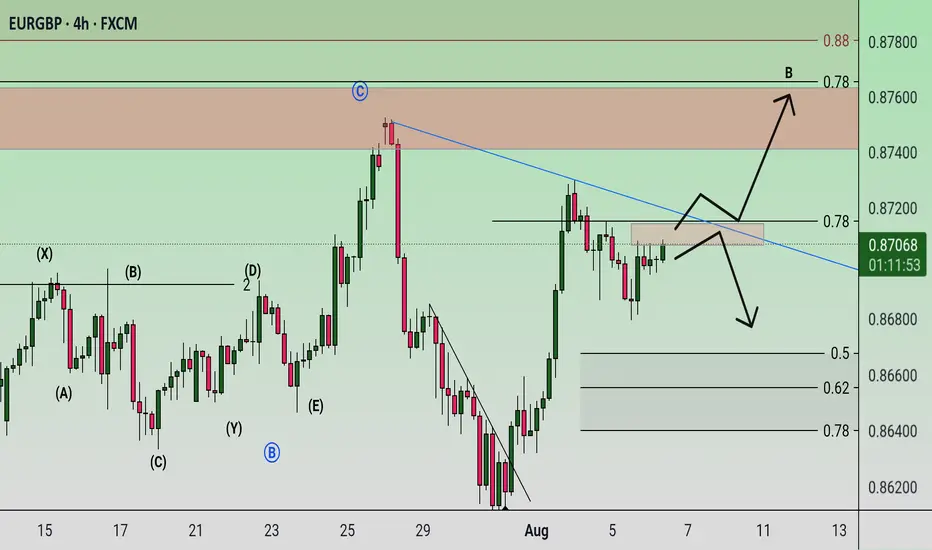
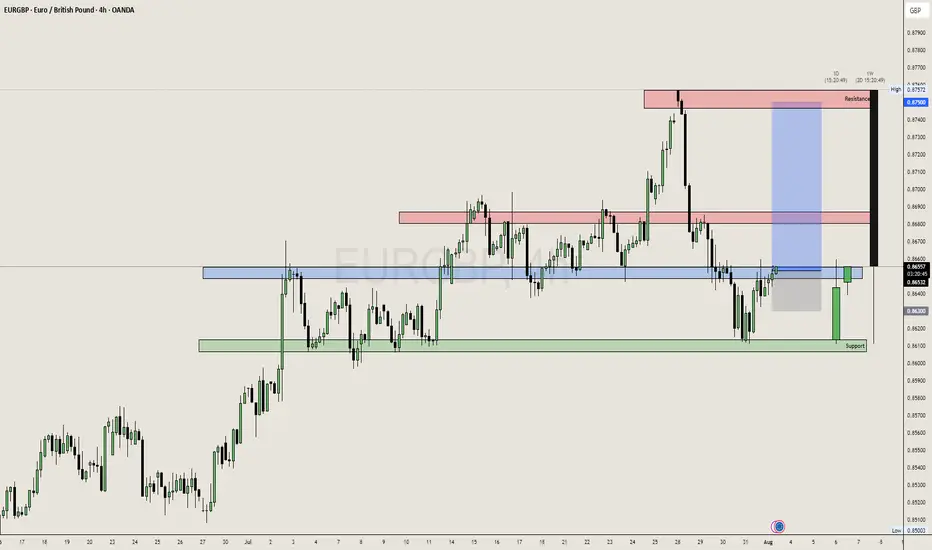
Check the trend Given the price behavior within the current resistance range, possible scenarios have been identified. As long as the price does not consolidate above the resistance range, a continuation of the downtrend is likely.
EURGBP – DAILY FORECAST Q3 | W32 | D6 | Y25📊 EURGBP – DAILY FORECAST
Q3 | W32 | D6 | Y25
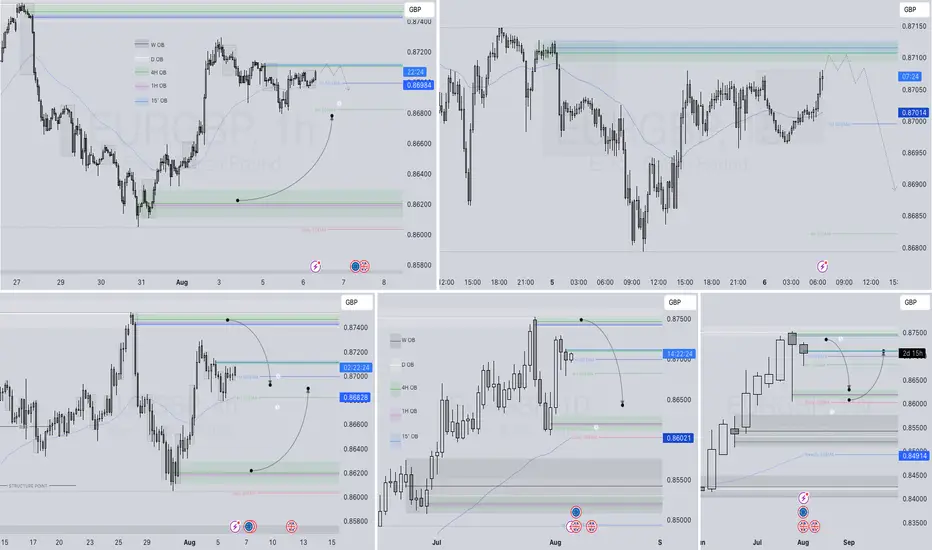
Daily Forecast 🔍📅
Here’s a short diagnosis of the current chart setup 🧠📈
Higher time frame order blocks have been identified — these are our patient points of interest 🎯🧭.
It’s crucial to wait for a confirmed break of structure 🧱✅ before forming a directional bias.
This keeps us disciplined and aligned with what price action is truly telling us.
📈 Risk Management Protocols
🔑 Core principles:
Max 1% risk per trade
Only execute at pre-identified levels
Use alerts, not emotion
Stick to your RR plan — minimum 1:2
🧠 You’re not paid for how many trades you take, you’re paid for how well you manage risk.
🧠 Weekly FRGNT Insight
"Trade what the market gives, not what your ego wants."
Stay mechanical. Stay focused. Let the probabilities work.
FX:EURGBP
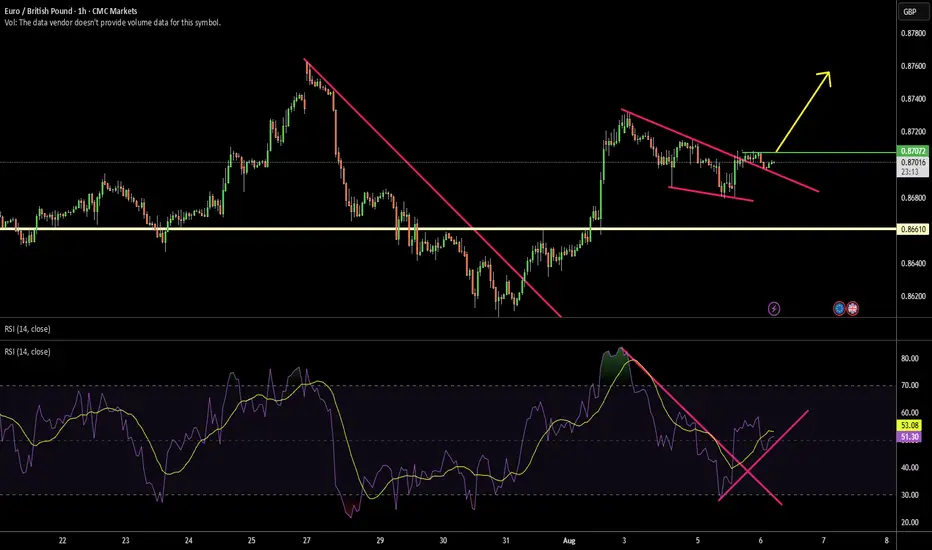
EUR/GBP long idea - BuyEUR/GBP, breakout from 0.8707 could see us at 0.8760. For now, we are seeing a clear flag pattern, but confirmation of the breakout will be necessary.
Remember that tomorrow is the interest rate decision in the United Kingdom 🇬🇧, so there will be significant volatility.
EURGBP The BOE has likely cut interest rates more aggressively than warranted, with inflation still running hot according to the latest reports.
This sets up a fundamentally bullish case for EUR/GBP.
From a technical standpoint, using my Orderflow Boxing Method, EUR/GBP is now showing bullish structure on the 4H chart.
I've identified two Points of Interest (POIs) — both 4H Fair Value Gaps (FVGs).
The first 4H FVG has already been tapped and has also led to the formation of a 15M FVG, adding confluence.
I entered my first long position using the 5M chart, triggered by a bullish signal on the Target Trend Indicator by @BigBeluga.
Let’s see how this setup plays out. If it doesn’t hold, I’ll be watching for price to move deeper into the discount zone of the second 4H FVG to look for another long opportunity.
EURGBP long ideeaso far the price respected the uptrend channel, i try it with a minimum risk and very tight sl.

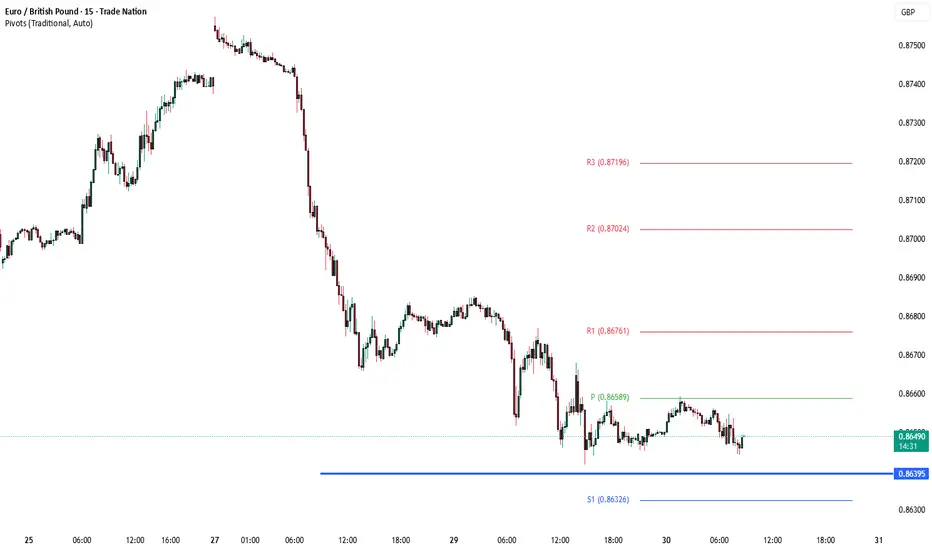
EURGBP important support at 0.8640The EURGBP remains in a bullish trend, with recent price action showing signs of a corrective pullback within the broader uptrend.
Support Zone: 0.8640 – a key level from previous consolidation. Price is currently testing or approaching this level.
A bullish rebound from 0.8640 would confirm ongoing upside momentum, with potential targets at:
0.8740 – initial resistance
0.8760 – psychological and structural level
0.8785 – extended resistance on the longer-term chart
Bearish Scenario:
A confirmed break and daily close below 0.8640 would weaken the bullish outlook and suggest deeper downside risk toward:
0.8613 – minor support
0.8576 – stronger support and potential demand zone
Outlook:
Bullish bias remains intact while the EURGBP holds above 0.8640 A sustained break below this level could shift momentum to the downside in the short term.
This communication is for informational purposes only and should not be viewed as any form of recommendation as to a particular course of action or as investment advice. It is not intended as an offer or solicitation for the purchase or sale of any financial instrument or as an official confirmation of any transaction. Opinions, estimates and assumptions expressed herein are made as of the date of this communication and are subject to change without notice. This communication has been prepared based upon information, including market prices, data and other information, believed to be reliable; however, Trade Nation does not warrant its completeness or accuracy. All market prices and market data contained in or attached to this communication are indicative and subject to change without notice.
EURGBP – DAILY FORECAST Q3 | W32 | D4 | Y25📊 EURGBP – DAILY FORECAST
Q3 | W32 | D4 | Y25
Daily Forecast 🔍📅
Here’s a short diagnosis of the current chart setup 🧠📈
Higher time frame order blocks have been identified — these are our patient points of interest 🎯🧭.
It’s crucial to wait for a confirmed break of structure 🧱✅ before forming a directional bias.
This keeps us disciplined and aligned with what price action is truly telling us.
📈 Risk Management Protocols
🔑 Core principles:
Max 1% risk per trade
Only execute at pre-identified levels
Use alerts, not emotion
Stick to your RR plan — minimum 1:2
🧠 You’re not paid for how many trades you take, you’re paid for how well you manage risk.
🧠 Weekly FRGNT Insight
"Trade what the market gives, not what your ego wants."
Stay mechanical. Stay focused. Let the probabilities work.
FX:EURGBP

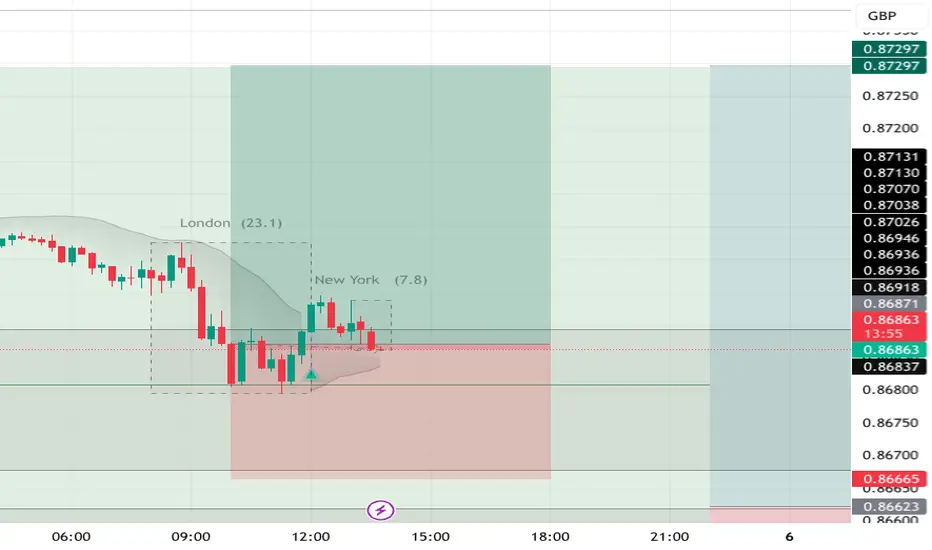
eurgbp Sell positionthe asset has reached a strong supply zone triggering stop losses. we expect price to drop from here.
EURGBP Will Collapse! SELL!
My dear subscribers,
EURGBP looks like it will make a good move, and here are the details:
The market is trading on 0.8667 pivot level.
Bias - Bearish
My Stop Loss - 0.8675
Technical Indicators: Both Super Trend & Pivot HL indicate a highly probable Bearish continuation.
Target - 0.8650
About Used Indicators:
The average true range (ATR) plays an important role in 'Supertrend' as the indicator uses ATR to calculate its value. The ATR indicator signals the degree of price volatility.
Disclosure: I am part of Trade Nation's Influencer program and receive a monthly fee for using their TradingView charts in my analysis.
———————————
WISH YOU ALL LUCK
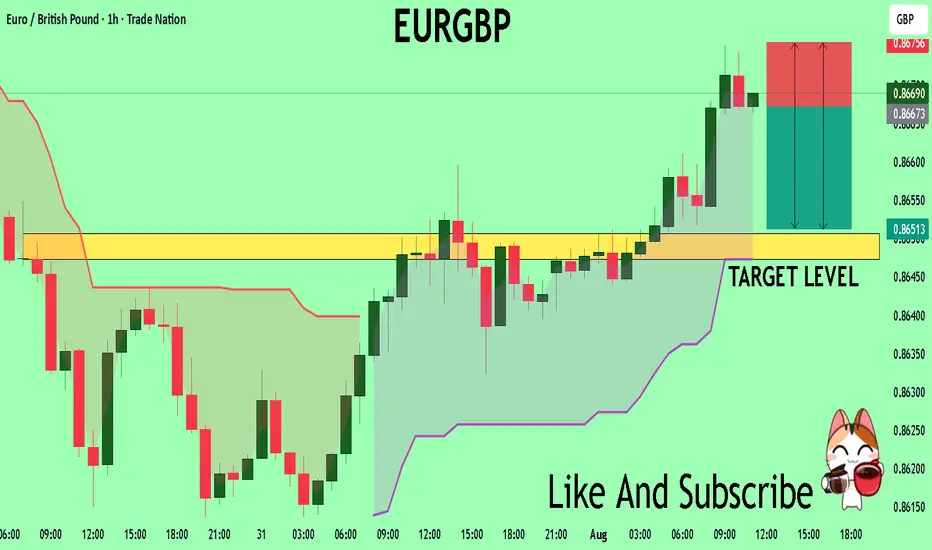
EURGBP, Bullish Breakout!!!EURGBP after getting rejected from the support we can expect again a upside movement.
I am expecting a movement from 0.86500 to 0.8700 at least, we can plan sl below 0.86300.
Safe Player wait for proper breakout and wait for retest of 0.8650 area.
EURGBP: Bearish Continuation from Reclaimed Order Block!Greetings Traders,
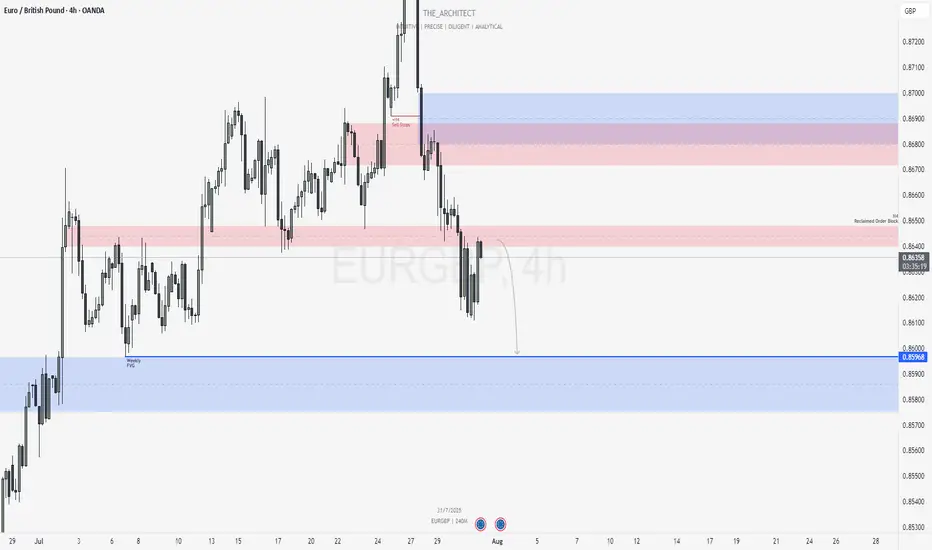
In today’s analysis of EURGBP, we observe that institutional order flow on the H4 timeframe has recently shifted bearish. This provides us with a clear directional bias to look for shorting opportunities in line with the prevailing higher timeframe trend.
Higher Timeframe Context:
On the weekly timeframe, price action is currently drawing towards a Weekly Fair Value Gap (FVG). This bearish draw on liquidity confirms the macro-level bearish sentiment. With the recent bearish market structure shift (MSS) on the H4, we now have strong confluence between the weekly and intraday order flow, favoring continued downside.
Key Observations on H4:
Reclaimed Bearish Order Block: After shifting structure to the downside, price has retraced into a bearish reclaimed order block—a region previously marked by institutional selling. This return to the origin of prior sell-side imbalance offers institutions the opportunity to mitigate earlier positions and reinitiate shorts. The failure of price to break higher confirms bearish intent.
Confluence with Weekly Draw: The reclaimed order block aligns with the broader draw towards the weekly FVG, providing an optimal zone for bearish confirmation entries.
Trading Plan:
Entry Strategy: Look for lower timeframe confirmation entries within the H4 reclaimed order block.
Target: The short-term target remains the Weekly Fair Value Gap, supporting a discount-side delivery.
As always, remain disciplined in execution. Let the market confirm your bias before entering, and manage risk according to your rules.
For a detailed market walkthrough and in-depth execution zones, be sure to watch this week’s Forex Market Breakdown:
Kind Regards,
The Architect 🏛️📉
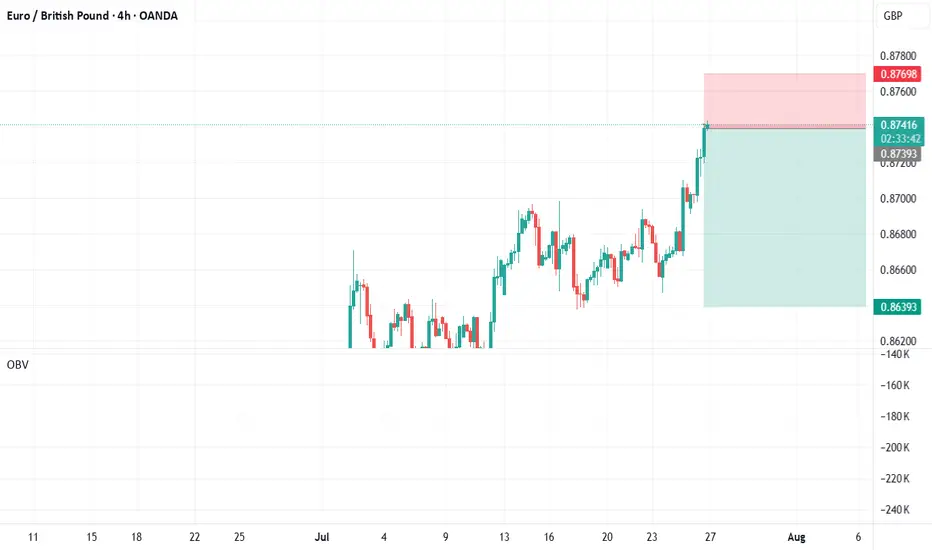
EURGBP Long Swing Trade OANDA:EURGBP Long trade, with my back testing of this strategy, it hits multiple possible take profits, manage your position accordingly.
This is good trade, don't overload your risk like greedy, be disciplined trader, this is good trade.
Use proper risk management
Looks like good trade.
Lets monitor.
Use proper risk management.
Disclaimer: only idea, not advice
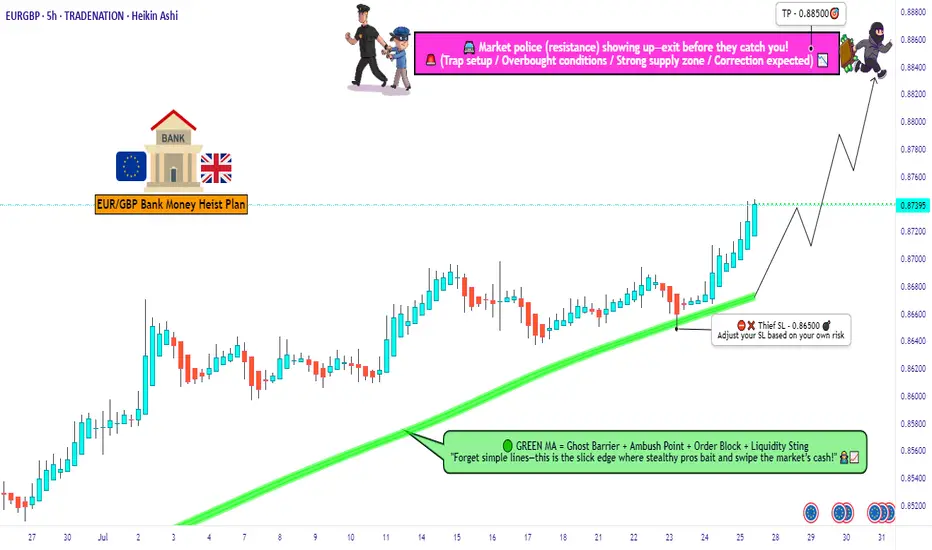
EUR/GBP Thief Trade: Swipe Profits Before Overbought Trap!🦹♂️ EUR/GBP "THE CHUNNEL HEIST" – BULLISH LOOT IN PROGRESS! 🚨💰
(Thief Trading Strategy – Escape Before the Cops Arrive!)
🎯 DEAR MARKET PIRATES & PROFIT SNATCHERS,
Based on our 🔥Thief Trading Style Analysis🔥, we’re executing a bullish heist on EUR/GBP ("The Chunnel"). The vault is wide open—time to swipe the loot before the high-risk resistance police barricade (aka overbought trap) shuts us down!
📜 THE MASTER PLAN:
✔ Entry (📈): "The Bullish Vault is Unlocked!"
Buy Limit Orders (15-30min TF) near recent swing lows/highs.
Thief’s DCA Trick: Layer entries like a pro robber—multiple limit orders for max loot.
✔ Stop Loss (🛑): "Hide Your Stash Wisely!"
SL at nearest 4H candle wick (0.86500)—adjust based on your risk appetite & lot size.
Remember: A good thief always has an escape route!
✔ Target (🎯): 0.88500 (or escape earlier if the cops get suspicious!)
🔎 SCALPERS & SWING BANDITS – LISTEN UP!
Scalpers: Stick to LONG-ONLY heists! Use trailing SL to protect profits.
Swing Thieves: If you’re low on cash, join the slow robbery—DCA & hold!
📡 WHY THIS HEIST IS HOT:
Bullish momentum in play (but BEWARE of overbought traps!).
Fundamental Drivers: Check COT Reports, Macro Data, & Sentiment.
🚨 TRADING ALERT: NEWS = POLICE RAID RISK!
Avoid new trades during high-impact news.
Trailing SL = Your Getaway Car! Lock profits before volatility strikes.
💥 BOOST THIS HEIST – STRENGTHEN THE GANG!
👉 Smash the LIKE & BOOST button to fuel our next market robbery!
👉 Follow for more heists—profit awaits! 🚀💰
🦹♂️ Stay Sharp, Stay Ruthless… See You on the Next Heist!
EURGBP SELL OPPORTUNITY In today’s trading session we’re considering shorting EURGBP from the current market price as we see price rejecting a bearish trendline in H1 timeframe and also making series of lower highs and lower lows. A sell opportunity is envisaged from the current market price.
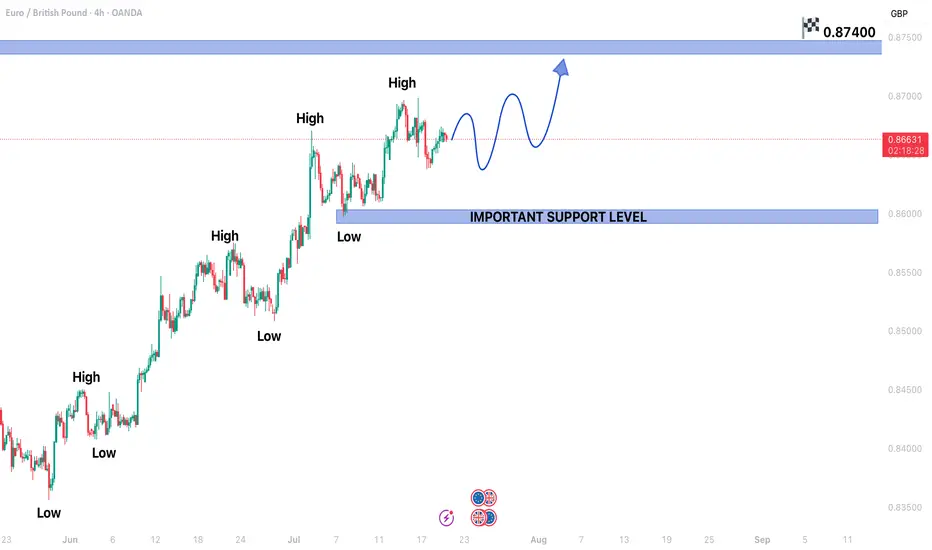
EURGBP CONTINUING BULLISH TREND STRUCTUREEURGBP CONTINUING BULLISH TREND STRUCTURE IN 4H TIME FRAME.
Price is currently in a secondary trend.
Price is expected to end the secondary trend and start primary trend again.
On higher side market may hit the targets of 0.87400
On lower side 0.85950 may act as a key support level.
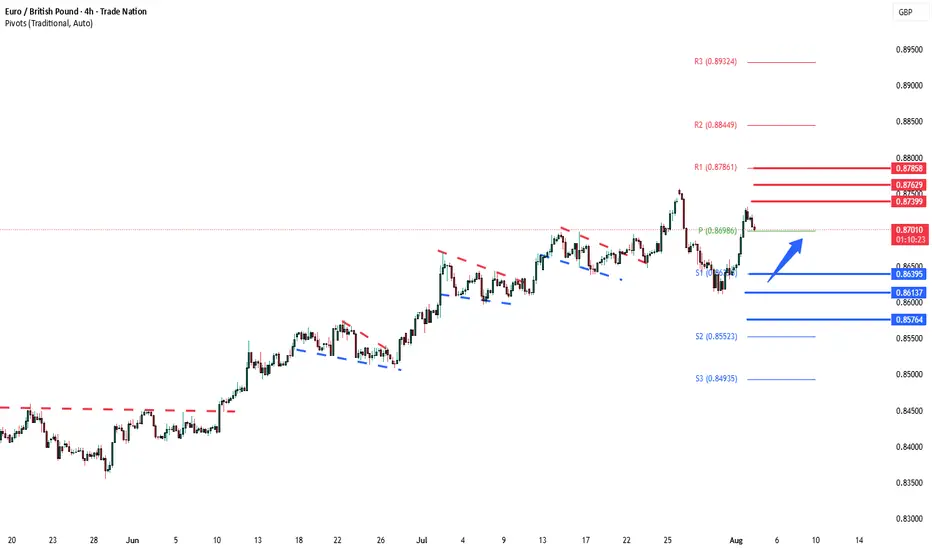
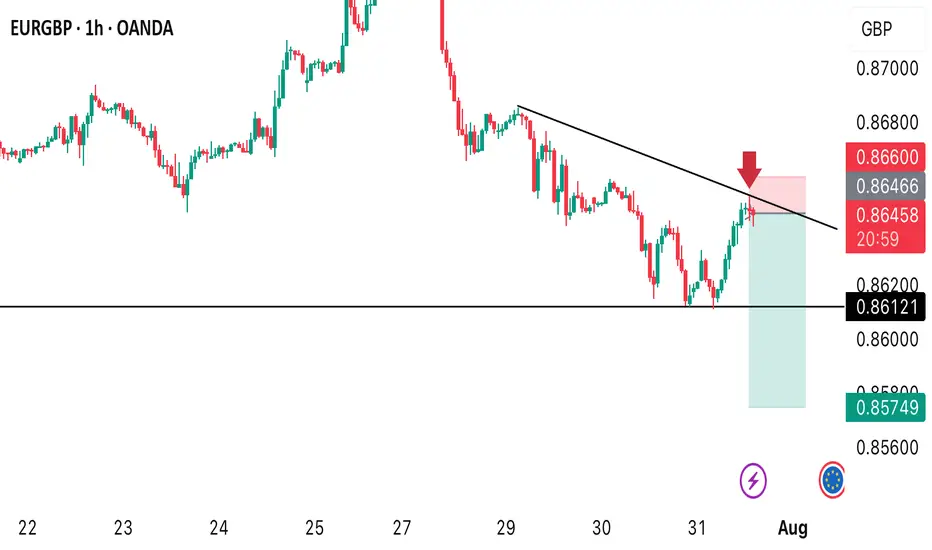
EURGBP key support at 0.8613The EURGBP remains in a bullish trend, with recent price action showing signs of a corrective pullback within the broader uptrend.
Support Zone: 0.8613 – a key level from previous consolidation. Price is currently testing or approaching this level.
A bullish rebound from 0.8613 would confirm ongoing upside momentum, with potential targets at:
0.8708 – initial resistance
0.8740 – psychological and structural level
0.8770 – extended resistance on the longer-term chart
Bearish Scenario:
A confirmed break and daily close below 0.8613 would weaken the bullish outlook and suggest deeper downside risk toward:
0.8580 – minor support
0.8544 – stronger support and potential demand zone
Outlook:
Bullish bias remains intact while the EURGBP holds above 0.8613 A sustained break below this level could shift momentum to the downside in the short term.
This communication is for informational purposes only and should not be viewed as any form of recommendation as to a particular course of action or as investment advice. It is not intended as an offer or solicitation for the purchase or sale of any financial instrument or as an official confirmation of any transaction. Opinions, estimates and assumptions expressed herein are made as of the date of this communication and are subject to change without notice. This communication has been prepared based upon information, including market prices, data and other information, believed to be reliable; however, Trade Nation does not warrant its completeness or accuracy. All market prices and market data contained in or attached to this communication are indicative and subject to change without notice.

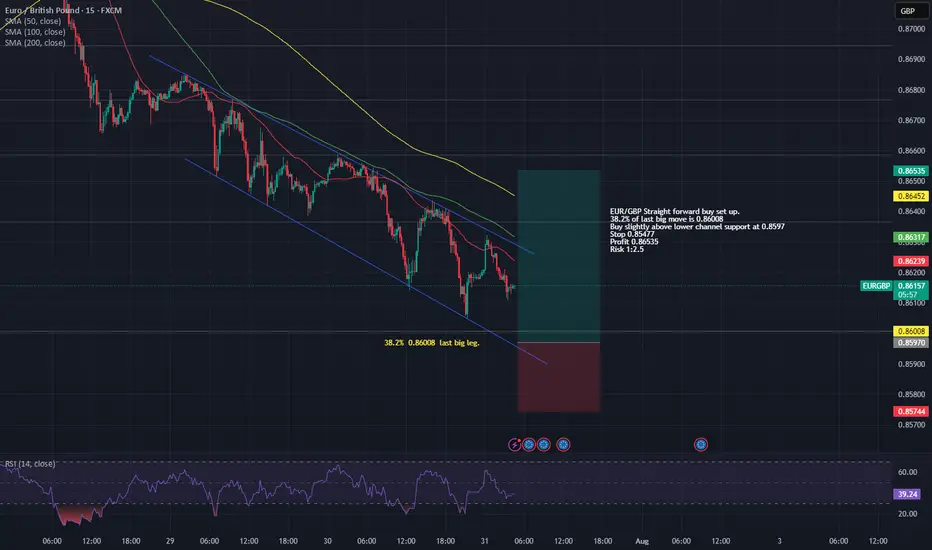
Straight forward EUR/GBP buy set up.EUR/GBP has been in a large decline against the recent trend and looks to be in some sort of leading diagonal pattern.
Major Fib 38.2% comes in at 0.86008 so buy slightly below but above lower trend line with profit risk of 1:2.5
Buy 0.8597
Stop 0.85744
Profit 0.86535 or more depending on strength.
EURGBP ShortEURGBP is now net short on the regression break.
I am considering all USD cross and EUR Cross. I have not made up my mine at this point.
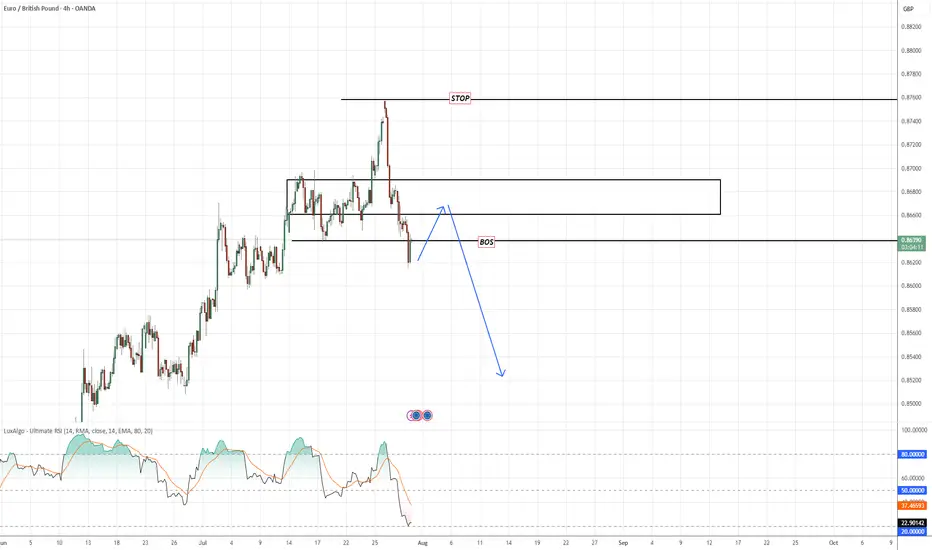
EURGBPMajor Break of Structure (BoS) confirmed on the daily, with a clear rejection from recent highs. Price has aggressively sold off and is now preparing for a retracement into a key supply zone.
🔸 Plan:
Waiting for a pullback toward the 0.8715–0.8740 supply zone (area of interest) to look for signs of bearish continuation.
🔸 BoS confirms shift in trend structure
🔸 STOP: Above the previous high ~0.8825
🔸 Target: Lower lows toward ~0.8500 short term — possible extension toward 0.84xx zone
🧠 RSI shows strong bearish divergence and confirms trend shift.
📌 Setup in progress — will monitor lower timeframes (1H/4H) for entry trigger within zone.
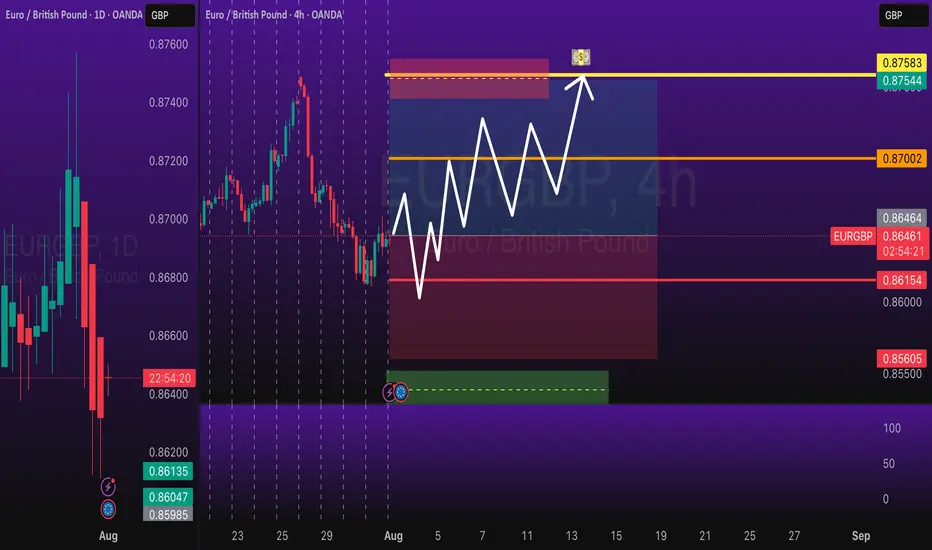
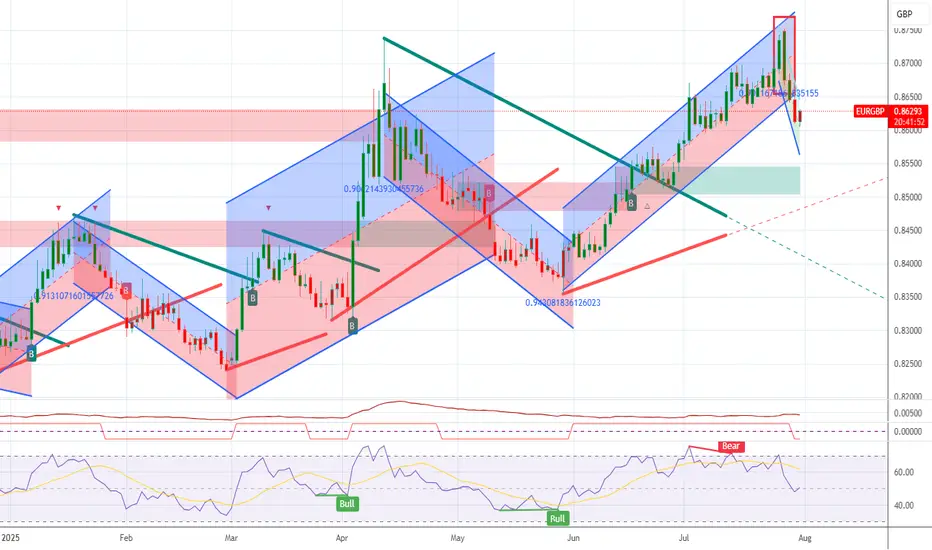
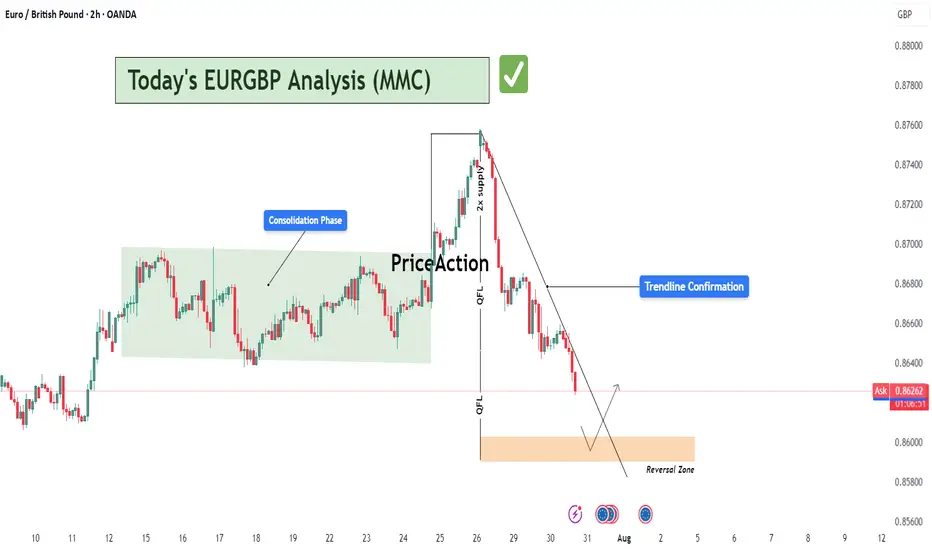
EURGBP Analysis : Bearish Leg Nearing Completion + Target Zone📍 Overview:
The EURGBP pair has recently provided significant price action signals that suggest a high-probability reversal setup is unfolding. This analysis dives deep into market structure, supply and demand dynamics, and institutional price behavior using MMC principles.
The current focus lies in identifying a potential trend reversal opportunity after a sharp decline from a key supply level, as price nears a well-marked Reversal Zone. This detailed breakdown covers each phase to provide clarity and trade planning.
🧩 Phase 1: Consolidation Phase (Accumulation)
From July 11th to July 24th, EURGBP moved sideways within a clearly defined range-bound structure (highlighted in green).
This consolidation indicates a battle of control between bulls and bears, typically signaling accumulation or distribution depending on breakout direction.
The tight price action and wicks on both sides suggest market makers accumulating positions before a breakout.
Price eventually broke out to the upside, confirming bullish accumulation rather than distribution.
🚀 Phase 2: Impulse Move & 2x Supply Rejection
Following the breakout from the consolidation, price experienced a strong impulsive rally, catching breakout traders and pushing into a major supply zone.
The area where price reversed is marked as a 2x supply rejection zone, suggesting heavy institutional sell orders were triggered.
This zone aligns with a historical resistance level and is critical in the current structure.
Price failed to sustain the bullish momentum, forming a sharp drop right after tapping into supply, indicating strong selling pressure.
🔄 Phase 3: Market Structure Shift via QFL (Quick Flip Levels)
As the price dropped from the supply zone, two significant QFL levels were printed in quick succession.
QFL (Quick Flip Levels) represent a break in internal structure, showing that buyers were no longer defending the previous support zones.
These quick flips signal an aggressive shift in momentum from buyers to sellers.
Each QFL breakdown was followed by a new lower low, confirming the start of a bearish sequence or trend leg.
📉 Phase 4: Descending Trendline & Dynamic Resistance
After the QFL shifts, a clear downtrend channel formed, respected by multiple lower highs.
The descending trendline drawn from the supply zone peak has acted as dynamic resistance, rejecting every bullish pullback attempt.
This trendline provides technical confluence for intraday traders to manage risk and timing entries.
🟠 Current Market Context: Entering the Reversal Zone
Price is now approaching a marked Reversal Zone (highlighted in orange).
This zone represents a high-probability demand area, previously respected as a base before the rally to supply.
If price reaches this area and shows signs of exhaustion (e.g., bullish engulfing, long wick rejection, volume divergence), it may serve as a reversal point.
This zone aligns with MMC logic — market makers tend to react at zones of trapped liquidity, especially after stop hunts.
📈 Projected Scenario & Trade Setup:
Price drops into the Reversal Zone
A bullish rejection pattern appears (e.g., pin bar, engulfing candle)
Price retests and breaks the descending trendline to confirm a momentum shift
Entry can be taken post-breakout or with aggressive confirmation inside the zone
Stops placed below the zone; targets aligned with the previous QFL or trendline retest
⚠️ Key Notes for Traders:
Don't chase the move. Wait for reversal confirmation before entering.
QFLs offer strong structure-based levels to identify where the market flipped.
Use trendline confluence and volume confirmation for precise entries.
Monitor price action in the Reversal Zone — if invalidated, the downtrend may extend toward the next macro support.
Apply proper risk management and stay patient for the setup to fully develop.
📊 Summary:
🧭 Bias: Short-term bearish → possible reversal bullish
🎯 Entry Area: Reversal Zone (0.85800 – 0.86000 approx.)
⛔ Invalidation: Clean break and close below 0.85700
🏁 Potential Target: First TP near 0.86750; extended TP near 0.87050 (previous QFL level)
🔄 MMC Approach Recap:
This analysis follows the Market Maker Cycle (MMC) method, which involves:
Consolidation (Accumulation)
Manipulation (False Breakouts or Stop Hunts)
Distribution (Rapid Expansion & Flip Levels)
Re-Accumulation or Reversal
Each step is clearly defined in this chart, offering a blueprint for both trend traders and reversal specialists.
💬 Let's Talk:
What do you think about this setup? Are you seeing similar MMC patterns on other EUR or GBP crosses?
Drop your thoughts, charts, and questions below!
The Day AheadKey Data Releases:
US:
Q2 GDP – Crucial insight into US economic momentum.
July ADP Employment – A labor market pulse-check ahead of Friday's payrolls.
June Pending Home Sales – Gauges housing market resilience.
Europe:
Germany, France, Italy, Eurozone Q2 GDP – A comprehensive picture of Eurozone growth trajectory.
June Retail Sales (Germany), Consumer Spending (France), Wages and Industrial Sales (Italy) – Offer inflation and demand signals.
Eurozone July Economic Confidence – Reflects business and consumer sentiment.
Australia:
June CPI – May influence RBA policy expectations.
Central Bank Decisions:
Federal Reserve:
Widely anticipated decision following disinflationary signals and resilient growth.
Bank of Canada:
Eyes on dovish shift as domestic momentum cools.
Major Earnings:
Tech Titans: Microsoft, Meta, Qualcomm, ARM – Key drivers of market sentiment, especially AI and cloud-related narratives.
Luxury & Autos: Hermes, Porsche, Mercedes-Benz – Demand indicators from high-end consumers.
Banks & Financials: HSBC, UBS, Intesa Sanpaolo, Robinhood – Update on global credit and trading conditions.
Industrials & Energy: Airbus, Lam Research, Rio Tinto, Vinci, BAE – Supply chain and CapEx insights.
Consumer & Retail: Ford, adidas, Hershey, Kraft Heinz, Etsy, Just Eat – Demand resilience and margin pressures.
US Treasury:
Quarterly Refunding Announcement – Market-sensitive update on bond issuance plans, with implications for yields and risk sentiment.
Conclusion:
This is a pivotal day for markets, combining top-tier macroeconomic data, central bank rate decisions, and heavyweight earnings. The Fed’s stance will likely steer risk appetite, while GDP prints across the US and Europe will refine global growth expectations. Meanwhile, earnings from major tech and consumer names will test the strength of market leadership. Volatility is likely to rise, with traders balancing soft-landing hopes against persistent inflation risks and policy uncertainty.
This communication is for informational purposes only and should not be viewed as any form of recommendation as to a particular course of action or as investment advice. It is not intended as an offer or solicitation for the purchase or sale of any financial instrument or as an official confirmation of any transaction. Opinions, estimates and assumptions expressed herein are made as of the date of this communication and are subject to change without notice. This communication has been prepared based upon information, including market prices, data and other information, believed to be reliable; however, Trade Nation does not warrant its completeness or accuracy. All market prices and market data contained in or attached to this communication are indicative and subject to change without notice.