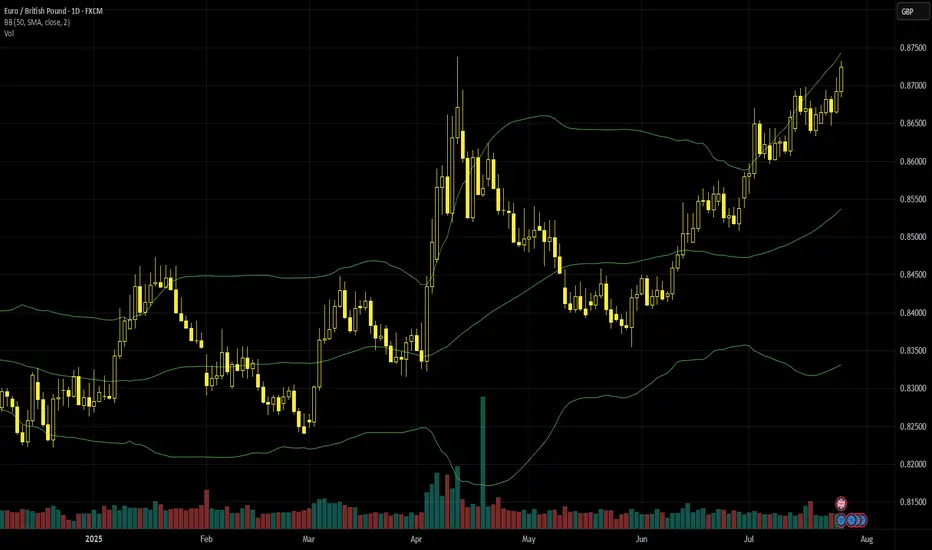
Euro-pound retests April’s highsThe ECB’s relative hawkishness or at least lower dovishness on 24 July seems to have boosted the euro significantly, with euro-pound in particular continuing its uptrend. Here though the generally weaker recent sentiment on British growth and disappointing retail data added fuel to EURGBP’s gains. There’s also some likelihood that the EU will secure a trade deal with the USA in the next few days before the deadline for new tariffs of 1 August.
87p on 24 July was euro-pound’s highest daily close since December 2023 and gains continued intraday the following day with a clear push above the 23.6% monthly Fibonacci retracement. The overall trend since March is upward and these two days might suggest that the latest phase of it isn’t close to exhaustion yet; on the contrary, momentum has increased in recent sessions. However, volume has been significantly lower since late April and now a seasonal further drop might be possible. The slow stochastic signals overbought and ATR hasn’t risen significantly in recent days.
The 20 SMA might be an important dynamic support in the near future, but first it’d be possible to see the 23.6% Fibo flipping to support from resistance previously. Traders are looking ahead to the eurozone’s flash GDP for Q2 on 30 July and inflation on 1 August although the latter might be overshadowed by the NFP the same day.
This is my personal opinion, not the opinion of Exness. This is not a recommendation to trade.
EURGBP trade ideas
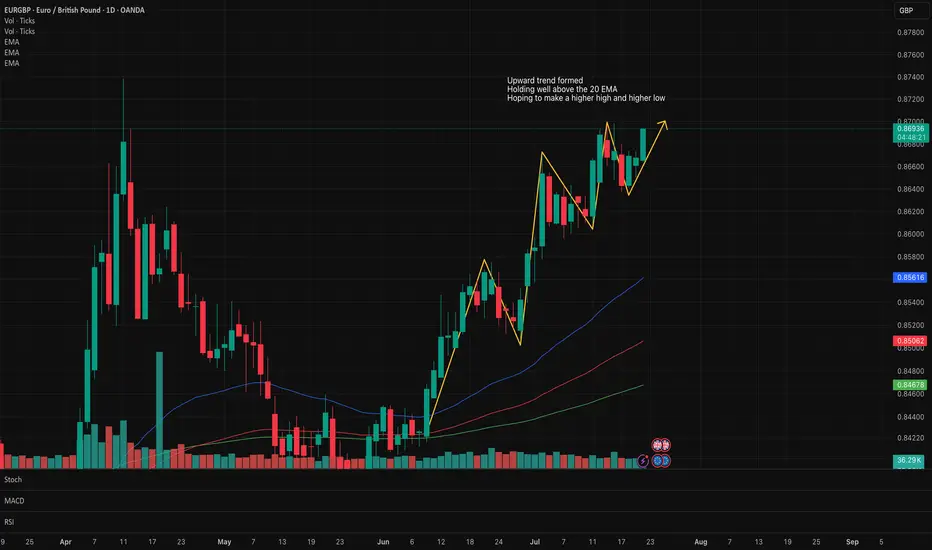
EUR/GBP Pushing higherLooks like a good trade to the upside on the EUR/GBP.
Risk to reward potential 3:1
Upward trend is well formed
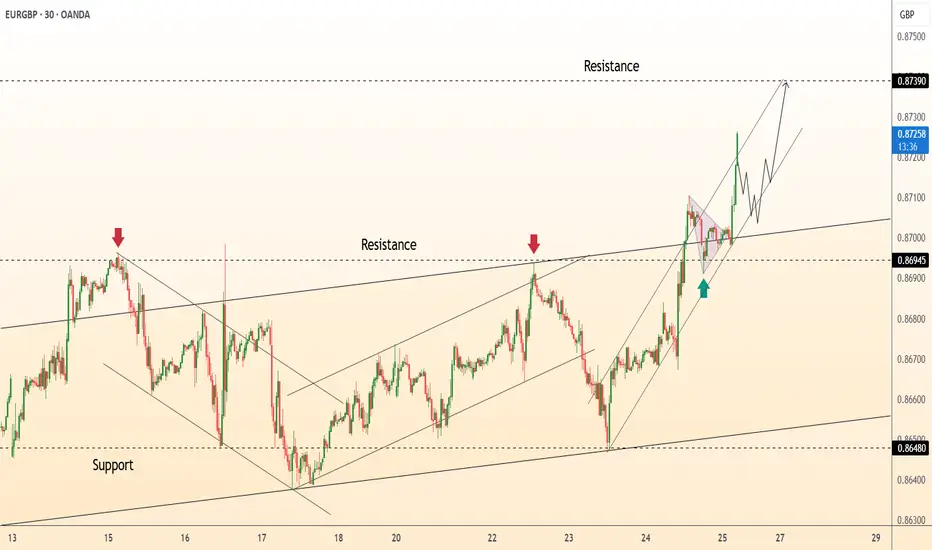
EURGBP near the current highest point of 2025.FX_IDC:EURGBP is slowly approaching a strong area of resistance, which is the current highest point of 2025. Let's dig in...
MARKETSCOM:EURGBP
Let us know what you think in the comments below.
Thank you.
75.2% of retail investor accounts lose money when trading CFDs with this provider. You should consider whether you understand how CFDs work and whether you can afford to take the high risk of losing your money. Past performance is not necessarily indicative of future results. The value of investments may fall as well as rise and the investor may not get back the amount initially invested. This content is not intended for nor applicable to residents of the UK. Cryptocurrency CFDs and spread bets are restricted in the UK for all retail clients.

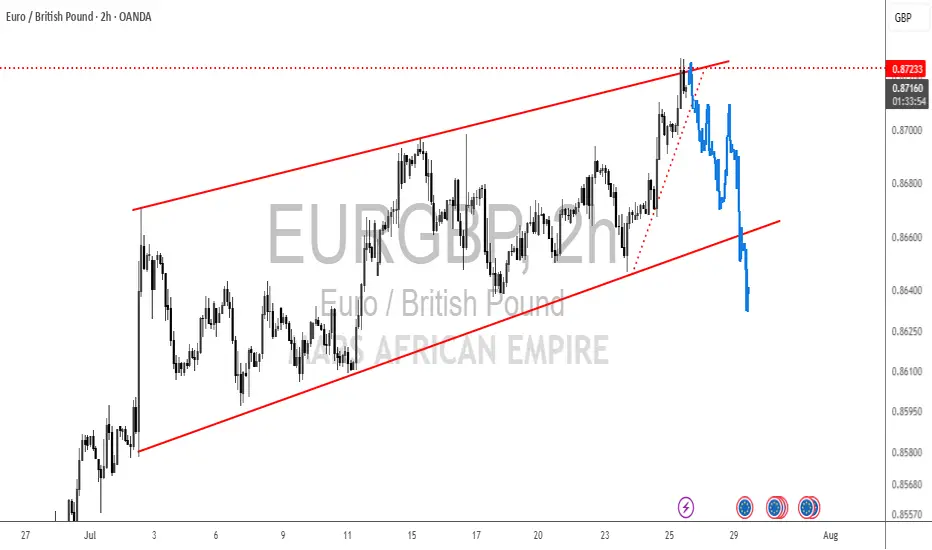
Flag ReversalWe might see this guy use this flag reversal to push down, we are currently at the sell side of the trend and we want to believe that the pair is going to push down even more
EURGBP: Bearish Forecast & Outlook
The charts are full of distraction, disturbance and are a graveyard of fear and greed which shall not cloud our judgement on the current state of affairs in the EURGBP pair price action which suggests a high likelihood of a coming move down.
Disclosure: I am part of Trade Nation's Influencer program and receive a monthly fee for using their TradingView charts in my analysis.
❤️ Please, support our work with like & comment! ❤️
DeGRAM | EURGBP exited the channel📊 Technical Analysis
● Fresh rejection at the blue resistance line (~3 435) pushed XAU back to the 3 355 mid-band, yet successive higher-lows (green arrows) keep price inside the May-origin rising channel.
● The pullback is probing 3 328-3 355 — confluence of the former flag roof and triangle top; holding this zone should launch another test of 3 400/3 435, with the channel crest targeting 3 500.
💡 Fundamental Analysis
● U-S S&P-Global PMIs softened, nudging 2-yr real yields to three-week lows, while cautious ECB rhetoric limits dollar gains — both supportive for gold.
✨ Summary
Long 3 328-3 355; above that aims 3 400 ➜ 3 435, stretch 3 500. Invalidate on an H4 close below 3 293.
-------------------
Share your opinion in the comments and support the idea with like. Thanks for your support!
EUR GBP: Long EUR GBP long 'relative fundamental' trade, based on the fairly 'hawkish' ECB and also today's and yesterday's 'soft' UK data. Entry 0.8712
The risk to the trade is the fact the stop loss is not behind a solid 'upswing of note'. But this is the only moment I have to potentially trade today and I think it's worth a go.
I do think a 'risk on' trade is also viable (which is also a risk if the GBP strengthens in a positive environment). But I've chosen to go with the 'freshness' of the UK data.
EUR GBP has a low ATR, the trade has a 10 pip stop loss and 15 pip profit target.
If it's ongoing, I will close the trade before end of day to avoid weekend risk.

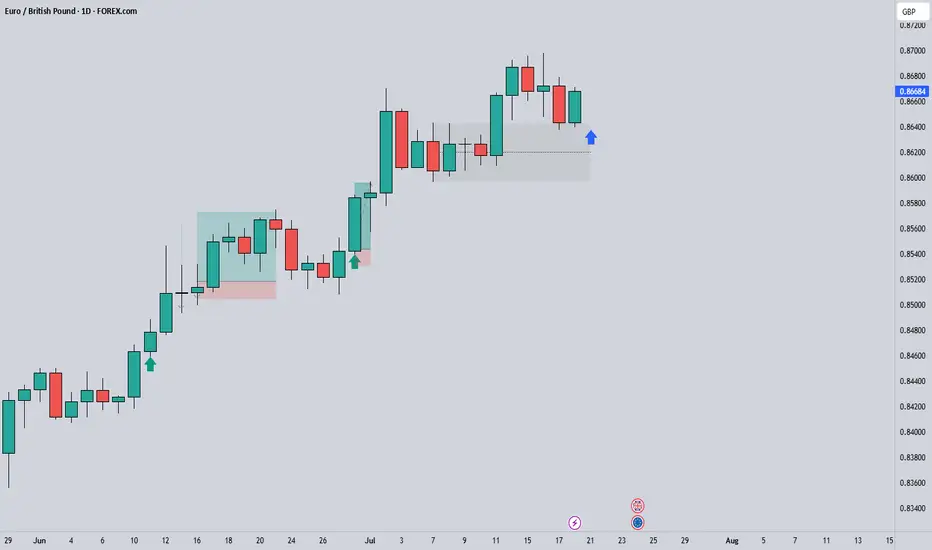
EURGBP Long Project1. Price Drivers: higher timeframe demand
2. Current Trend: up
3. Momentum: bullish
Action: Waiting for entry on the intraday timeframe (entry will be published further)
*Disclaimer: I will not accept liability for any loss or damage, including without limitation to any loss of profit, which may arise directly or indirectly from use of or reliance on such information.
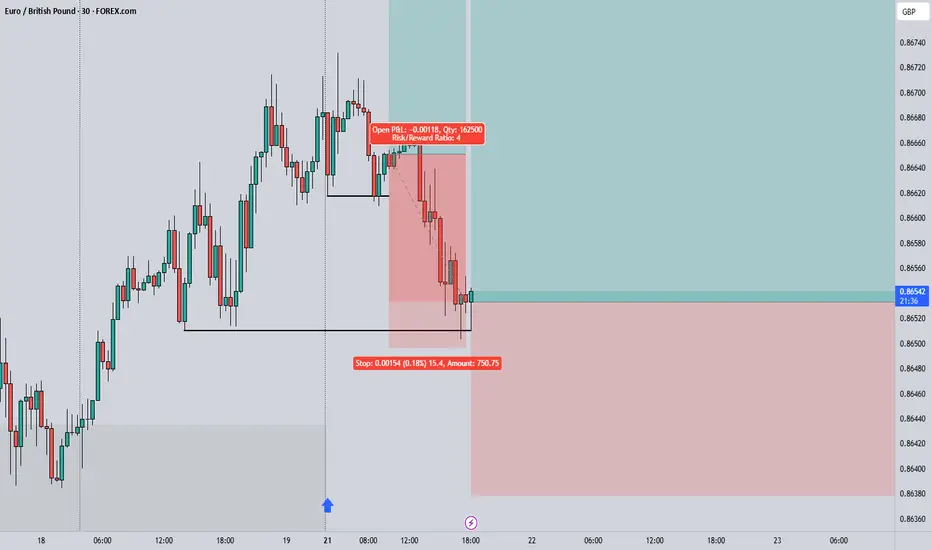
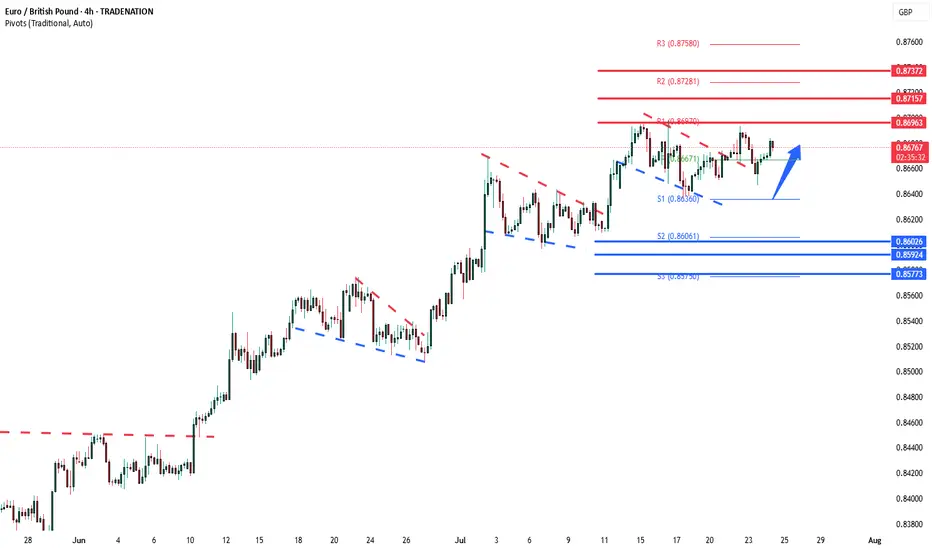
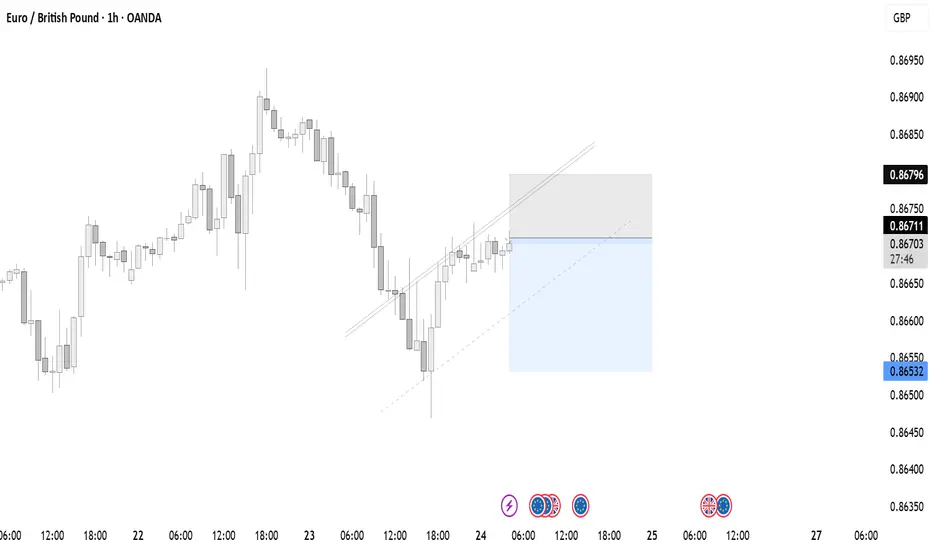
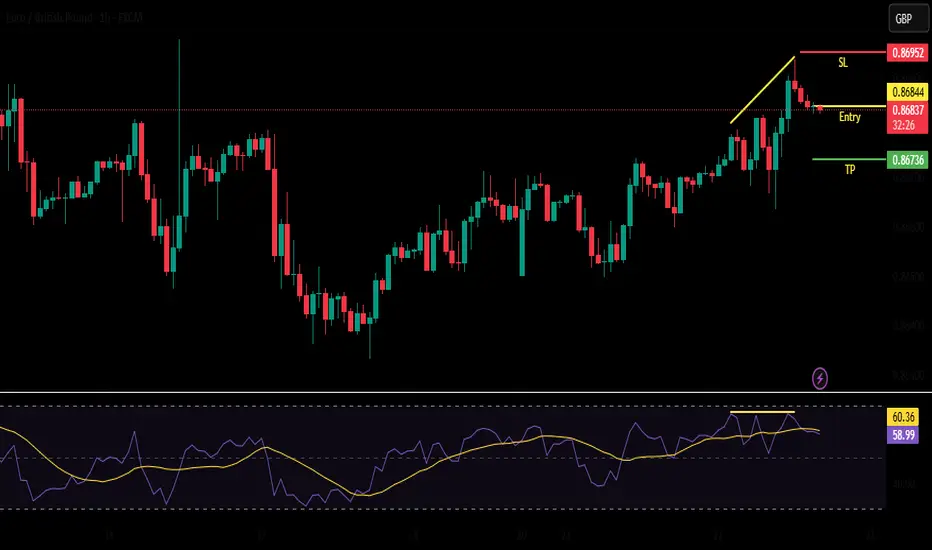
EURGBP 2nd Buy EntryEntry: 0.86533
Stop Loss (R): 0.86379
Take Profit (4R): 0.87149
*Disclaimer: I will not accept liability for any loss or damage, including without limitation to any loss of profit, which may arise directly or indirectly from use of or reliance on such information.
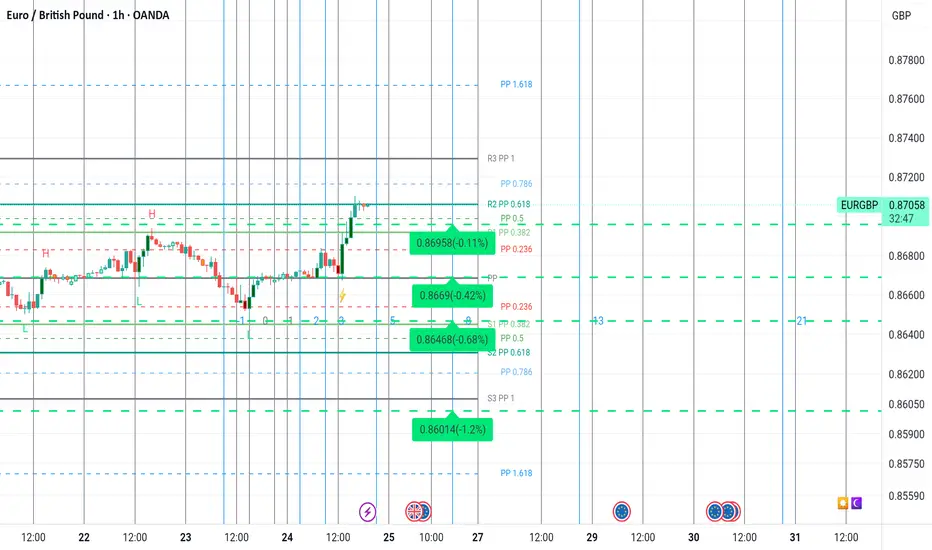
Eurgbp sellI'm just waiting now for confirmation candles but looks good too sell from this current mark , and I can see a take profits area at 0.8669 will probably pull a lot further down but I'm fine with that and on to the next little and often is my philosophy to trade let's not get greedy belly
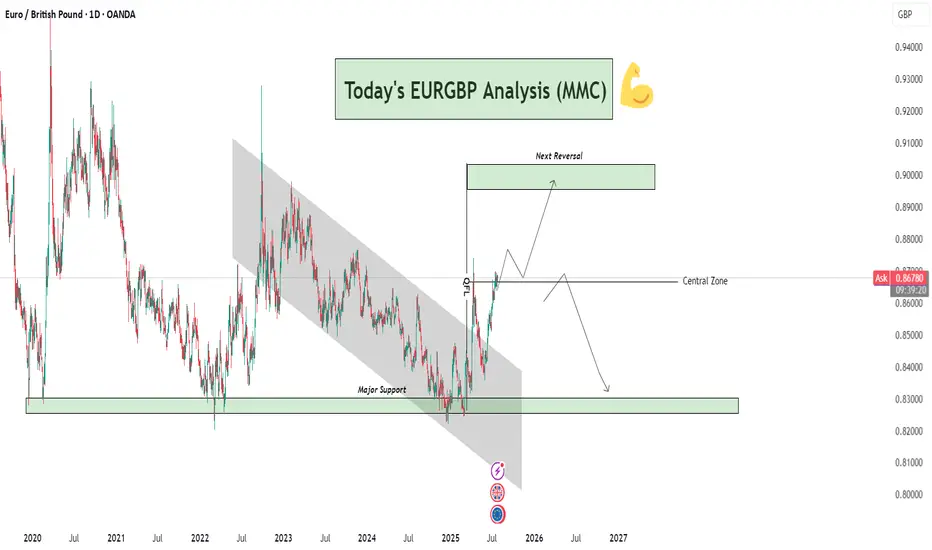
EURGBP Analysis : Breakout, Central Zone Flip & Reversal Target🧠 Overview:
This EURGBP daily chart clearly presents a bullish breakout from a long-term descending channel, a successful reclaim of the central structure zone, and a projection toward a key reversal level. This analysis incorporates Smart Money Concepts (SMC), Market Maker Concepts (MMC), and classic structural behavior.
🔍 Technical Breakdown:
📉 Long-Term Bearish Channel (2021–2025)
For nearly 4 years, EURGBP was trapped in a descending channel, forming consistent lower highs and lower lows.
This long-term bearish phase reflects strong supply-side control and institutional distribution.
The breakout above this structure is significant — marking a potential mid- to long-term trend reversal.
🔁 Major Support Zone (0.8300–0.8350)
Price bounced strongly from this historical demand zone multiple times (in 2021, 2022, and recently in 2025).
This zone is critical and acts as a high-volume accumulation area where smart money has stepped in.
The strong reaction from this level in 2025 triggered the breakout of the bearish structure.
🚀 Break of Structure + Retest
After breaking the descending channel, price retested the upper boundary, confirming a structure shift.
The breakout retest succeeded — marking the transition from a bearish phase to a bullish expansion.
📍 Central Zone Flip
The Central Zone, once a resistance/supply area during the downtrend, has now been reclaimed as support.
This is a powerful MMC concept – where the "central balance" of a structure flips and becomes a base for the next impulse.
Current price is sitting just above this zone, indicating bulls are still in control.
🎯 Next Reversal Zone (Target Area: 0.9000–0.9050)
The chart outlines a projected bullish move toward the Next Reversal Zone marked above.
This is a key supply area, likely to trigger profit-taking or institutional sell orders.
Expect price to range or wick into this zone before showing a possible bearish reversal.
🔄 Future Projection Scenarios:
Scenario 1 – Bullish Continuation:
Price continues to build bullish structure and approaches the 0.90 reversal zone.
Rejection from this zone may trigger consolidation or a minor retracement.
Scenario 2 – Major Reversal:
Upon hitting the next reversal zone, price could reverse and fall back toward the Central Zone or even the Major Support below, especially if macroeconomic fundamentals shift.
🔑 Confluences Supporting This Setup:
✅ Element 🧩 Description
🔹 Major Support Historical demand zone with repeated rejections
🔹 Channel Breakout Structure shift confirming bullish interest
🔹 Retest Success Technical confirmation of breakout validity
🔹 Central Zone Flip Old resistance → new support (MMC principle)
🔹 Reversal Zone Anticipated next profit-taking / supply area
📌 Strategic Insight:
Bias: Bullish short-term to mid-term
Entry Opportunity: Lower timeframe pullbacks into Central Zone (or retest zones)
Target: 0.9000–0.9050 area
Watch for Rejection: In reversal zone for potential bearish shift
⚠️ Risk Note:
Always wait for confirmation at reversal zones. Overextended moves without correction can quickly retrace. Manage your trades with stop-losses below key structural levels and maintain strict risk-reward planning.
🧠 Conclusion:
EURGBP has transitioned from a long bearish cycle into a bullish expansion phase. Smart Money accumulation at the base and a clean breakout with retest confirm a strong directional shift. Keep your focus on the Central Zone retests and the Reversal Zone reaction for optimal entries or exits.
EURGBP pivotal level at 0.8640The EURGBP remains in a bullish trend, with recent price action showing signs of a corrective pullback within the broader uptrend.
Support Zone: 0.8620 – a key level from previous consolidation. Price is currently testing or approaching this level.
A bullish rebound from 0.8620 would confirm ongoing upside momentum, with potential targets at:
0.8700 – initial resistance
0.8715 – psychological and structural level
0.8740 – extended resistance on the longer-term chart
Bearish Scenario:
A confirmed break and daily close below 0.8620 would weaken the bullish outlook and suggest deeper downside risk toward:
0.8600 – minor support
0.8590 – stronger support and potential demand zone
Outlook:
Bullish bias remains intact while the EURGBP holds above 0.8620. A sustained break below this level could shift momentum to the downside in the short term.
This communication is for informational purposes only and should not be viewed as any form of recommendation as to a particular course of action or as investment advice. It is not intended as an offer or solicitation for the purchase or sale of any financial instrument or as an official confirmation of any transaction. Opinions, estimates and assumptions expressed herein are made as of the date of this communication and are subject to change without notice. This communication has been prepared based upon information, including market prices, data and other information, believed to be reliable; however, Trade Nation does not warrant its completeness or accuracy. All market prices and market data contained in or attached to this communication are indicative and subject to change without notice.
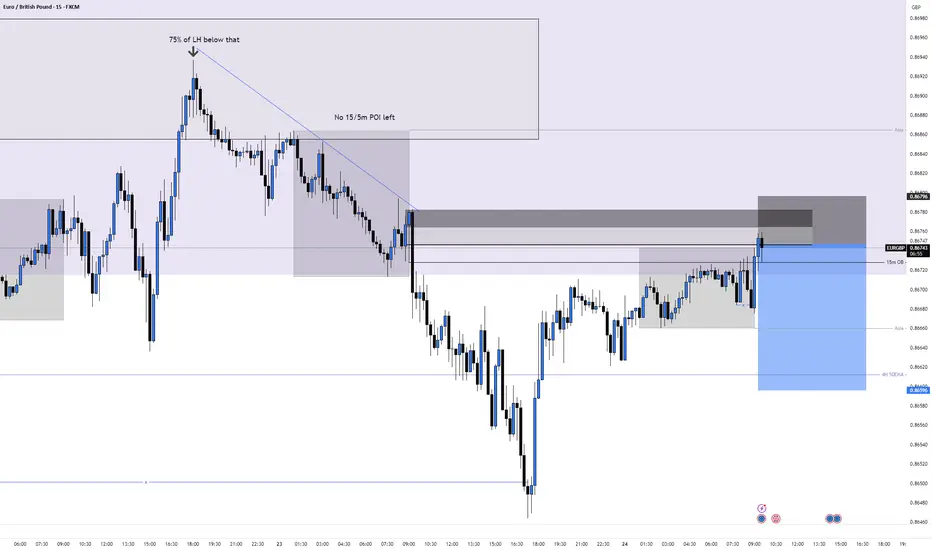
EURGBP Short, 24 July Playing Off 15m POI After HTF Wick Rejection
HTF shows strong rejection from Weekly Highs with clear wick activity, and price tapped into a 4H Orderblock 📉
Structure shifted bearish on LTF with a clean 15m BOS — the last OB from the full move is now in play.
Asia high sits above and can’t be covered with a 10 pip stop, so I used a tighter 5 pip SL to cover just the OB (high probability since no key zones sit above) ✅
📉 Confluences:
– Weekly High wick rejection
– 4H OB tapped
– 15m BOS
– 1m BOS from 15m POI
– Entry from cleaner 5m OB inside 15m OB
🎯 TP: Targeting Asia Low
💰 RR: 5 pip SL improves RR since GU moves slow
🛡️ SL: Tight stop covering only the OB — if invalidated, setup likely fails anyway
Sell EURGBPEURGBP is beginning to turn around after a great 3 month bull run. Price is indicative of bearish movement.
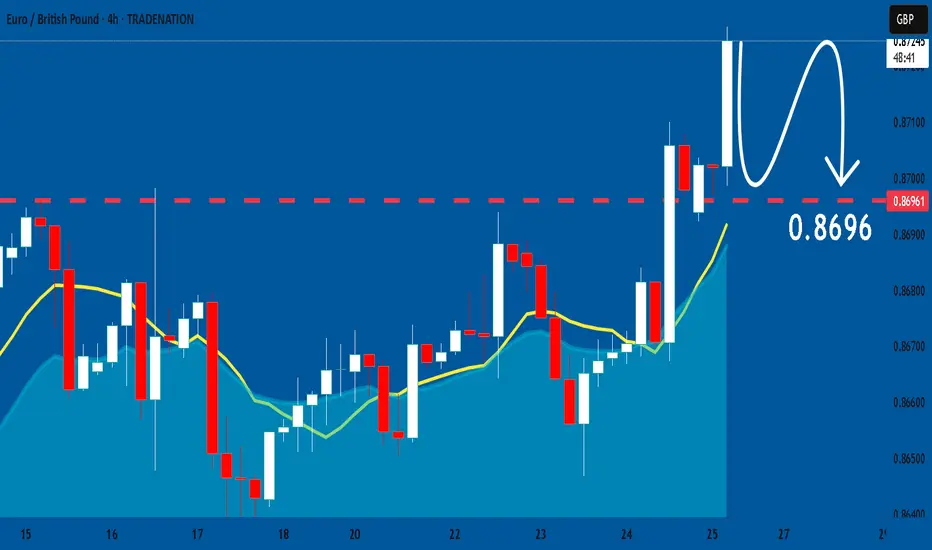
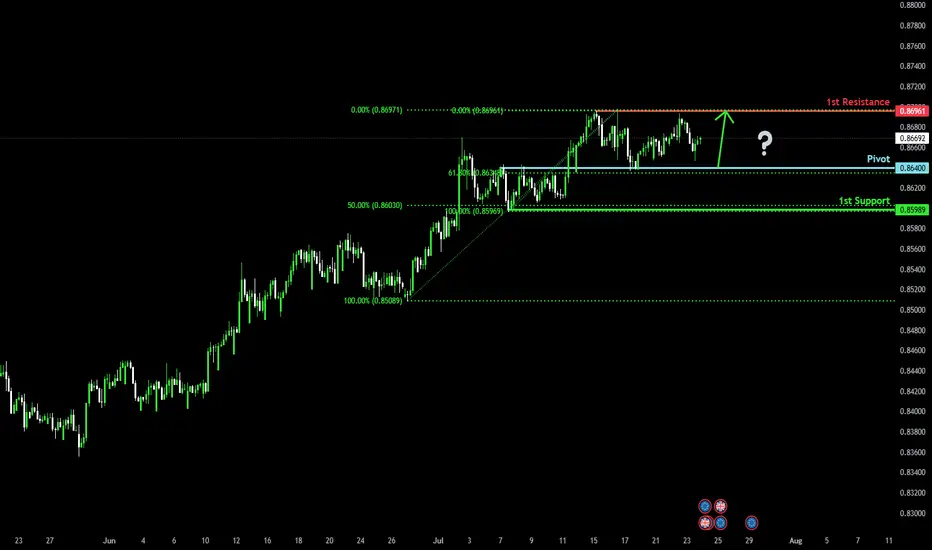
Bullish bounce off overlap support?EUR/GBP is falling towards the pivot, which has been identified as an overlap support and could bounce to the 1st resistance, which acts as a swing high resistance.
Pivot: 0.8640
1st Support: 0.8598
1st Resistance: 0.8696
Risk Warning:
Trading Forex and CFDs carries a high level of risk to your capital and you should only trade with money you can afford to lose. Trading Forex and CFDs may not be suitable for all investors, so please ensure that you fully understand the risks involved and seek independent advice if necessary.
Disclaimer:
The above opinions given constitute general market commentary, and do not constitute the opinion or advice of IC Markets or any form of personal or investment advice.
Any opinions, news, research, analyses, prices, other information, or links to third-party sites contained on this website are provided on an "as-is" basis, are intended only to be informative, is not an advice nor a recommendation, nor research, or a record of our trading prices, or an offer of, or solicitation for a transaction in any financial instrument and thus should not be treated as such. The information provided does not involve any specific investment objectives, financial situation and needs of any specific person who may receive it. Please be aware, that past performance is not a reliable indicator of future performance and/or results. Past Performance or Forward-looking scenarios based upon the reasonable beliefs of the third-party provider are not a guarantee of future performance. Actual results may differ materially from those anticipated in forward-looking or past performance statements. IC Markets makes no representation or warranty and assumes no liability as to the accuracy or completeness of the information provided, nor any loss arising from any investment based on a recommendation, forecast or any information supplied by any third-party.
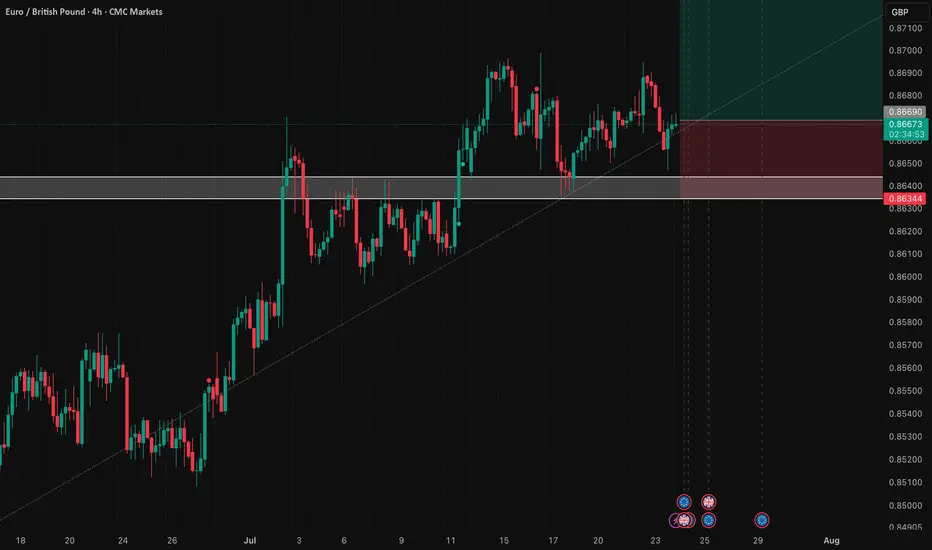
EUR/GBP: Bullish Stance Above 0.8640This signal outlines a tactical long entry on EUR/GBP, positioning for a bullish resolution from today's major fundamental events.
📰 Fundamental Thesis
This position is taken ahead of the two primary market movers: the ECB rate decision and the UK PMI data. The core thesis is that the ECB policy statement will be the dominant catalyst, providing strength to EUR that will outweigh the impact of the UK data release.
📊 Technical Thesis
The trade is defined by a sound technical structure. The stop loss is anchored beneath the critical support zone at 0.8640. The profit target is set to challenge the resistance area just above 0.8722. This setup offers a favorable and clearly defined risk-to-reward profile.
🧠 Risk Management
Execution is timed before extreme event-driven volatility. Adherence to the stop loss is critical to manage the inherent risk of this pre-news strategy.
Trade Parameters
⬆️ Direction: Long (Buy)
➡️ Entry: 0.86690
⛔️ Stop Loss: 0.86344
🎯 Target: 0.87382
✅ Risk/Reward: 1:2
EURGBP: Will Keep Growing! Here is Why:
The recent price action on the EURGBP pair was keeping me on the fence, however, my bias is slowly but surely changing into the bullish one and I think we will see the price go up.
Disclosure: I am part of Trade Nation's Influencer program and receive a monthly fee for using their TradingView charts in my analysis.
❤️ Please, support our work with like & comment! ❤️

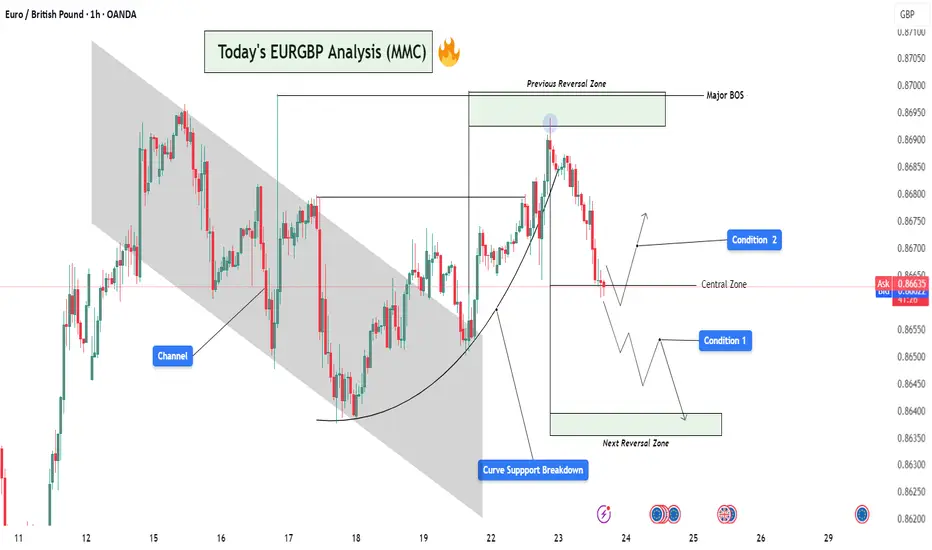
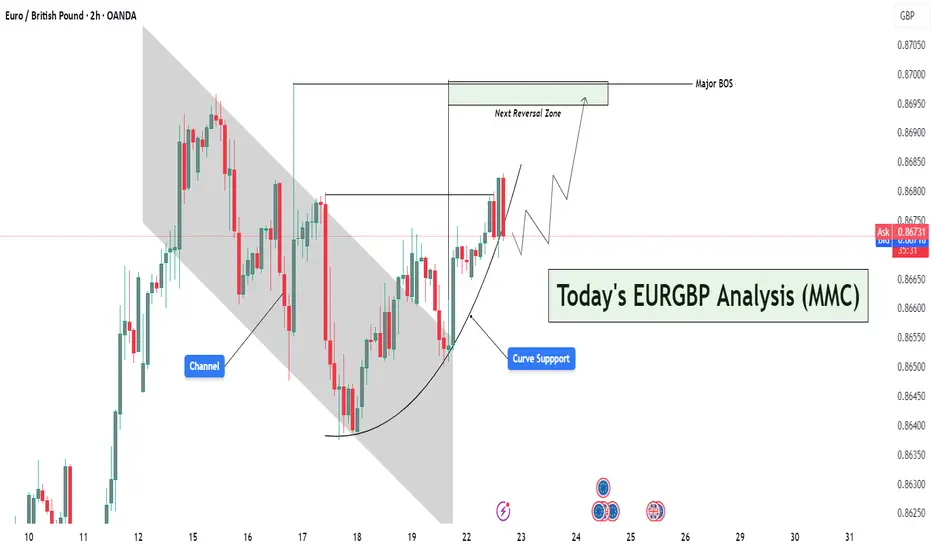
EURGBP Analysis : Curve Breakdown + Directional Setup + Target🧠 Institutional Context & Smart Money Bias
This EURGBP chart offers a masterclass in engineered liquidity and market traps. Institutions have created an illusion of bullish strength through:
A manipulated rounded accumulation curve
A controlled channel phase
A false breakout above the reversal zone
These are textbook signals that the retail crowd is being misled, while smart money is preparing for a deeper move. Let’s dissect it step by step.
📊 Phase-by-Phase Technical Breakdown
🔻 1. Bearish Channel – Sentiment Shaping Phase
From July 11 to July 21, the pair traded within a descending parallel channel, forming a bearish market structure.
This phase was not a genuine trend, but a sentiment builder—to:
Create a belief in continued bearishness
Gather liquidity around the channel boundaries
The upper and lower bounds of the channel were respected precisely, revealing market maker intent.
📈 2. Parabolic Curve Support – Trap Engineered
Price transitioned out of the channel into a rounded bullish curve—a visual cue suggesting accumulation and strength.
This curved trendline often misleads retail traders into thinking a breakout rally is coming.
Price surged aggressively toward the Previous Reversal Zone, further fueling FOMO buys.
But this move was not sustainable. Why?
➡️ Because it lacked a clean base and was built off a manipulated liquidity sweep. The curve was a setup.
🟥 3. Previous Reversal Zone & Major BOS – Institutional Exit Point
Price entered the Previous Reversal Zone, a marked area of prior supply.
This is where institutional orders were likely resting.
After briefly exceeding the previous high, the market instantly reversed with force—evidence of:
Stop hunts
Distribution
Smart money selling into retail breakout buyers
The Major BOS (Break of Structure) confirms the shift: The trend is no longer bullish.
⚠️ 4. Curve Support Breakdown – Structure Shift Triggered
After peaking, the price violated the curve support, confirming the bullish trap.
This breakdown signals a phase transition:
From accumulation illusion → distribution reality
From retail optimism → smart money unloading
🟨 5. Central Zone – Decision Point
Price is now hovering at the Central Zone, a region of equilibrium between buyers and sellers.
This is where market makers may:
Redistribute for another leg down
Fake a pullback before continuing lower
Temporarily rally to trap more longs
This area will determine short-term directional bias. That’s why your setup smartly outlines two conditions from this point.
🔀 Trade Scenarios – MMC Conditions
🔻 Condition 1: Bearish Continuation Toward Next Reversal Zone
If the price rejects the Central Zone and begins forming lower highs and bearish structures:
Expect further downside
This confirms the market is in redistribution mode
Target: Next Reversal Zone at 0.8630–0.8640
💡 Rationale: Institutions are driving price back into demand zones to grab new liquidity or fill leftover buy orders.
🔁 Condition 2: Temporary Recovery & Trap Continuation
If price holds above the Central Zone and breaks short-term highs:
A short-term bullish rally may occur
Likely targets: 0.8675–0.8685
This may act as a fake-out rally, creating more buying interest before a deeper dump
💡 Rationale: Smart money may induce more buyers to create fresh liquidity pockets before dropping toward the next reversal zone.
🔐 Key MMC Zones & Structure Levels
Zone/Level Purpose
0.8695–0.8700 Previous Reversal Zone / Major BOS – Institutional distribution area
0.8660–0.8665 Central Zone – Mid-point equilibrium & battle zone
0.8630–0.8640 Next Reversal Zone – Potential bullish interest area for demand
🧠 Smart Money Summary
This chart showcases a multi-stage smart money plan:
Create channel to shape bias
Form curve to generate false hope
Push into supply and trap late buyers
Break curve support to shift structure
Retest Central Zone to decide next manipulation leg
Deliver price toward true unfilled demand zones
This is how institutions engineer movement while retail gets trapped chasing direction.
EURGBP Pushing Up about to reach Major Resistance Level!EURGBP has been in a nice uptrend on the 1D and 4H.
Now, it is reaching a major resistance level at 0.86900.
Looking at the strong buying, there is a chance that price may break that level a move above 0.86900, but that is yet to be determined.
I've taken a demo position in this case, aiming 1:1 but possibly aiming for that 0.86900 level.
I saw a nice bounce of the 20 EMA and also that the 20, 50 and 200 EMA are lined very well. The RSI is also pointing upwards suggesting some strength.
It's been a while since the entry has passed by, but I'd like to post this idea to document this trade.
When price comes at the 0.86900 level, we can see what happens at the time and decide whether we are long or short.
It'll be interesting to see how this trade plays out.

EURGBP | BearishEURGBP has printed double top with bearish RSI trend on RSI.Furthermore, Sellers has taken control and pushing the price lower with little or no support from the buyers.
EURGBP The Target Is DOWN! SELL!
My dear friends,
Please, find my technical outlook for EURGBP below:
The price is coiling around a solid key level - 0.8676
Bias - Bearish
Technical Indicators: Pivot Points High anticipates a potential price reversal.
Super trend shows a clear sell, giving a perfect indicators' convergence.
Goal - 0.8670
About Used Indicators:
The pivot point itself is simply the average of the high, low and closing prices from the previous trading day.
Disclosure: I am part of Trade Nation's Influencer program and receive a monthly fee for using their TradingView charts in my analysis.
———————————
WISH YOU ALL LUCK

EURGBP Curved Support Breakout – Targeting Reversal Zone🔍 Market Context & Structural Narrative (MMC Style)
The EURGBP pair is currently displaying a textbook MMC structural evolution, transitioning from a bearish trend into a potential bullish leg driven by curve dynamics and trap-break logic.
🔨 Phase 1: Bearish Channel & Trap Formation
The market initially moved within a clearly defined descending channel, which acted as a trap for reactive sellers. Each lower high and lower low within the channel created a perception of sustained bearishness, luring breakout traders and late sellers into short positions.
✅ Key Insight:
This trap zone represents the first step in MMC logic — create a visible structure, generate bias, then prepare for inversion.
🌙 Phase 2: Curve Support – Psychological Accumulation
Around the base of the channel, the market began forming a rounded bottom or curve support. This is a signature MMC accumulation pattern, where market makers gradually absorb sell orders and build long positions without triggering immediate attention.
The curve support has the following implications:
Represents passive accumulation.
Suggests waning bearish pressure.
Builds bullish pressure subtly, often missed by retail traders.
🧠 MMC Mindset Tip:
Curved price action isn't just technical — it's psychological. It represents a controlled shift in sentiment, not an impulsive change, which is what makes it so powerful.
💥 Phase 3: Break of Structure (BOS) – Confirmation of Strength
Price breaks out of both the descending channel and the curved base, leading to a Major Break of Structure (BOS). This BOS is critical, as it confirms the invalidity of the previous bearish narrative and activates a new bullish leg.
📌 This BOS is more than a line — it’s a wall of liquidity getting broken. Price has now closed above key swing highs, which suggests:
Smart money is in control.
Trend shift is validated.
New demand zone created below.
🎯 Projection: The Path to the Next Reversal Zone (NRZ)
Following the breakout, price is projected to:
Possibly retest the breakout level (structure retest) aligned with the curve support — a healthy bullish pullback.
Then move higher towards the Next Reversal Zone (NRZ), which is your defined target area.
📌 NRZ Insight:
This zone is where the market is likely to face:
High liquidity.
Strong previous supply.
Potential profit-taking by early bulls.
Thus, this becomes the make-or-break zone — price either:
Reverses sharply,
Or breaks through and continues the bull rally.
⚠️ Multiple Scenarios Based on MMC Conditions
✅ Scenario 1: Retest & Bounce (Ideal MMC Setup)
Price pulls back to retest the breakout level or the curve support.
Shows bullish confirmation (e.g., pin bar, bullish engulfing).
Targets the NRZ above 0.8700.
❌ Scenario 2: Failed Retest – Fakeout Trap
Price breaks below the curve and structure again.
Suggests that the BOS was a false breakout.
Could re-enter the previous bearish channel structure.
🔄 Scenario 3: Direct Rally Without Retest
Strong momentum buyers push price directly to NRZ.
Wait for reaction at NRZ — could trigger a reversal or continuation depending on price behavior.
🧠 MMC Strategic Takeaways:
Trap → Break → Shift is the psychological framework in play.
The curve is not just support — it's evidence of silent accumulation.
The NRZ isn’t just resistance — it's the battleground where MM logic resolves.
🔐 Trading Insights (Optional Entry Ideas):
Entry: On bullish confirmation near 0.8660–0.8665 (curve/structure support).
SL: Below curve base (e.g., 0.8640).
TP: Near or slightly below NRZ (0.8700–0.8705), partial profits or full exit.
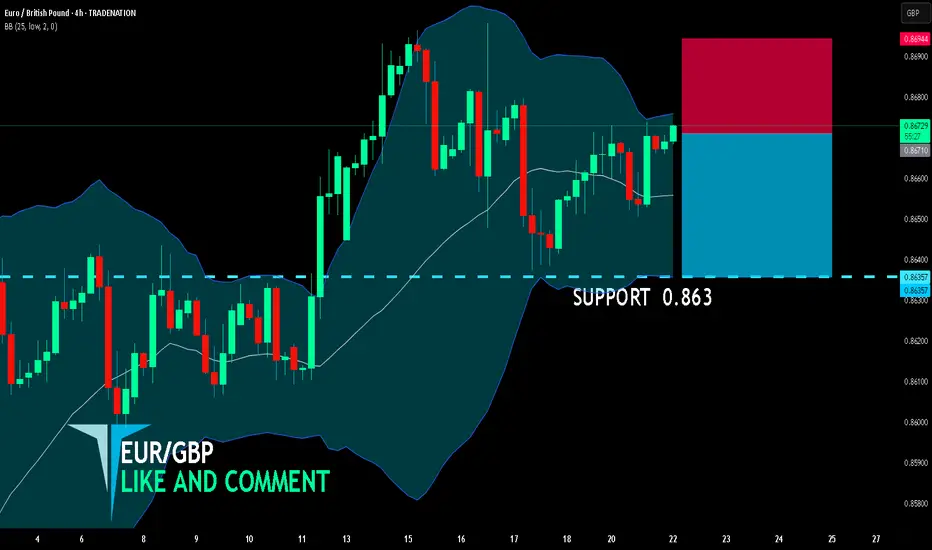
EUR/GBP SHORT FROM RESISTANCE
EUR/GBP SIGNAL
Trade Direction: short
Entry Level: 0.867
Target Level: 0.863
Stop Loss: 0.869
RISK PROFILE
Risk level: medium
Suggested risk: 1%
Timeframe: 4h
Disclosure: I am part of Trade Nation's Influencer program and receive a monthly fee for using their TradingView charts in my analysis.
✅LIKE AND COMMENT MY IDEAS✅