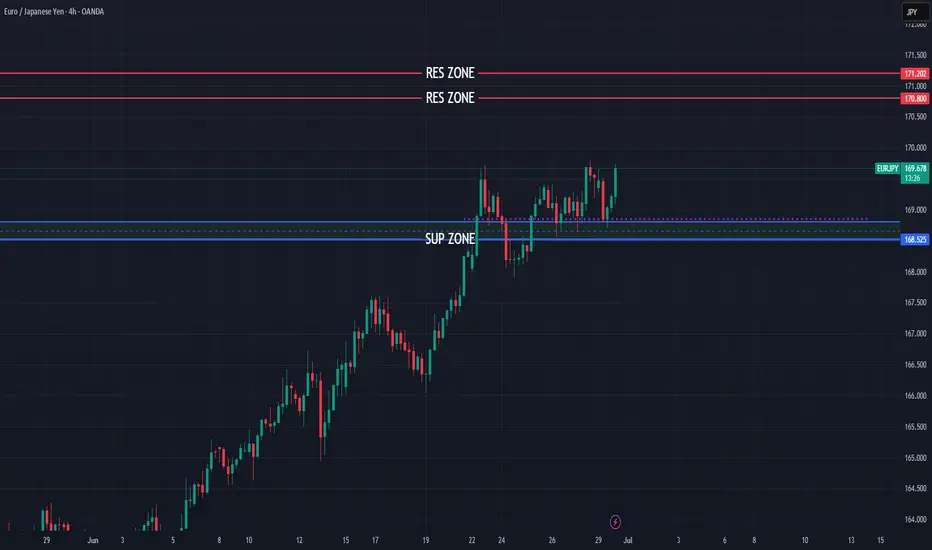
EURJPY can we see one more bullish?
OANDA:EURJPY long time we having bullish push, currently price on sup zone, from which expecting one more bullish.
SUP zone: 168.800
RES zone: 170.800, 171.200
EURJPY trade ideas
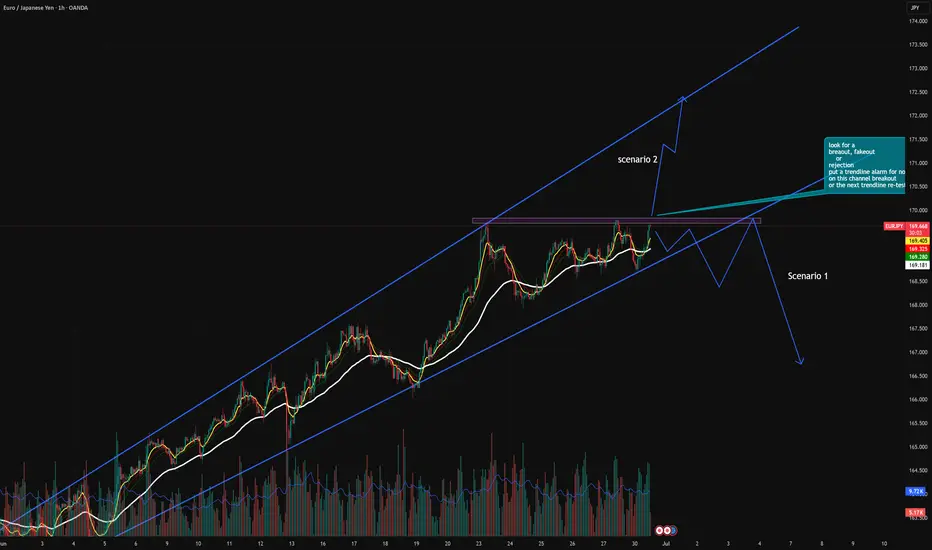
EUR/JPY 1H Analysis – Ascending Channel With Critical ResistanceThe EUR/JPY pair has been trending steadily inside a well-defined ascending channel, indicating bullish control over the past few weeks. However, price is now approaching a major horizontal resistance zone, aligning with the upper boundary of the channel — a critical area for potential breakout or reversal.
🔍 Chart Structure Breakdown:
🔹 1. Ascending Channel (Trend Continuation Structure)
The pair is respecting both the upper and lower trendlines precisely, forming a bullish parallel channel.
EMAs are aligned bullishly and acting as dynamic support.
Price continues forming higher highs and higher lows, a classic uptrend behavior.
🔹 2. Horizontal Resistance Zone (Purple Box)
The price is currently retesting a key horizontal resistance zone where sellers previously stepped in.
This zone aligns closely with the upper channel boundary, increasing confluence.
We could be witnessing a potential double top or a breakout build-up.
🔹 3. Volume Spike & Buyer Strength
Recent candles show increased volume — a possible signal that institutions are preparing for a larger move.
If volume increases further on breakout, it would confirm continuation.
🧭 Scenarios to Watch:
🟢 Bullish Scenario:
A strong breakout above the purple zone with a full-body candle close could signal:
A breakout from the ascending channel.
Fresh bullish momentum possibly targeting the 170.800–171.500 zone.
Ideal entry: On bullish retest of the breakout zone.
SL below breakout candle; TP at upper Fibonacci extensions.
🔴 Bearish Scenario (Double Top Rejection):
If price rejects the resistance zone again, forming a lower high or engulfing candle:
Expect a short-term pullback toward the midline or lower channel, around 168.500–168.000.
Bearish divergence with RSI or volume may confirm weakness.
This would create a Double Top inside the channel, often leading to a deeper correction.
📌 Conclusion:
EURJPY is at a make-or-break zone. The bullish structure remains intact, but the price must break and hold above the resistance to confirm strength. Until then, this could be a short-term exhaustion point.
🔄 Stay flexible. Watch volume, candle closes, and EMA behavior for confluence on your trade setup.
This analysis and chart work are entirely original and created from my own observations and strategy. Any resemblance to other posts is purely coincidental.
⚠️ Disclaimer:
This analysis is for educational and informational purposes only and does not constitute financial advice or a buy/sell recommendation. All views expressed are my own, based on personal technical interpretation.
Oderblock liquidity The market will create a structure within a structure to try to push the market back to the traps ,all you have to do is wait and be a friend of the trend

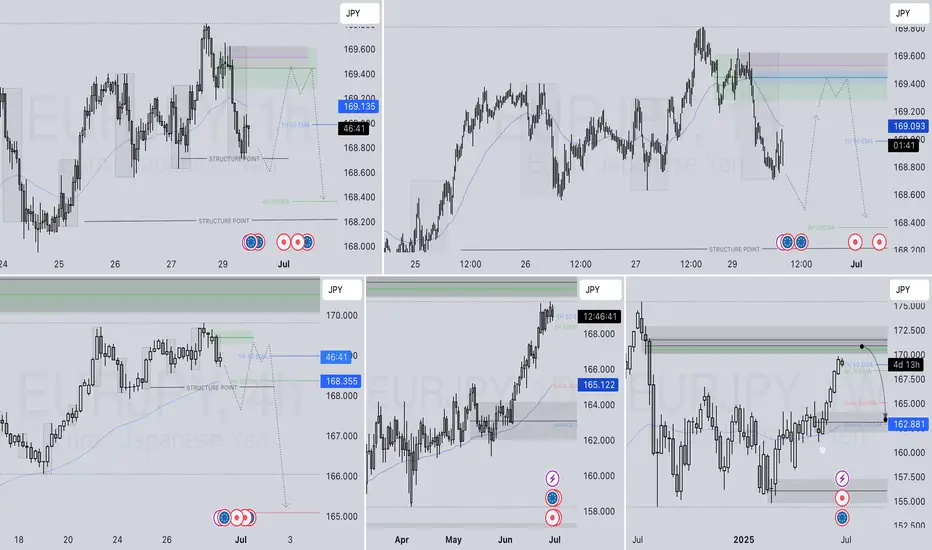
EURJPY SHORT DAILY FORECAST Q3 D30 W27 Y25EURJPY SHORT DAILY FORECAST Q3 D30 W27 Y25
Professional Risk Managers👋
Welcome back to another FRGNT chart update📈
Diving into some Forex setups using predominantly higher time frame order blocks alongside confirmation breaks of structure.
Let’s see what price action is telling us today! 👀
💡Here are some trade confluences📝
✅Daily Order block identified
✅4H Order Block identified
✅1H Order Block identified
🔑 Remember, to participate in trading comes always with a degree of risk, therefore as professional risk managers it remains vital that we stick to our risk management plan as well as our trading strategies.
📈The rest, we leave to the balance of probabilities.
💡Fail to plan. Plan to fail.
🏆It has always been that simple.
❤️Good luck with your trading journey, I shall see you at the very top.
🎯Trade consistent, FRGNT X
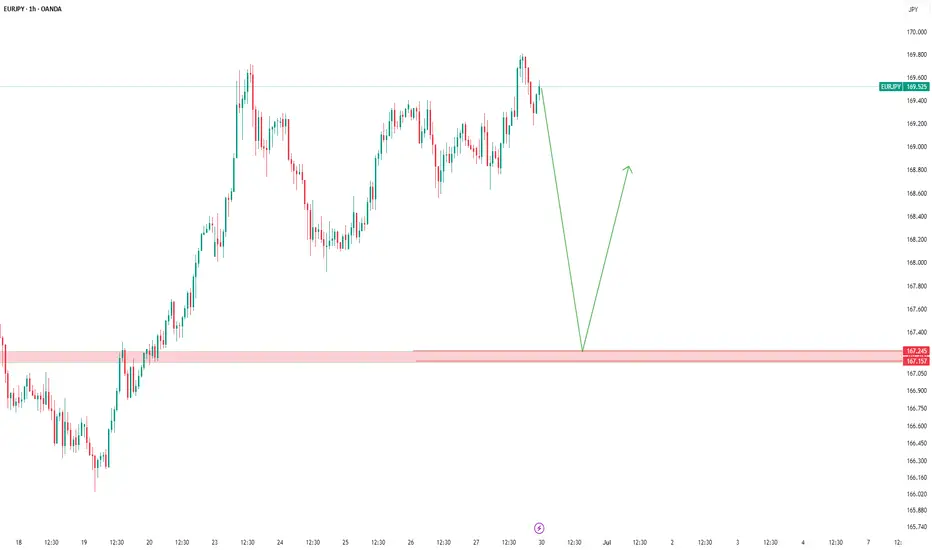
The Correlation Between EURJPY and NASDAQ You Shouldn't IgnoreCurrently keeping a close eye on EURJPY — price action has been bullish 📈, showing a strong upward push on the daily timeframe 🕒.
Right now, we’re seeing a bit of indecision 🤔, which is fairly typical for a Monday session as the market finds its footing.
🔍 I’m watching for continuation to the upside, as long as NASDAQ remains bullish. That said, NASDAQ is looking quite overextended 🧗, and a pullback could trigger a short-term retracement in the euro as well — these two tend to move in correlation 🔗, so keep a close watch on NAS100 for early clues.
If EURJPY consolidates sideways ⏸️, and we then get a clear break of market structure to the upside 🚀, I’ll be looking for a long setup on the retest and failure of the range floor — textbook continuation play 🎯.
As always, this is not financial advice — full breakdown in the video 🎥.

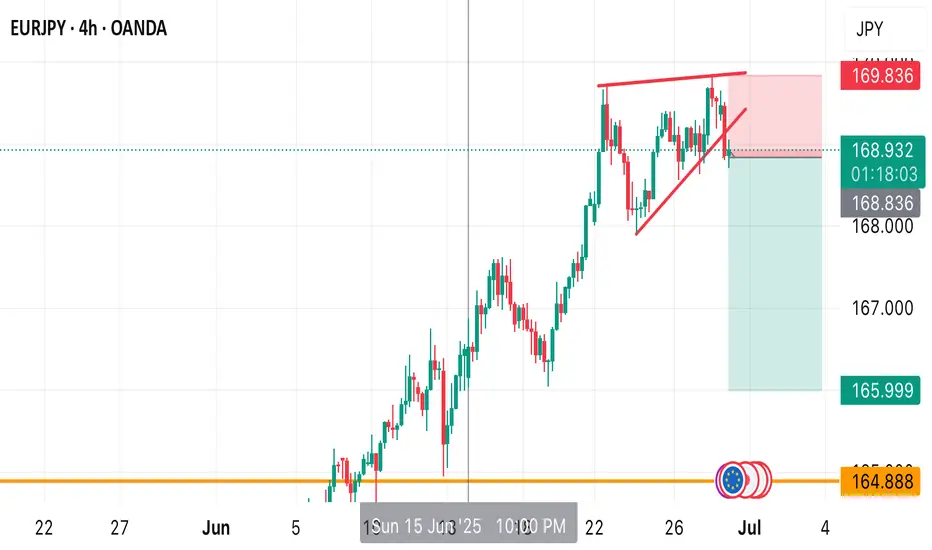
POTENTIAL SELL OPPORTUNITY IN EURJPYPrice is set drop from the current price after we encountered a resistant around the high of 169.836 a sell opportunity is envisaged from the current market price. Target profit is at 165.999
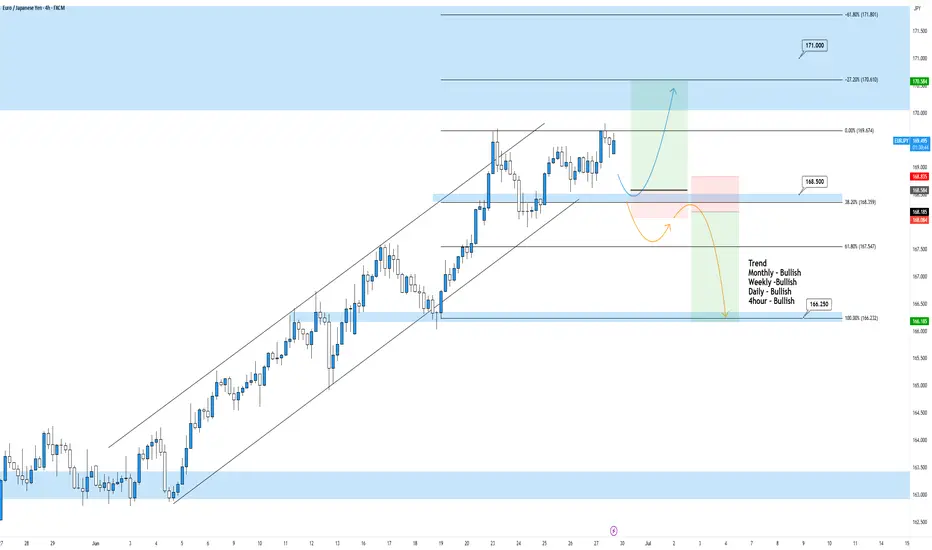
EURJPY 4hour TF - June 29th, 2025EURJPY 4hour Bullish Idea
Monthly - Bullish
Weekly - Bullish
Daily - Bullish
4hour - Bullish
EJ has been in a bullish trend on all timeframes and doesn’t really show any signs of stopping. Currently we are right near major monthly resistance around 171.000. It is likely we will see price action push into this zone but we want to identify a potential trade beforehand.
Here are two potential scenarios for this week on EJ
Bullish Continuation - We are a bit close to the 171.000 monthly zone so we would like to see price action come back to our 168.500 4hour support zone before targeting higher.
Trend Reversal - If we see price action fall below 168.500 we want to see bearish conviction and rejection from that same zone. If this happens we can start to consider short scenarios and target lower support levels like 166.250.
EURJPY ANALYSISAfter seeing the previous weekly candle close bullish confirming buying strength and it could continue into weekly highs and confluences on the daily and the 4hr suggest that too

EURJPY bullish continuation Price is still on uptrend on 3rd wave wave. What we should expect is small pullbacks and continuation up.
EURJPYAs our followers may remember, we already secured a great profit on EURJPY.
Now, we're once again waiting for price to revisit our key level — so we can potentially catch another high-probability setup.
📌 Always remember:
The market is unpredictable.
We're not here to predict — we're here to react, using technical analysis, clear setups, proper risk and trade management.
❌ If a level breaks, we don’t panic.
✅ Instead, we patiently wait for a pullback and take advantage of the next smart entry.
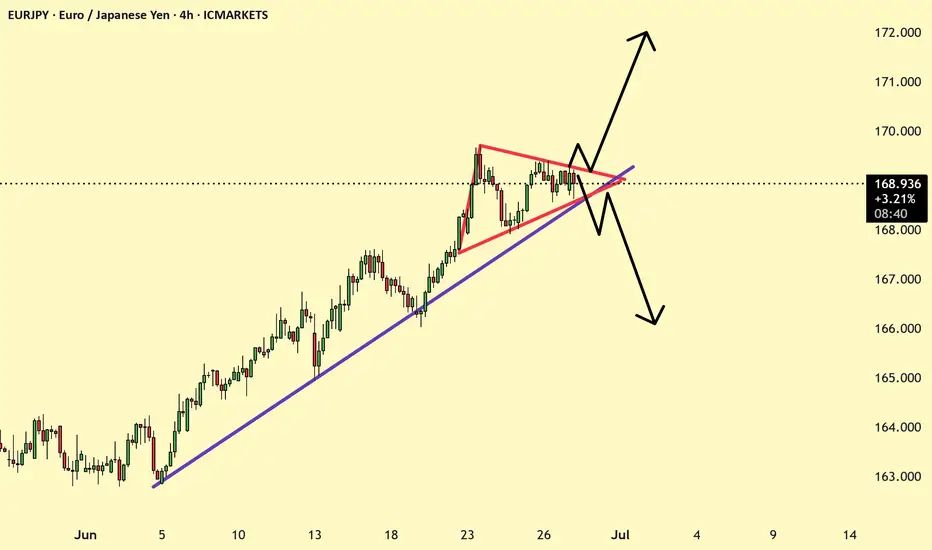
EURJPY POTENTIAL BUY OPPORTUNITY What next on EURJPY after the break of structure we recently had? From the technical perspective, trend remains strongly bullish therefore I anticipate price to breakout of the pennant triangle and retrace the previous resistance which is now broken to become a support. I’m bullish in EURJPY

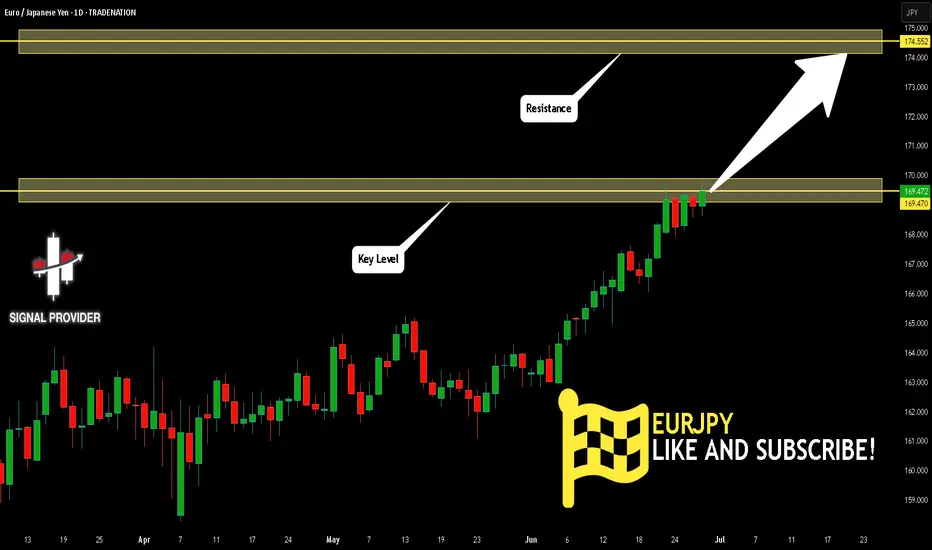
EURJPY Is Very Bullish! Long!
Take a look at our analysis for EURJPY.
Time Frame: 1D
Current Trend: Bullish
Sentiment: Oversold (based on 7-period RSI)
Forecast: Bullish
The market is on a crucial zone of demand 169.470.
The oversold market condition in a combination with key structure gives us a relatively strong bullish signal with goal 174.552 level.
P.S
Please, note that an oversold/overbought condition can last for a long time, and therefore being oversold/overbought doesn't mean a price rally will come soon, or at all.
Disclosure: I am part of Trade Nation's Influencer program and receive a monthly fee for using their TradingView charts in my analysis.
Like and subscribe and comment my ideas if you enjoy them!
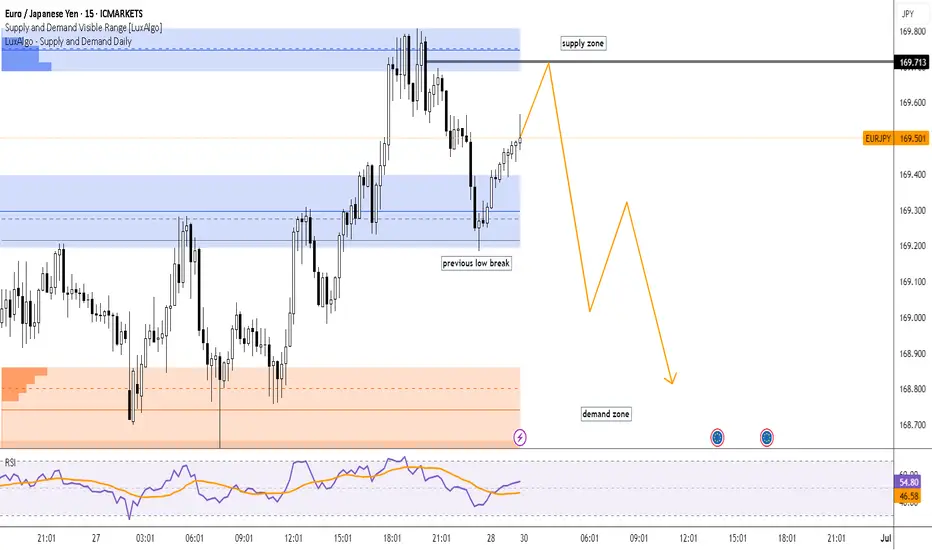
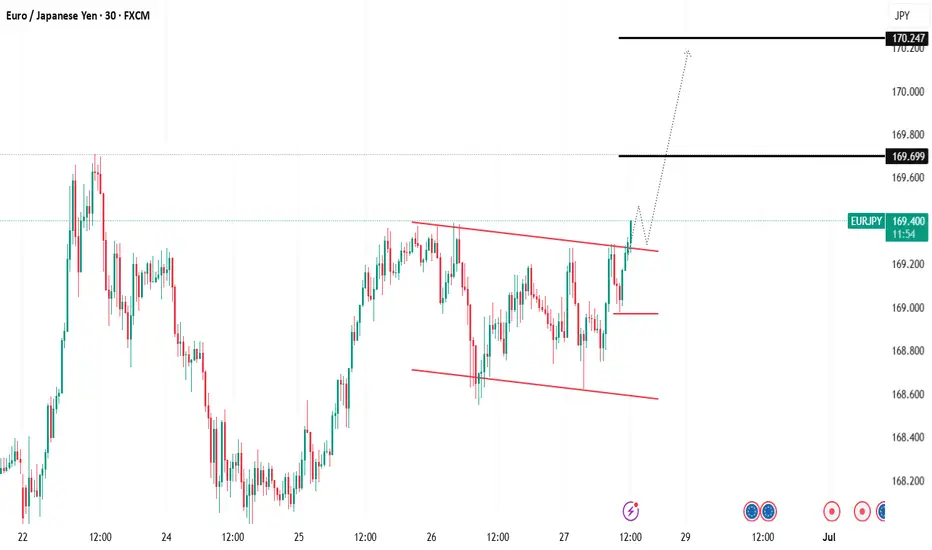
Eur/Jpy breaks the previous🔍 Key Observations:
Supply Zone (169.713):
Price is approaching a marked supply zone, where sellers previously stepped in with strong momentum. This zone could act as a resistance area, potentially rejecting price downward.
Previous Low Break:
The structure shows that price broke below a previous low, indicating bearish pressure and a possible shift in market sentiment.
Demand Zone Below (~168.700):
There's a strong demand zone marked below the current price, which may serve as a target for short sellers or an area for bullish entries if reached.
Projected Move (Orange Arrows):
The orange path suggests a potential move:
Price may first retest the supply zone around 169.713.
A rejection from that level could trigger a downward move, breaking recent support levels.
The price may bounce slightly midway before continuing the drop toward the demand zone.
RSI Indicator (Relative Strength Index):
Currently at 54.80 (blue line), the RSI is nearing overbought territory but not yet extreme. This leaves room for a bit more upside before a potential reversal, aligning with the idea of testing the supply zone first.
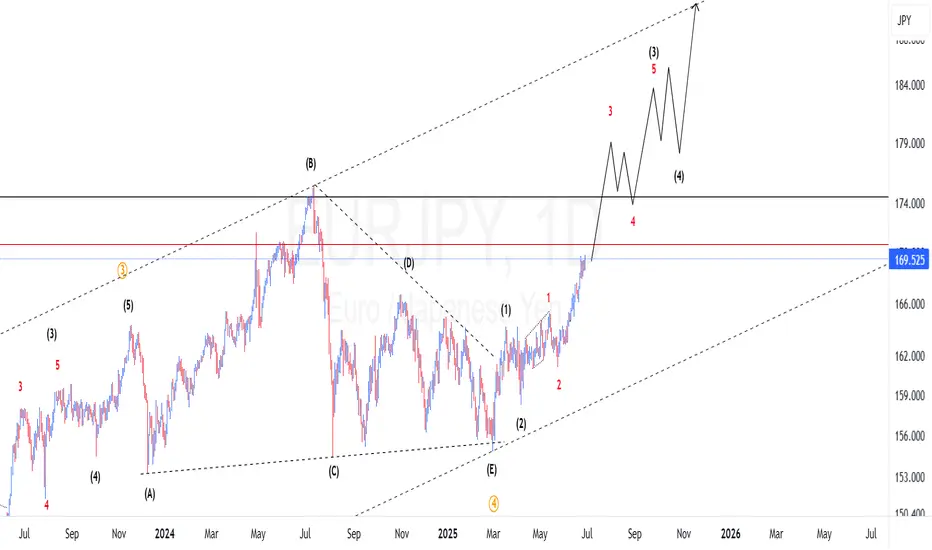
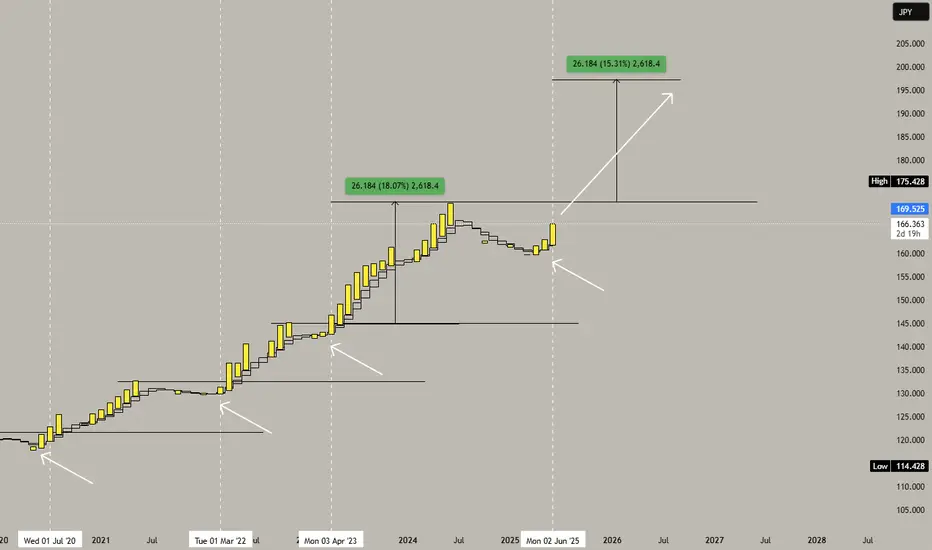
EURJPY MASSIVE RISE for the next few weeks. BUY below 170EURJPY has seen some rosy seasons the past 5 years. Every year it keeps grinding up to reach new highs, from 115 in 2020 to reach a parabolic high last year at 175 on June 2024.
Then, as with any parabolic era, hibernation comes after that peak tap at 175 that lasted 9 months. Price has woken up this year starting on April -- then charging up more this month. This consistent weekly gains is hinting of a bigger shift that only comes every 1-2 years.
From our diagram above you can observe the last big ascend from its big shifts. This shifts resurfaced every 1-2 years. And this quarter 2 we got another rare change in structure conveying a weighty rise ahead in the next 12 months moving forward.
EURJPY corrected heavily back to 1.0 FIB LEVELS, the most discounted bargain zone you can imagine -- so buyers converging on this area is a no brainer.
STRONG BUY at this levels -- below 170 is a definite bargain.
The price growth from the last few weeks is a testament of the directional context EJ is about to undertake.
Expect some greener seasons on this pair as it moves forward.
Harvest will be generous.
Spotted at 168.0
Interim target at 171
Mid/Long term target at 200.
TRADE SAFELY always. Market is Market.
Not financial advice. TAYOR.
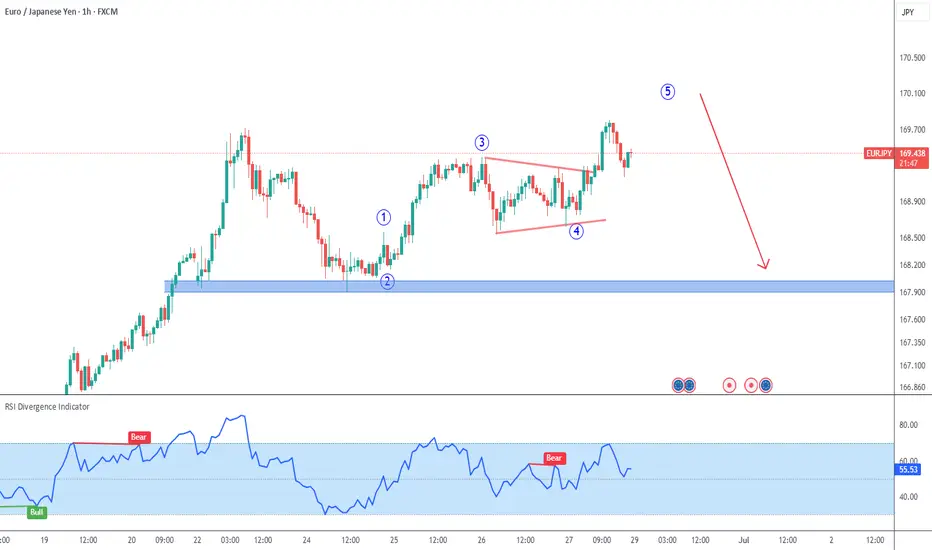
EURJPY 1H Chart
I expect at least one more liquidity-grabbing leg up for blue wave 5, before a correction begins.
First target for the correction is 168 (blue area), which is the beginning of this latest upside wave.
Note that you should trade wave expectations... wait for a reversal pattern and clear bearish price action before taking any shorts.
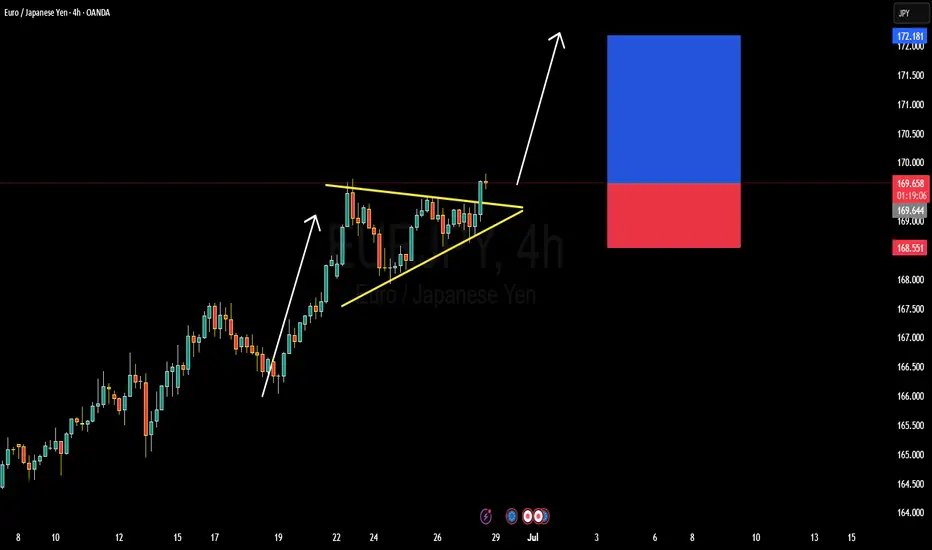
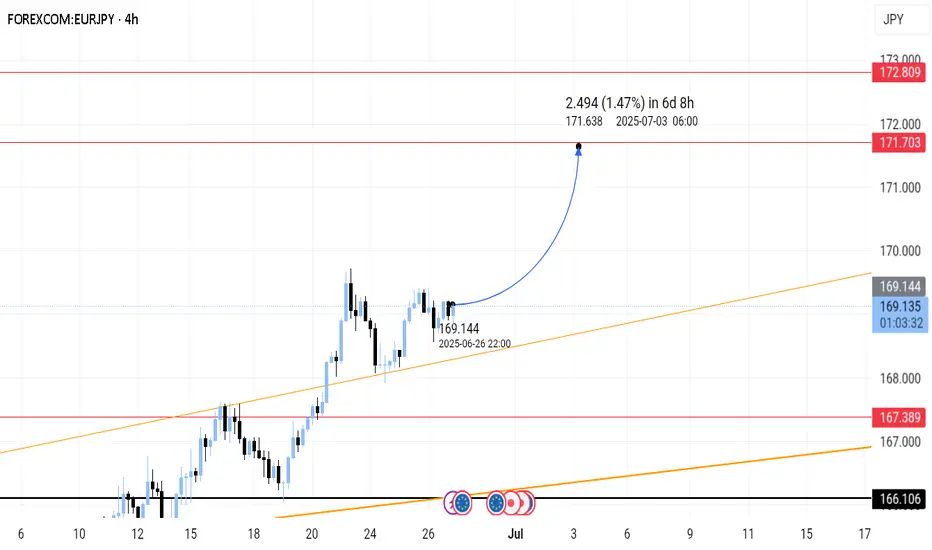
EURJPY BULLISH OR BEARISH DETAILED ANALYSISEURJPY has just broken out of a well-defined bullish pennant pattern on the 4H timeframe, confirming strong continuation potential to the upside. The price is currently hovering around 169.60 after consolidating in a tight structure, respecting both dynamic trendline support and horizontal resistance. This breakout signals renewed bullish momentum, and I'm now targeting the 172.10 zone as the next significant resistance level. The structure is clean, volume supported the breakout, and price action is aligned with the dominant uptrend.
Despite a relatively quiet start to the week—largely influenced by global risk-off sentiment surrounding Middle East tensions—EURJPY has held firm. Now that geopolitical jitters are easing slightly, yen weakness is resurfacing. The Bank of Japan remains firmly dovish, maintaining ultra-loose policy, while the Euro is supported by hawkish commentary from the ECB as inflation in the eurozone remains sticky. This divergence continues to fuel the long-term bullish bias for EURJPY.
Fundamentally, Japanese economic indicators remain soft, and there's still no clarity on when the BoJ will meaningfully shift policy. Meanwhile, EUR zone confidence indicators have stabilized, and speculation is growing around the ECB holding rates higher for longer into Q3. With widening yield differentials and a favorable risk sentiment return, this pair is positioned well for upside movement. Current momentum supports the probability of reaching the 172.00–172.10 area as risk appetite rebuilds across markets.
Technically and fundamentally aligned, EURJPY offers one of the strongest bullish continuation opportunities on the board right now. I will continue to monitor for minor dips as potential add-on areas, aiming for a full extension of the measured move from the pennant formation. Patience pays in setups like this where structure, sentiment, and macro all align.
EUR/JPY Analysis – Flag Breakout Signals Further UpsideHello Traders,
It's been a while. I trust you are good.
Kindly find below my analysis of EURJPY currency pair.
Overview:
EUR/JPY has been consolidating within a bullish flag pattern, characterized by lower highs and lower lows over the past few trading sessions. Price action has now broken above the flag’s resistance, indicating a possible continuation of the broader bullish trend.
Idea:
The breakout above the bullish flag suggests that bulls are regaining control. Price is currently hovering around 169.370, having just cleared the wedge’s resistance line.
Key levels to monitor:
1. Support Zone: Around 169.200–169.300
2. Resistance Level: 169.699
Trade setup:
Entry: On a successful breakout or break and retest of 169.200–169.300.
Stop Loss: Below 168.816 (beneath the flag's support and recent swing low).
Targets: TP1: 169.699, TP2: 170.000–170.200
Conclusion:
EUR/JPY has broken out of a bullish flag pattern, signaling momentum shift in favor of buyers. If price sustains above the breakout zone or clears 169.699 resistance, we may see an extended rally toward the 170.000 mark. Trade with caution.
Cheers and happy trading.
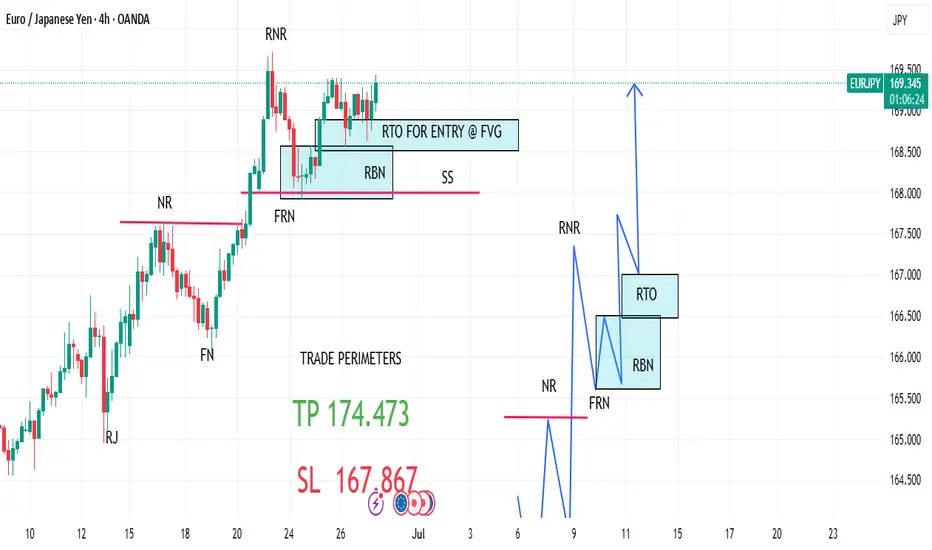
EURJPY MARKET ANALYSIS AND PRICE PREDICTIONEURJPY, has finished consolidating at the intuitional renegotiation zone. Decision has been taken in favor of the Bulls. price has retested the FVG and has given the Bulls a perfect entry now. 174.473 is the target. stop loss should be below the RBN( renegotiation block) at 167.867.
If You have a sizeable account, Hit this one hard, and hold it for a week or two. Don't Forget to send your Tithes.
GOOD LUCK GUYS!
DISCLAIMER
Manage your own Risk. Any analysis can fail due to market sentiments. Take care of your trading capital!
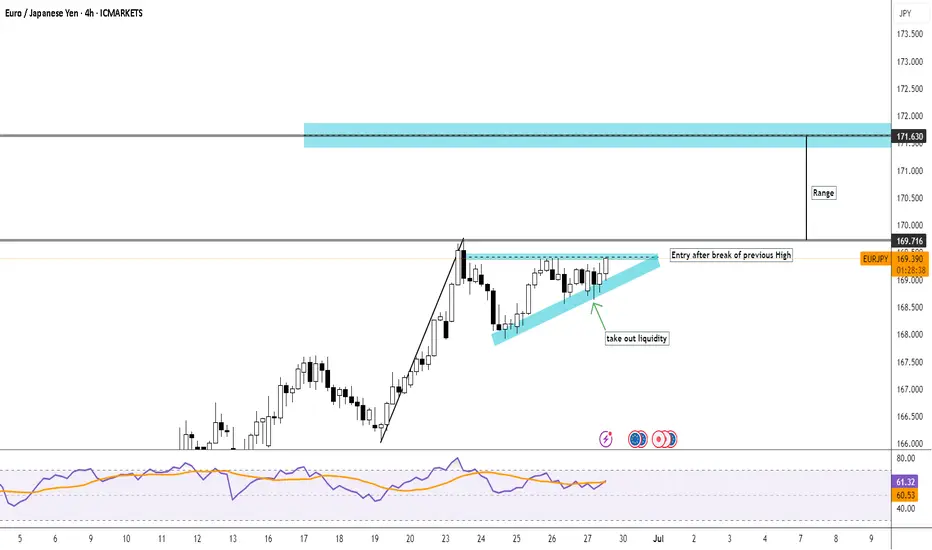
EurJpy rising Wedge Pattern on larger timeframeEur/Jpy rising Wedge Pattern on larger timeframe.
Entry after the break of previous high and the target price will be the consolidation level above it.
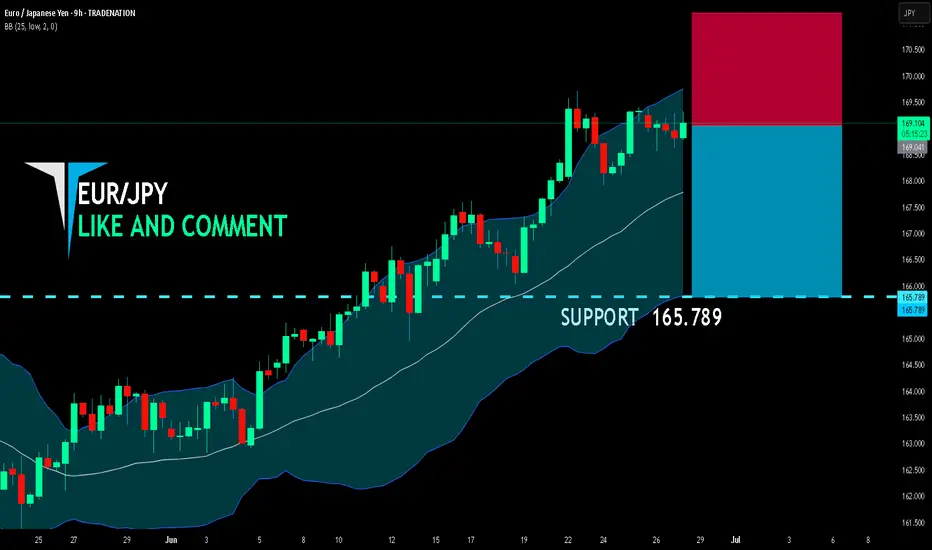
EUR/JPY BEARS WILL DOMINATE THE MARKET|SHORT
EUR/JPY SIGNAL
Trade Direction: short
Entry Level: 169.041
Target Level: 165.789
Stop Loss: 171.204
RISK PROFILE
Risk level: medium
Suggested risk: 1%
Timeframe: 9h
Disclosure: I am part of Trade Nation's Influencer program and receive a monthly fee for using their TradingView charts in my analysis.
LIKE AND COMMENT MY IDEAS
EURJPY possible ScenarioEURRJPY in upward trend currently formed a triangle a breakout may lead it to up and a breakdown of trendline to downward.
EURJPYthe Current EUR/JPY Price price action and directional bias today , EUR/JPY is trading at 169.038 consolidating within a temporary sideways range between 168.60 (support) and 169.659 (resistance). The pair is testing key technical levels amid mixed fundamental drivers.
Eurozone and Japan 10-Year Bond Yields
Eurozone 10Y Bond Yield (EU10Y) 2.561% , reflecting moderate stability despite ECB rate cuts.
Japan 10Y Bond Yield (JB10Y): 1.424% , down slightly from 1.44% from the daily high .
Central Bank Policy Rate ECB) is 2.00% (Deposit Facility) Cut by 25 bps on June 5, 2025, citing inflation at target (2%) and growth projections of 0.9% for 2025.
while BOJ 0.50% (Short-Term) was Held steady on last policy meeting by top boj leadership brass.BOJ signaled slower bond-purchase reductions in 2026 amid fiscal concerns and market volatility.
Interest Rate Differential and Carry Trade Dynamics
Rate Differential: +1.50% (ECB’s 2.00% vs. BOJ’s 0.50%), favoring EUR-funded carry trades.
Bond Yield Spread: +1.13% (EU10Y 2.56%% vs. JB10Y 1.43%), enhancing EUR/JPY’s appeal for yield-seeking investors.
Carry Trade Implications:
The positive rate differential supports bullish EUR/JPY momentum, as investors borrow low-yielding JPY to invest in higher-yielding EUR assets.
However, JPY strength has emerged recently due to BOJ hawkish expectation, Japan’s core inflation hit a >2-year high in May, fueling bets on future rate hikes.
Geopolitical easing: The Israel-Iran ceasefire reduced safe-haven JPY demand, partially offsetting carry trade pressure.
Technical Outlook for EUR/JPY
Bullish Bias: The pair awaits a breakout above 169.659 to target 170.00 bullish ascending trendline breakout
Key Risks:
Failure to breach 169.659 could trigger a correction toward 167 and below especially if BOJ maintains hawkish rhetoric's
A drop below 167.may activate bearish momentum, though the broader uptrend remains intact.
Technical Breakout: A close above 169.659 could accelerate gains toward 170.00.
Central Bank Divergence: The ECB-BOJ rate spread (+1.50%) and bond yield spread (+1.13%) underpin EUR strength, though JPY resilience from inflation/hawkish BOJ risks may cap upside.
Risk Sentiment: Further geopolitical calm could weaken JPY’s safe-haven role, amplifying carry trade inflows into EUR/JPY.
#eurjpy
