Trading the Pullback on EURJPY My Trade PlanThe EURJPY is clearly in a strong bullish trend 📈, as shown by a consistent pattern of higher highs and higher lows on the 1H timeframe ⏱️. In this video, I’m looking to capitalize on a pullback as a potential buy opportunity 🎯.
We dive into my entry strategy, explore how to align with the prevailing trend, and break down key concepts such as price action, market structure, and smart pullback zones 🧠📊.
⚠️ As always, this is for educational purposes only — not financial advice.
EURJPY trade ideas

demand zone spottedEUR/JPY – Bullish Rejection from Demand Zone | 4H Smart Money Setup
Pair: EUR/JPY
Timeframe: 4H (4-Hour)
Bias: Bullish
Status: Trade Active
Strategy: Demand Zone Rejection / Smart Money Concepts (SMC)
Market Context
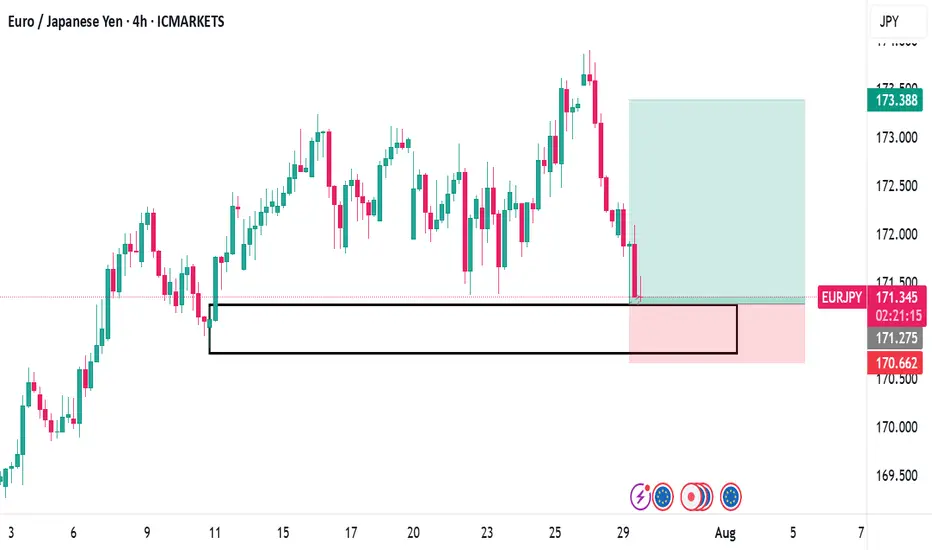
EUR/JPY has been in a broader uptrend with higher highs and higher lows throughout July. Recently, the market retraced and tapped into a clearly defined demand zone, showing bullish rejection—a potential opportunity for long entries.
Key Technical Highlights
• Demand Zone marked around 170.65 – 171.30
o Formed by previous accumulation before the last strong impulsive bullish leg.
o This zone acts as institutional support, where large buy orders may reside.
o Price wicked into the zone and printed a bullish candle, suggesting buyer interest.
• Risk-Reward Structure
o Entry: ~171.33 (current price action after bounce)
o Stop Loss: Below demand zone (~170.66)
o Take Profit: 173.38 (previous high / clean traffic zone)
• The position is marked on chart with a clear long setup:
o Green zone = Target
o Red zone = Risk
o Trade offers a favorable Risk:Reward > 2:1
Scenarios
Bullish Continuation
• Price continues upward respecting demand zone.
• Confirmation from bullish price action or break of lower highs (structure shift).
• Clean targets above at 173.00 – 173.40.
•
Bearish Invalidity
• Price closes below 170.65 on a 4H candle.
• Break of demand invalidates the setup.
• Next potential support lies lower near 169.80.
Trade Plan Summary
Component Value
Entry 171.33
Stop Loss 170.66
Take Profit 173.38
R:R Ratio ~2.5:1
Status Active, Waiting for Follow-through
Conclusion
EUR/JPY is showing a clean rejection from a strong 4H demand zone after a healthy pullback. Structure still supports a bullish continuation, and the trade is positioned with tight risk and strong upside potential. Monitoring for confirmation via momentum and market structure.
EURJPY: Short Trade Explained
EURJPY
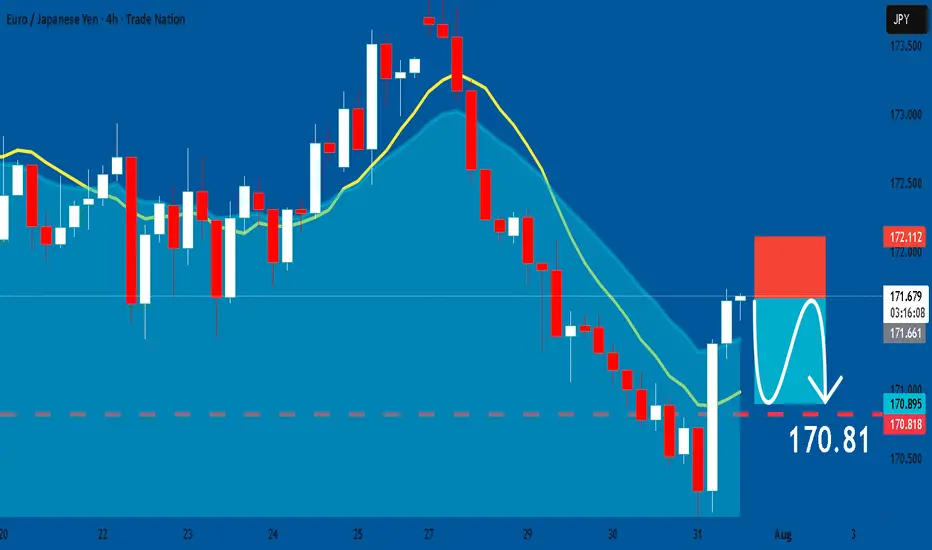
- Classic bearish formation
- Our team expects pullback
SUGGESTED TRADE:
Swing Trade
Short EURJPY
Entry - 171.66
Sl - 172.11
Tp - 170.81
Our Risk - 1%
Start protection of your profits from lower levels
Disclosure: I am part of Trade Nation's Influencer program and receive a monthly fee for using their TradingView charts in my analysis.
❤️ Please, support our work with like & comment! ❤️
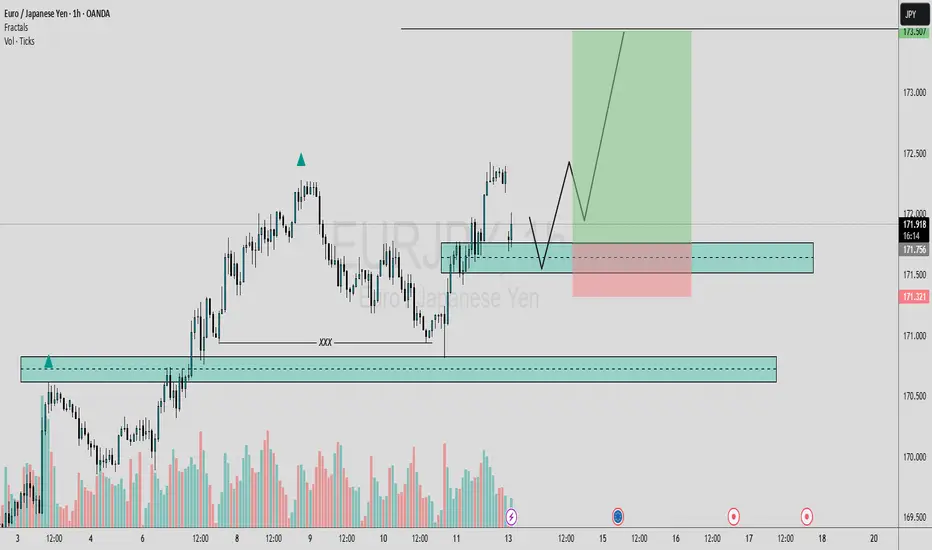
EURJPY Bullish Setup : EURJPY Forecast + Demand Zone🧠 Introduction: What's Happening on the Chart?
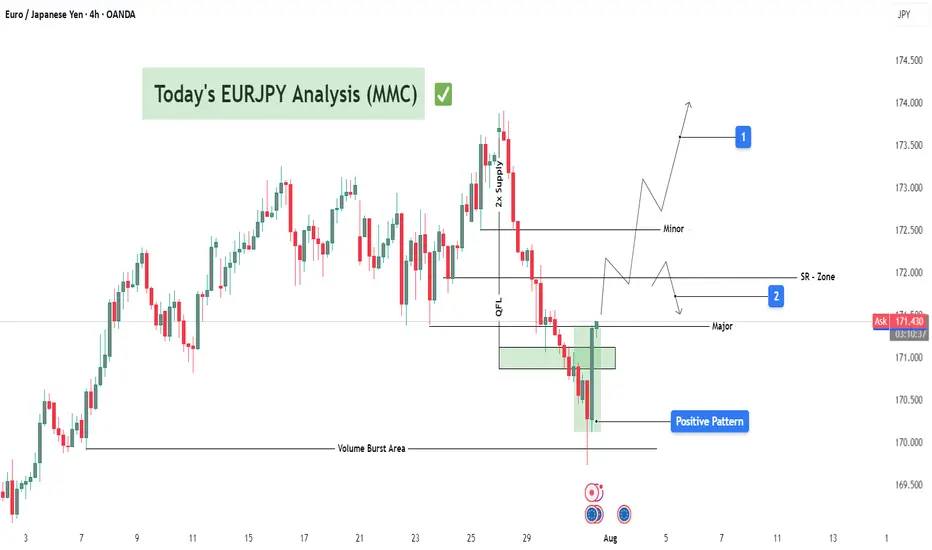
Today’s analysis on EURJPY is built on the MMC trading framework, which emphasizes the identification of institutional supply and demand zones, reaction points, QFL patterns, and volume bursts to map out high-probability trading paths.
We are currently observing a market in a corrective phase following a significant bearish drop. However, the presence of a major demand zone, along with a positive bullish pattern, suggests potential upside reversal or at least a short-term retracement.
🔍 Technical Breakdown – Zone by Zone
🔻 1. The Drop from 2x Supply Zone
EURJPY experienced a significant decline from the 173.60–174.00 area, which acted as a 2x confirmed supply zone.
Sellers took control with strong bearish candles that broke through previous minor support levels.
This drop was impulsive, showing momentum-driven selling, often linked with institutional activity.
🟩 2. Demand Reaction at Major Zone
Price entered a key demand zone marked in green (170.80–171.00), where historically buyers have stepped in.
A "Volume Burst" is visible here—large volume candles with long wicks to the downside, which typically indicate accumulation.
A positive pattern (possibly engulfing or a pin bar structure) has formed, signaling a potential bullish reversal or relief rally.
🧱 3. QFL Structure (Quantum Flat Line)
The chart highlights a QFL base, where the price consolidates after an initial drop, then continues lower before a sharp bounce.
QFL is often used to identify trap zones where retail traders are shaken out, and smart money enters.
The recent bounce from the QFL base suggests smart money might be accumulating for a reversal move.
📐 Key Levels and Zones
Type Zone/Level Role
🔵 Volume Burst Area ~170.80–171.00 Aggressive buyer entry; accumulation zone
🟢 Major Demand 170.80–171.20 Key structural low supporting bullish bias
🟠 SR Flip Zone 171.80–172.00 Crucial breakout/retest level
🔴 Minor Resistance 172.60–173.00 Short-term pullback zone
🟥 2x Supply 173.60–174.00 Strong reversal point; ideal target
🔁 Scenarios to Watch
📈 Scenario 1: Bullish Breakout and Rally (Blue Box 1)
If price breaks above 172.00, we expect:
A potential retest (bullish confirmation).
Continuation toward minor resistance at 173.00, and possibly the 2x supply zone at 174.00.
This aligns with the positive pattern formed at the base and the idea of a market rotation from bearish to bullish structure.
📉 Scenario 2: Rejection and Retest of Lows (Blue Box 2)
If the price fails to sustain above 172.00, sellers may step in:
Price could revisit the major demand zone again or even break down to 170.50.
This would invalidate the bullish setup in the short term and imply a larger continuation of the bearish trend.
🧠 Strategic Insights (MMC-Based Thinking)
The MMC approach teaches us to mirror the market’s emotion and behavior.
In this case, we see signs of:
Panic selling → smart money accumulation.
Institutional traps (QFL drop) → bullish absorption.
Traders applying MMC would anticipate reactive setups at the SR Flip Zone to determine next directional bias.
💡 Trade Ideas (For Educational Purposes Only)
Strategy Entry SL TP1 TP2
Aggressive Long 171.30–171.50 170.70 172.50 173.50
Breakout Retest Long 172.10 (after breakout) 171.50 173.00 174.00
Sell on Rejection 172.00 (bearish confirmation) 172.60 171.00 170.40
📌 Conclusion & Final Thoughts
EURJPY is showing a potential bullish reversal setup from a well-defined demand zone, supported by volume bursts and positive price action patterns. However, the SR Zone at 172.00 remains the key pivot—how the price reacts here will determine whether we see a deeper pullback or a continuation to test upper resistance levels.
Stay flexible and responsive. Let the market give confirmation before execution. As always, follow proper risk management and trade the reaction, not the prediction.
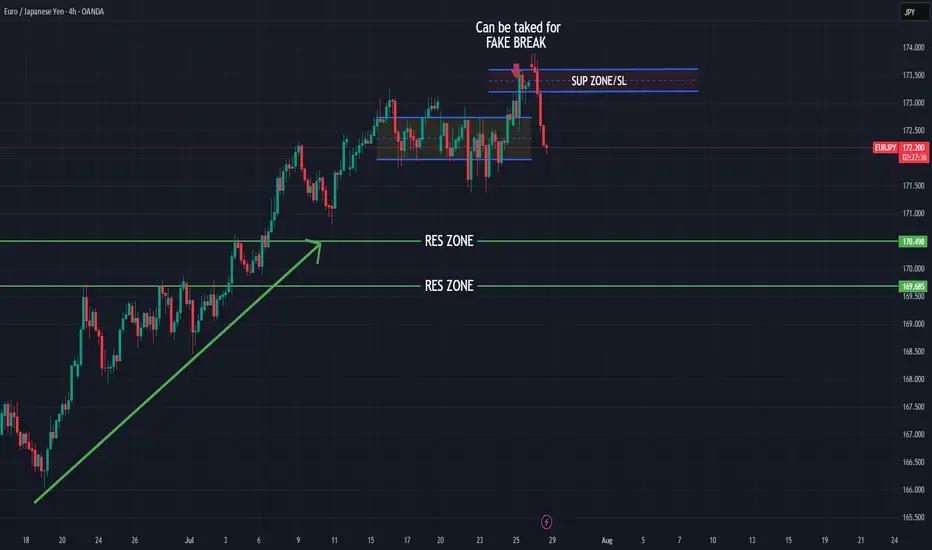
SELL EURJPY for bullish trend reversal SELL EURJPY for bullish trend reversal
STOP LOSS : 172.80
Trade trade is based on false breakout and divergence.....
First what is false breakout, A false breakout in Forex occurs when the price breaks through a key level (like support or resistance) but quickly reverses and returns to its original range, often trapping traders who were expecting a continuation of the breakout. It's essentially a false signal, indicating a potential trend reversal or continuation, but the price doesn't follow through....
Secondly what is divergence ,In forex trading, divergence occurs when the price of a currency pair moves in one direction, while a technical indicator (like an oscillator) moves in the opposite direction. This mismatch can signal a potential trend reversal or weakening trend. There are two main types: bullish and bearish divergence.
On this trade we are taking it because we saw regular bearish divergence
Regular Bearish Divergence
In case of Regular Bearish Divergence:
* The Indicator shows Lower Highs
* Actual Market Price shows Higher Highs
We can see a strong divergence on the RSI already and There is a strong trend reversal on the daily time frame chart.....
The daily time frame is showing strength of trend reversal from this level resistance so we are looking for the trend reversal and correction push from here .....
EURJPY POSSIBLE EXPECTED MOVEIn this analysis we're focusing on 1H time frame. Today I'm looking for a potential buy move from my marked key levels. This is a higher time frame analysis. Let's analyze more deeply into smaller timeframe and potential outcomes. Confirmation is very important.
Always use stoploss for your trade.
Always use proper money management and proper risk to reward ratio.
This is my analysis.
#EURJPY 1H Technical Analysis Expected Move.
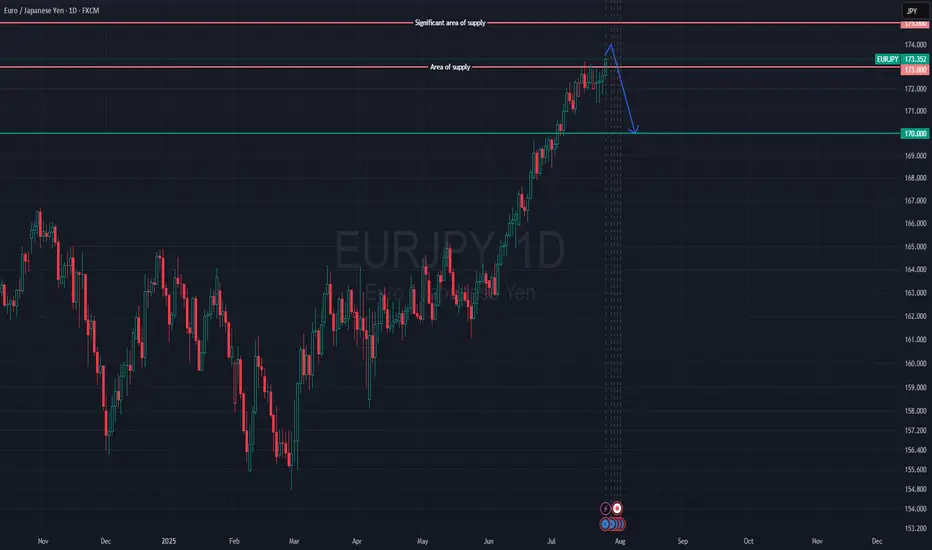
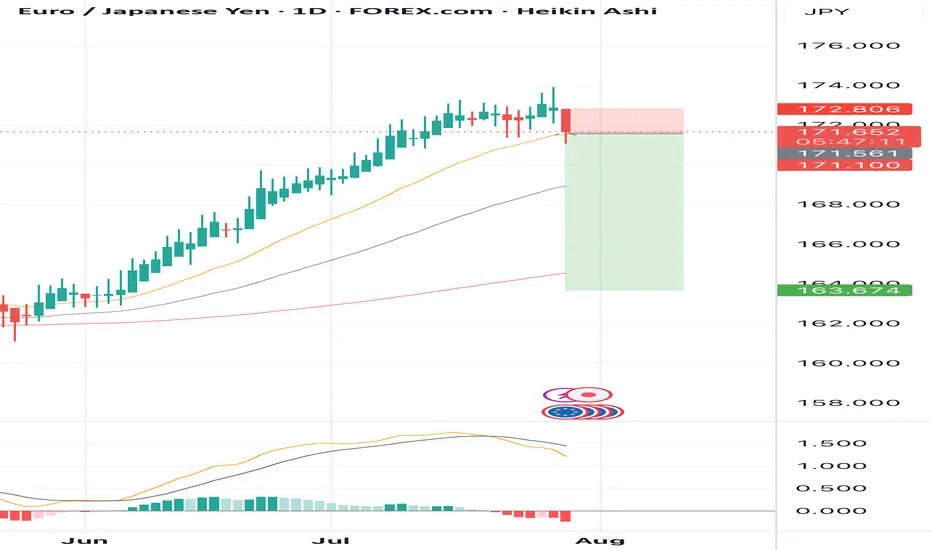
EURJPY Wave Analysis – 30 July 2025
- EURJPY reversed from the resistance zone
- Likely fall to support level 169.60
EURJPY currency pair recently reversed down from the resistance zone between the resistance level 174.00, the upper daily Bollinger Band and the resistance trendline of the daily up channel from February.
The downward reversal from this resistance zone created the daily Japanese candlesticks reversal pattern, Bearish Engulfing.
EURJPY currency pair can be expected to fall further to the next round support level 169.60 (former resistance from the end of June).

How I’m Trading the EURJPY Break of Structure Setup📈 EURJPY Analysis Update 🔍
I'm currently watching EURJPY closely. On the weekly timeframe, the pair is clearly in a strong bullish trend 🚀. Price has recently tapped into a previous daily bullish order block 🧱 — a key zone of interest.
Now, I’m watching for a break of structure (BoS) 📉 followed by a bullish continuation, especially if price pulls back into the fair value gap (FVG) 📊 near the current low.
As always, this setup — along with all key details and trade considerations — is fully broken down in the 🎥 video.
⚠️ This is for educational purposes only and not financial advice.

EURJPY point of revers?
OANDA:EURJPY constantly pushing in last periods, currently on this point expecting trend revers and short bearish push.
SUP zone: 173.200
RES zone: 170.500, 169.700
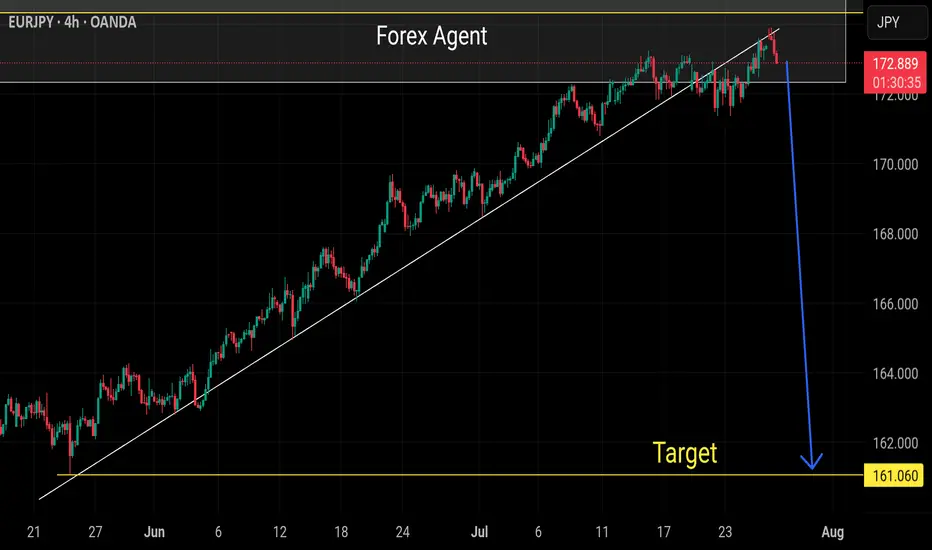
Strong sell eurjpy Big drop now eurjpy as euro gonna weak among all cross pairs
Weekly already overbought
Support trend breakout and retested on H4
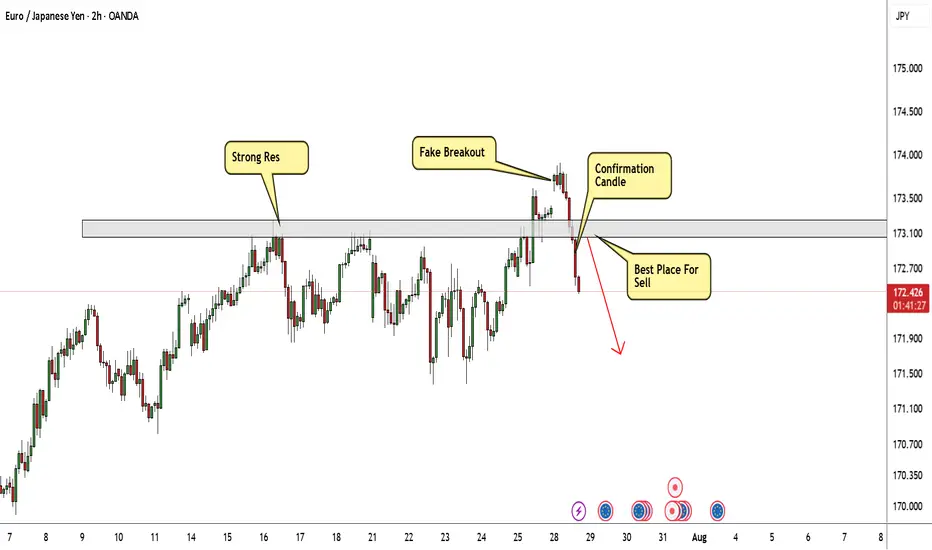
EUR/JPY Again Below My Res , Short Setup Valid To Get 150 Pips !Here is my opinion on EUR/JPY On 2H T.F , We have a fake breakout and Gap and the price back again below my res area and closed with 4H Candle below it , so i have a confirmation and i`m waiting the price to go back to retest this strong res and give me any bearish price action and then we can enter a sell trade and targeting 100 : 150 pips . if we have a daily closure above my res then this analysis will not be valid anymore .
EURJPY 4Hour TF - July 27th, 2025EURJPY 7/27/2025
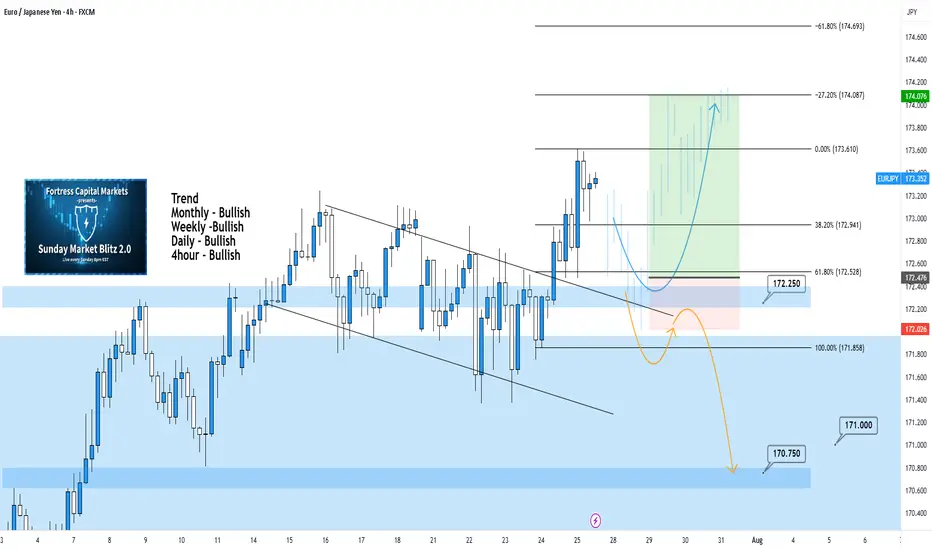
EURJPY 4hour Bullish Idea
Monthly - Bullish
Weekly - Bullish
Daily - Bullish
4hour - Bullish
All timeframes suggest we are bullish and after last week that is clear. We’re expecting a bit of a pullback but let’s get into two potential setups for the week ahead:
Bullish Continuation - If we are to continue with the bullish trend we would like to enter a trade at the next point of structure. In this scenario, the next point of structure would be a higher low as close to 172.250 support & our 61.8% fib level as possible.
Look to target higher toward our -27% fib level if this happens.
Bearish Reversal - For us to consider EJ bearish again we would need to see a strong break below our support at 172.250.
If we see bearish structure below this zone we can say price action will most likely fall lower, potentially down to 170.750.
EURJPY Bearish! Short EURJPY
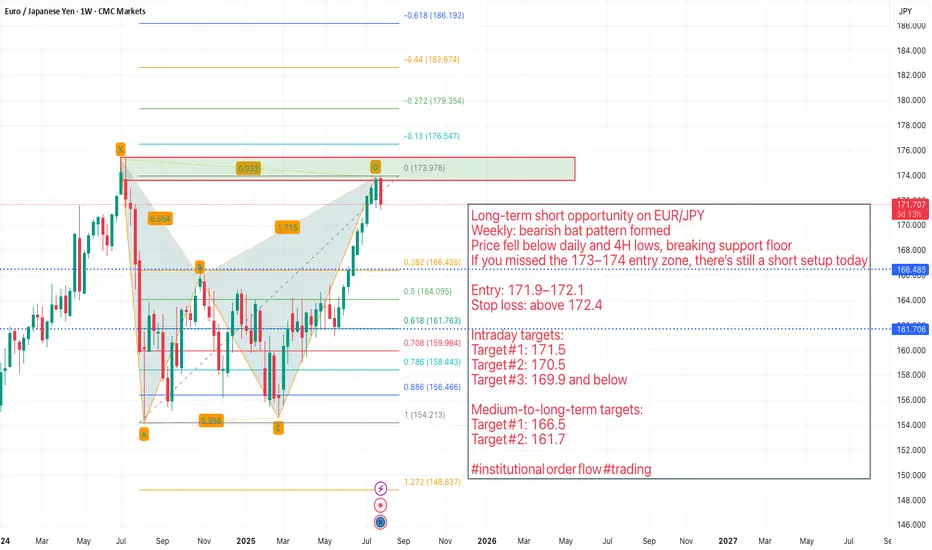
We see a verg bearish weekly BAT!
Long‑term short opportunity on EUR/JPY
Weekly: bearish bat pattern formed
Price fell below daily and 4H lows, breaking support floor
If you missed the 173–174 entry zone, there’s still a short setup today
Entry: 171.9–172.1
Stop loss: above 172.4
Intraday targets:
Target #1: 171.5
Target #2: 170.5
Target #3: 169.9 and below
Medium‑to‑long‑term targets:
Target #1: 166.5
Target #2: 161.7
#institutional order flow #trading
EURJPY – DAILY FORECAST Q3 | W31 | D29 | Y25📊 EURJPY – DAILY FORECAST
Q3 | W31 | D29 | Y25
Daily Forecast 🔍📅
Here’s a short diagnosis of the current chart setup 🧠📈
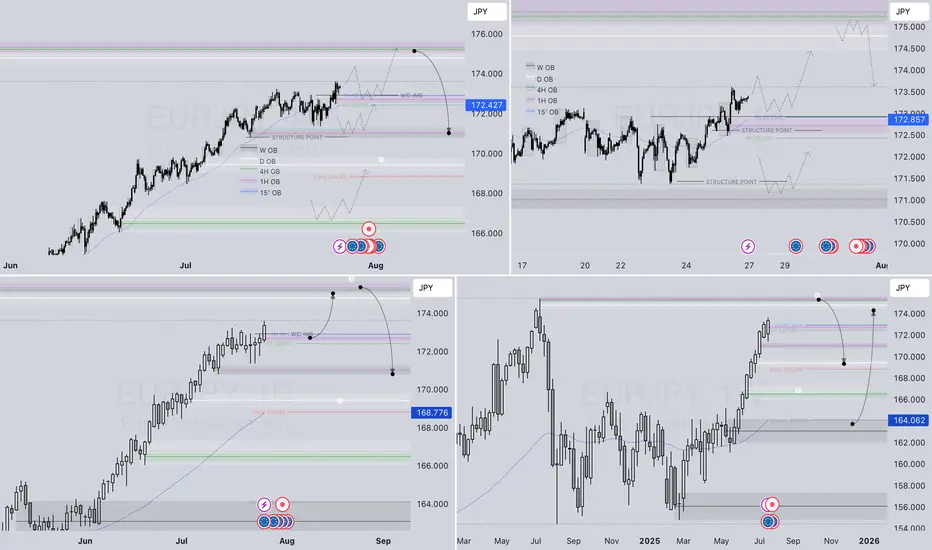
Higher time frame order blocks have been identified — these are our patient points of interest 🎯🧭.
It’s crucial to wait for a confirmed break of structure 🧱✅ before forming a directional bias.
This keeps us disciplined and aligned with what price action is truly telling us.
📈 Risk Management Protocols
🔑 Core principles:
Max 1% risk per trade
Only execute at pre-identified levels
Use alerts, not emotion
Stick to your RR plan — minimum 1:2
🧠 You’re not paid for how many trades you take, you’re paid for how well you manage risk.
🧠 Weekly FRGNT Insight
"Trade what the market gives, not what your ego wants."
Stay mechanical. Stay focused. Let the probabilities work.
OANDA:EURJPY

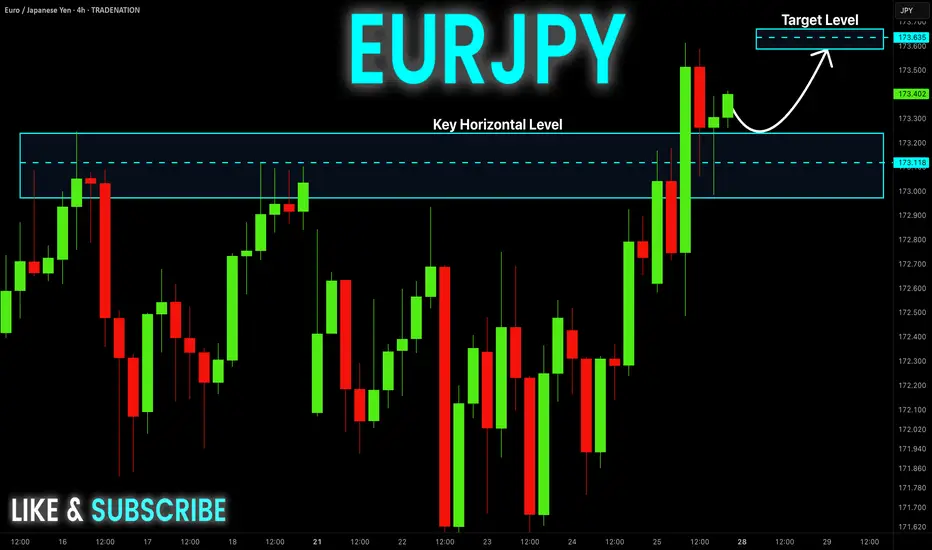
EUR-JPY Local Long! Buy!
Hello,Traders!
EUR-JPY is trading in an
Uptrend and the pair made
A breakout, a retest and
A bullish rebound from the
Horizontal support of 173.200
So we are bullish biased and
We will be expecting a
Further bullish move up
On Monday!
Buy!
Comment and subscribe to help us grow!
Check out other forecasts below too!
Disclosure: I am part of Trade Nation's Influencer program and receive a monthly fee for using their TradingView charts in my analysis.
EUR/JPY Bearish Engulf as EUR/USD Sells Off Ahead of the FedA good illustration of FX market structure is on display today. EUR/USD is down sizably after teh announcement of the EU trade deal and this may be a 'buy the rumor, sell the news' kind of event. But, there's also the possibility that this is squaring up ahead of a really big week of drivers with FOMC, Core PCE and NFP all scheduled for later this week. But, there's also the sentiment argument, where a strong bullish move has taken hold of the Euro in the first half of the year as EUR/USD has jumped to fresh three-year highs.
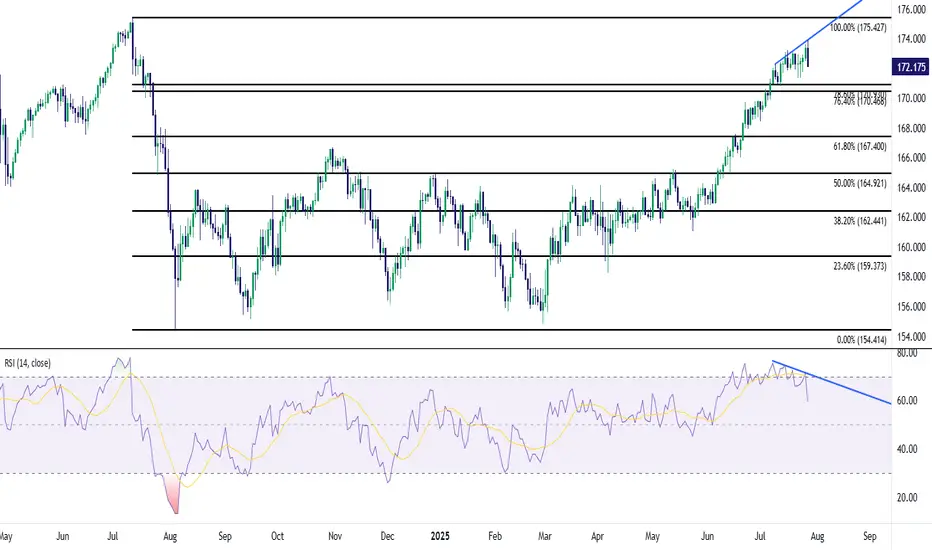
And while USD/JPY is rallying up to the 148.00 level, displaying Yen-weakness, EUR/JPY is down on the daily with a show of JPY-strength. This highlights that the move in EUR/USD is likely driving that sell-off in EUR/JPY as EUR/JPY is currently working on a bearish engulfing candlestick on the daily. And this happens after last week showed overbought RSI on both the daily and weekly charts, with daily RSI diverging from price as EUR/JPY set a fresh yearly high shortly after the open this morning.
This shows that EUR/JPY is very much in-play this week with those US drivers, and there's also the Bank of Japan rate decision to consider. In EUR/JPY, there's possible support tests coming up, around the 170.47 and 170.93 Fibonacci levels, followed by the 170.00 big figure. - js
EURJPY Sellers In Panic! BUY!
My dear friends,
Please, find my technical outlook for EURJPY below:
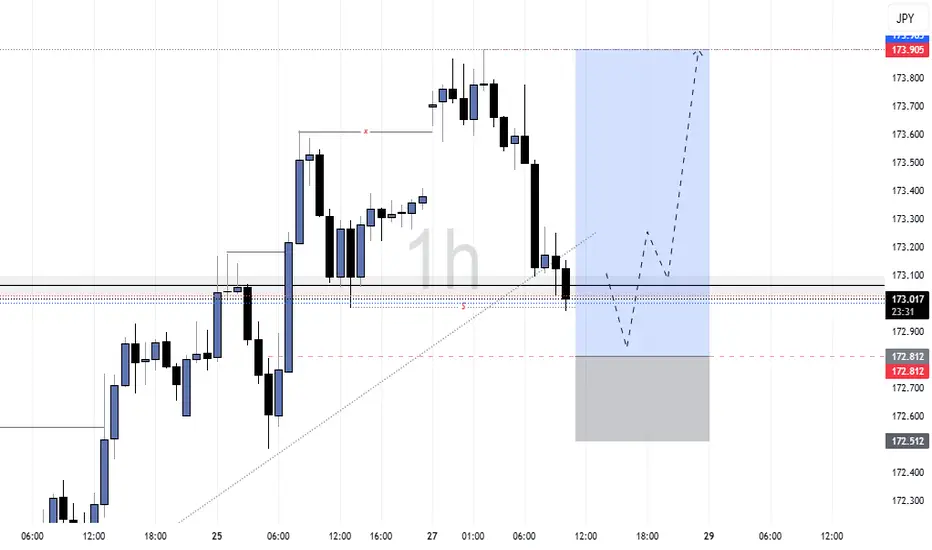
The price is coiling around a solid key level - 172.51
Bias - Bullish
Technical Indicators: Pivot Points Low anticipates a potential price reversal.
Super trend shows a clear buy, giving a perfect indicators' convergence.
Goal - 173.00
Safe Stop Loss - 172.29
About Used Indicators:
The pivot point itself is simply the average of the high, low and closing prices from the previous trading day.
Disclosure: I am part of Trade Nation's Influencer program and receive a monthly fee for using their TradingView charts in my analysis.
———————————
WISH YOU ALL LUCK

EURJPY Retest support before buys NOTE:
This pair may form liquidity trap before the buyers continue the movement to the upside
EURJPY – DAILY FORECAST Q3 | W31 | D28 | Y25📊 EURJPY – DAILY FORECAST
Q3 | W31 | D28 | Y25
Daily Forecast 🔍📅
Here’s a short diagnosis of the current chart setup 🧠📈
Higher time frame order blocks have been identified — these are our patient points of interest 🎯🧭.
It’s crucial to wait for a confirmed break of structure 🧱✅ before forming a directional bias.
This keeps us disciplined and aligned with what price action is truly telling us.
📈 Risk Management Protocols
🔑 Core principles:
Max 1% risk per trade
Only execute at pre-identified levels
Use alerts, not emotion
Stick to your RR plan — minimum 1:2
🧠 You’re not paid for how many trades you take, you’re paid for how well you manage risk.
🧠 Weekly FRGNT Insight
"Trade what the market gives, not what your ego wants."
Stay mechanical. Stay focused. Let the probabilities work.
OANDA:EURJPY

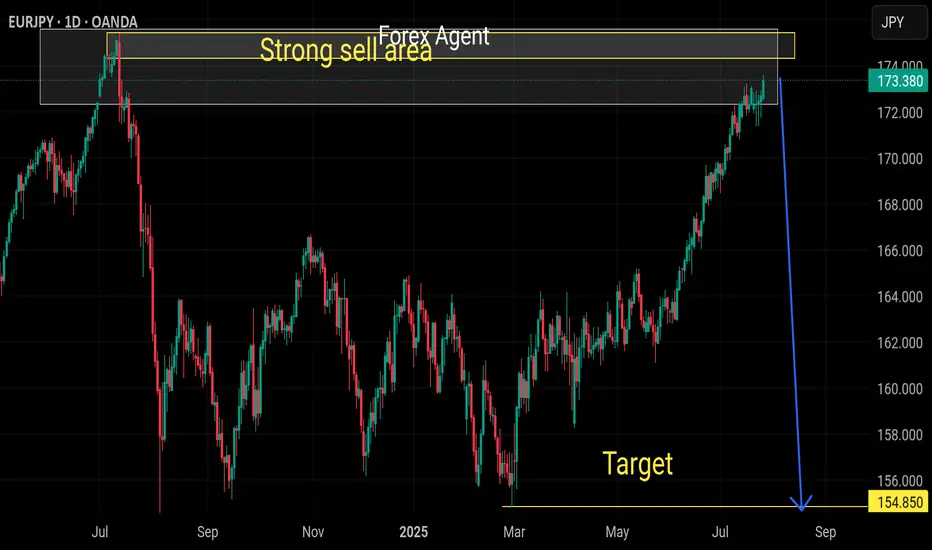
Strong sell eurjpyStrong selling wave coming in next weeks minimum 800 pips drop expected
Strong selling level reached
Strong bearish engulfing level
Weekly overbought pair
EURJPY – WEEKLY FORECAST Q3 | W31 | Y25📊 EURJPY – WEEKLY FORECAST
Q3 | W31 | Y25
Weekly Forecast 🔍📅
Here’s a short diagnosis of the current chart setup 🧠📈
Higher time frame order blocks have been identified — these are our patient points of interest 🎯🧭.
It’s crucial to wait for a confirmed break of structure 🧱✅ before forming a directional bias.
This keeps us disciplined and aligned with what price action is truly telling us.
📈 Risk Management Protocols
🔑 Core principles:
Max 1% risk per trade
Only execute at pre-identified levels
Use alerts, not emotion
Stick to your RR plan — minimum 1:2
🧠 You’re not paid for how many trades you take, you’re paid for how well you manage risk.
🧠 Weekly FRGNT Insight
"Trade what the market gives, not what your ego wants."
Stay mechanical. Stay focused. Let the probabilities work.
OANDA:EURJPY
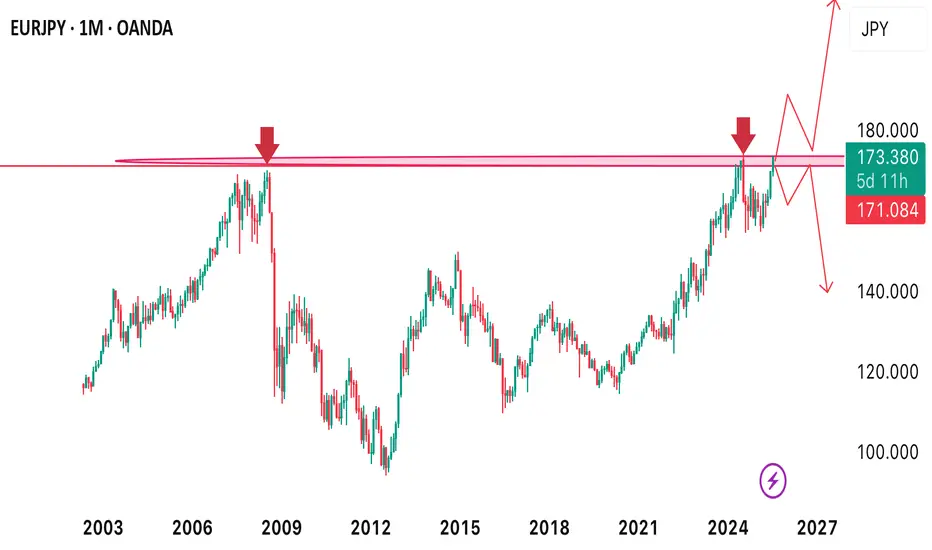
Price approaches a resistance level one more time!EURJPY recently approached a monthly resistance level. It’s a crucial level where we’re monitoring price closely to see either a breakout or the resistance level for the first time since 2008 (over 17years now) coming week as we’re going to keep a close watch from the intraday perspective to help us spot when market will either start to break above the resistance to start to decline from that high
EUR/JPY is Approaching a Key Supply Zone, Possible ShortWe initially anticipated a reversal around the 173.000 supply zone. It’s important to note that the Bank of Japan is currently facing a serious issue in the bond market — there have been several sessions with no bids for Japanese government debt. This is a troubling development and likely means the central bank will step in to purchase bonds soon.
That said, price closed above the 173.000 level on Friday, signaling further bullish momentum. The next key area of interest is the 175.000 level — a significant supply zone we are monitoring closely. If price reacts and pulls back from this level, we’ll be analyzing the yen across other major pairs, as well as keeping a close eye on the euro.