EURJPY trade ideas

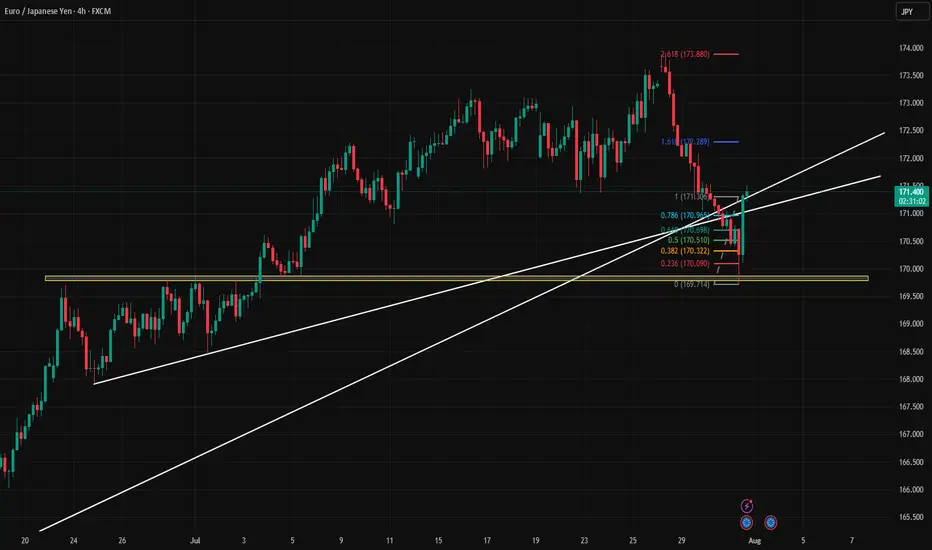
Long EJEJ showed false break the trendline with nice rejection, fulfills my criteria to go long with fibo. Anticipate with TP at fibo 261.8
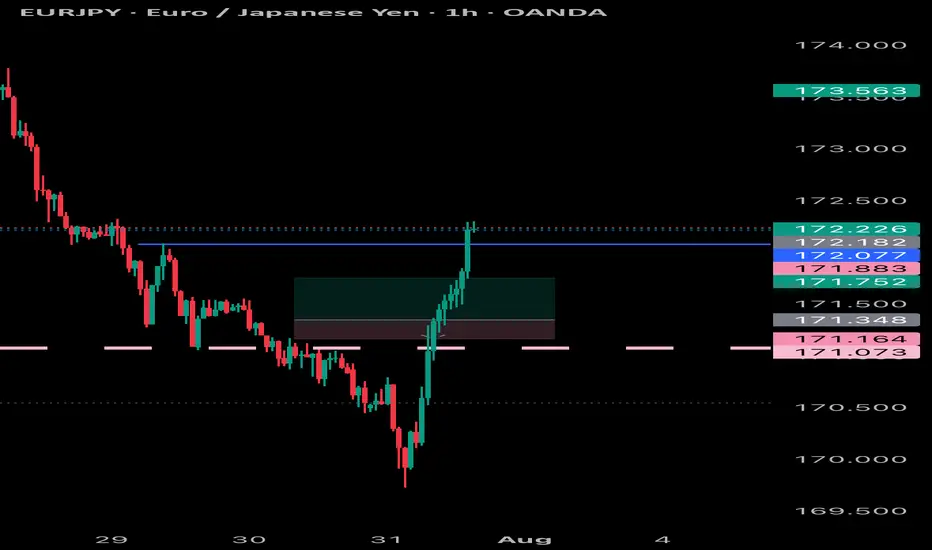
Possible Short Position Levels for EURJPYThe trade plan is as follows:
Action: Entering a short position, betting on the price to fall.
Entry: 171.886, anticipating a pullback to a previously broken support level.
Stop Loss: Placed at 172.406 to limit losses if the price unexpectedly rises and breaks the recent high.
Targets: Two take-profit levels are identified to secure profits as the price declines.
TP1: 170.780 (a recent support level).
TP2: 169.720 (a major previous low).
The setup is considered favorable because the potential profit is significantly larger than the potential risk.
Disclaimer
This analysis is for educational and informational purposes only and does not constitute financial advice. The provided trade idea is based on technical analysis and historical price action, and past performance is not indicative of future results. Trading foreign exchange on margin carries a high level of risk and may not be suitable for all investors. Before deciding to trade, you should carefully consider your investment objectives, level of experience, and risk appetite. You could lose some or all of your initial investment. Seek advice from an independent financial advisor if you have any doubts. Any action you take upon the information on this chart and analysis is strictly at your own risk.

EURJPY LONG After seeing price reject 170.000 monthly area of institutional support we saw a sharp push to the upside on the weekly timeframe from last week and we could see the market push to the upside not that the 4hr broke area of structure resistance

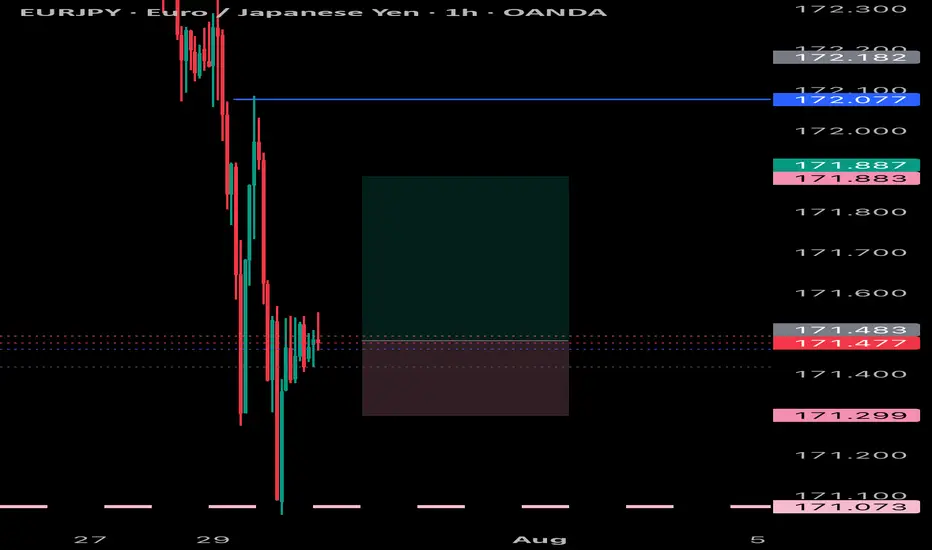
ENTRY EURJPYDisclaimer:
This is merely a chart-based analytical trading idea and is not considered investment advice. Please manage your risks carefully and conduct your own research before making any trading decisions.
ENTRY EURJPYDisclaimer:
This is merely a chart-based analytical trading idea and is not considered investment advice. Please manage your risks carefully and conduct your own research before making any trading decisions.
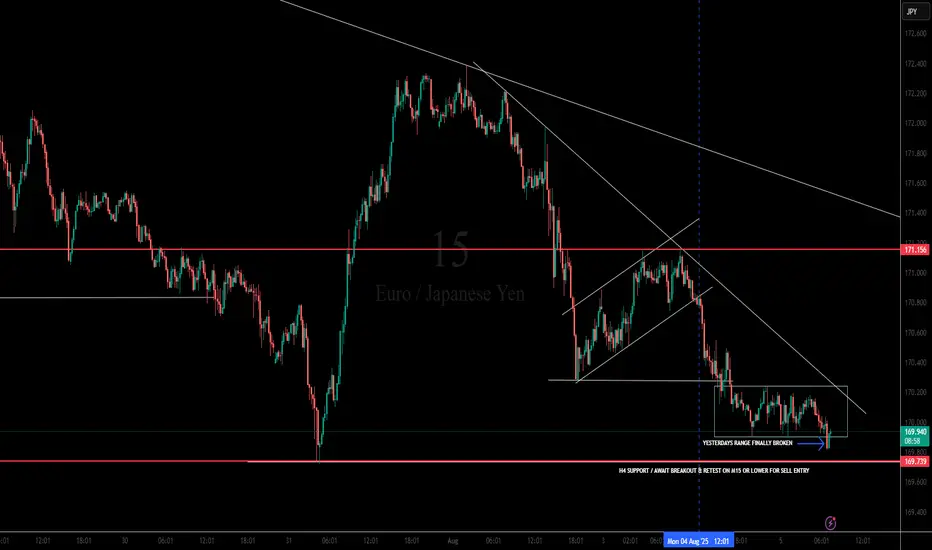
Multi-Timeframe Breakdown: LOOK @ PREVIOUS PUBLISHED IDEA FOR H4📌 M15 Chart 'SELL ENTRY PENDING'
Key Notes on Chart:
"Yesterday’s range finally broken" – confirmed.
Consolidation zone (range) broken to the downside, showing momentum shift.
Support Break: Price has broken through intra-day support of the range and retested the underside.
Break of Structure (BOS) on LTF (lower timeframe) is evident.
Bearish Flag/Channel broken down.
SMC Bias: Likely engineered a false sense of support before breaking down (liquidity grab from range buyers).
🎯 Trade Setup: Sell Opportunity (Continuation Setup)
🔻 ENTRY:
After confirmed break of the M15 range and H4 support (~169.74), look to enter on a retest rejection (LTF bearish candle confirmation on M15 or M5).
Conservative Entry: On breakdown retest @ 169.70 – 169.80
Aggressive Entry: Current price action continuation breakdown from 169.74
⚠️ What to Watch
If price reclaims and closes strongly above 170.20, invalidate bearish bias.
Any bullish engulfing or LTF shift in structure near current support warrants caution.
Watch for fakeout traps — ensure retest confirmation before entry.
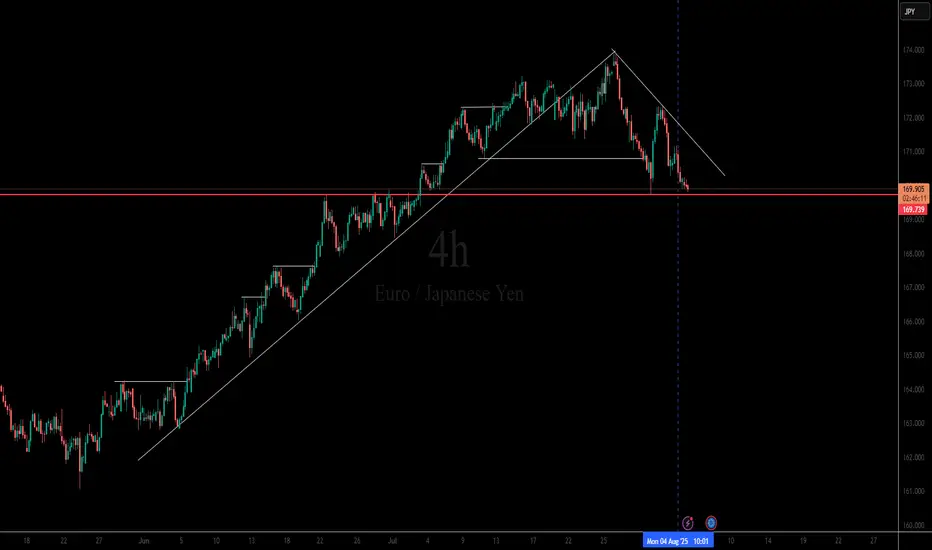
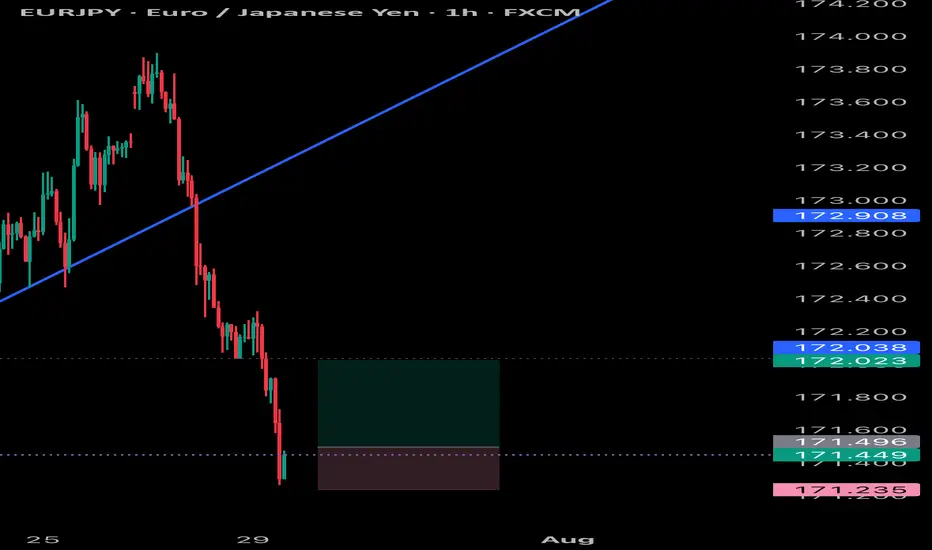
Multi-Timeframe Breakdown: LOOK AT NEXT PUBLISHED IDEA FOR M15 📌 H4 Chart SELL ENTRY LOADING....
Market Structure: Clean uptrend that broke structure to the downside.
Trendline Break: The bullish trendline has been broken and respected as resistance, showing bearish strength.
Support Level: Price is sitting right on a strong horizontal support (~169.74) — tested multiple times in the past.
Bearish Channel Forming: Price is forming lower highs and lower lows, suggesting a bearish trend continuation.
Liquidity Context:
There was likely sell-side liquidity below that horizontal support, which price might aim to sweep.
Buyers defending this area aggressively before; if they fail again, a breakout could accelerate.
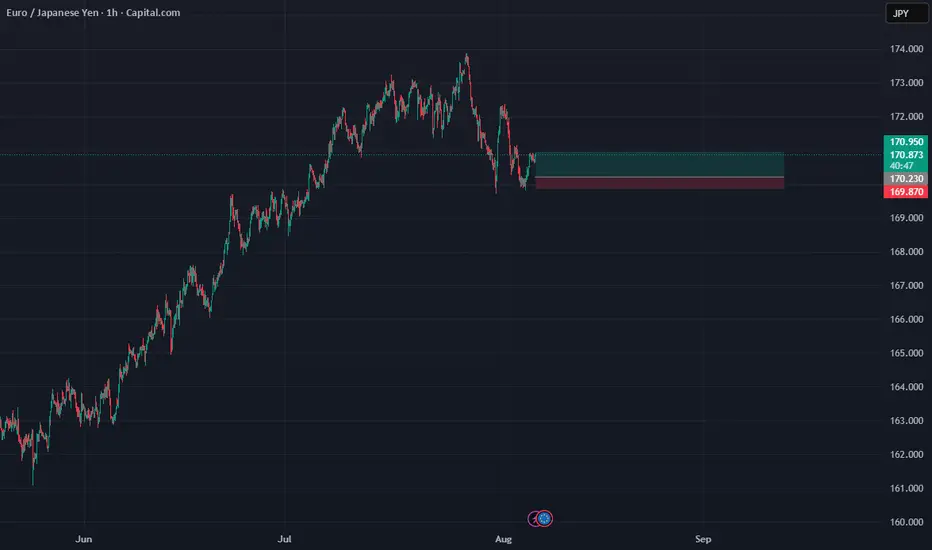
EURJPY ANALYSISAfter seeing the previous weekly candle close bearish and the daily from Monday close below the low of the last bearish candle which is a sign of sellers strength, we could expect further sells to continue but a simple retracement on the 4hr back to an area of interest for a potential LH structure point before further sells

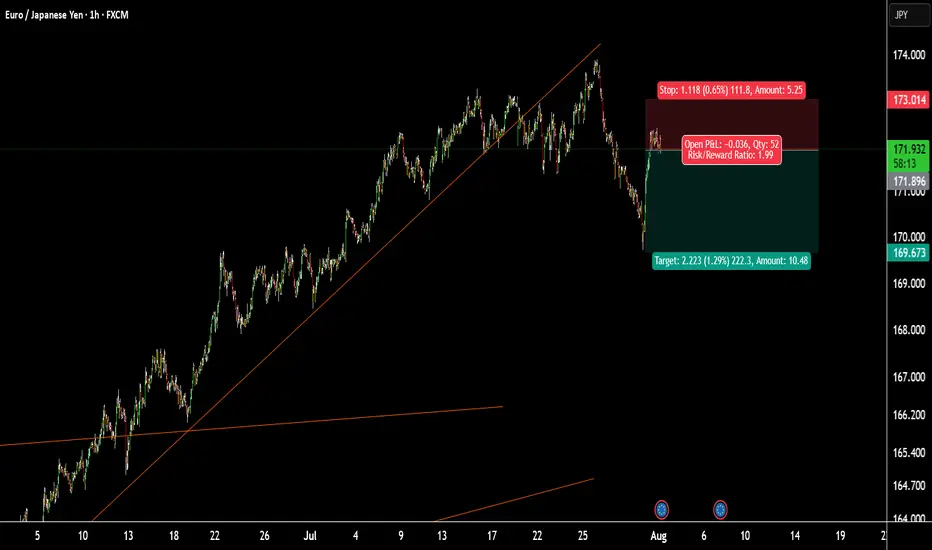
EURJPY about to enter into a DowntrendRecently EURJPY reached high points in the chart at 173.016
From there it fell and continued downwards.
I took a quick demo trade with an inverse risk to reward. Not the ideal thing to do, but I didn't want to keep my TP higher than 173.016 since we know it's a strong resistance level.
Got a quick win there.
Now, on the 4H, we can see that one huge red candle look out the previous five green candles.
It indicates that selling pressure is incoming.
This would be a good time to sell now. But I do want to see price go below 171.540 just to get that extra confirmation. Just in case, price decides to consolidate or go high for a while.
Have to stay vigilant with this market now.
TP1 will be 171.100.
TP2 will be 170.000
TP3 will be 168.800
Lets see how this trade plays out.

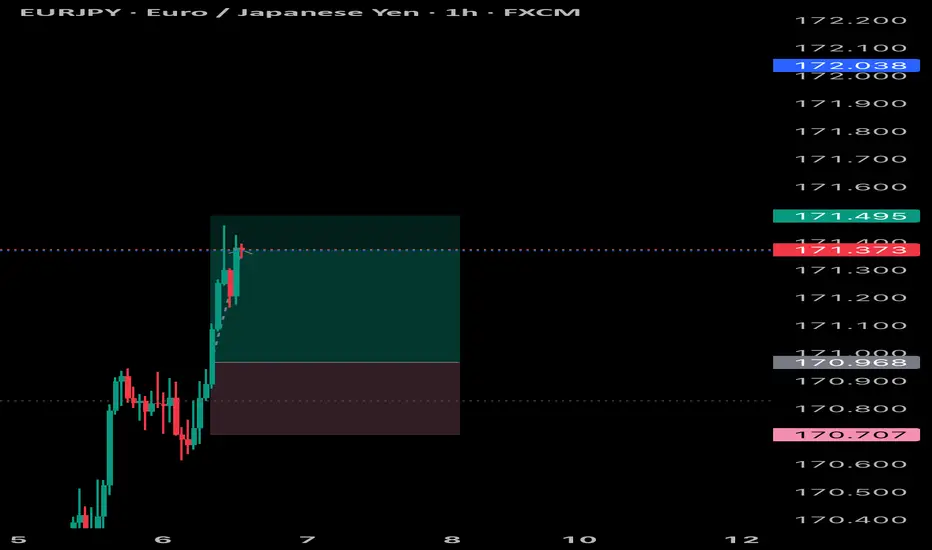
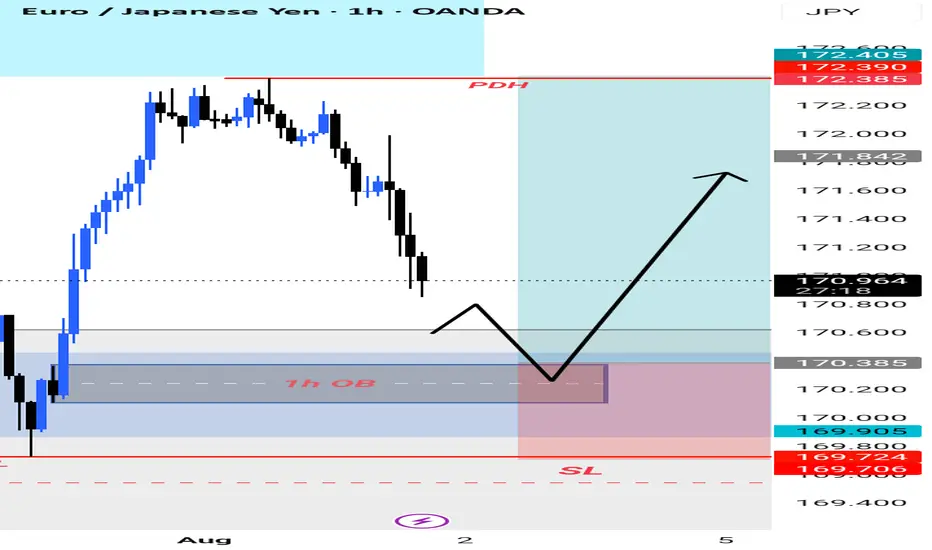
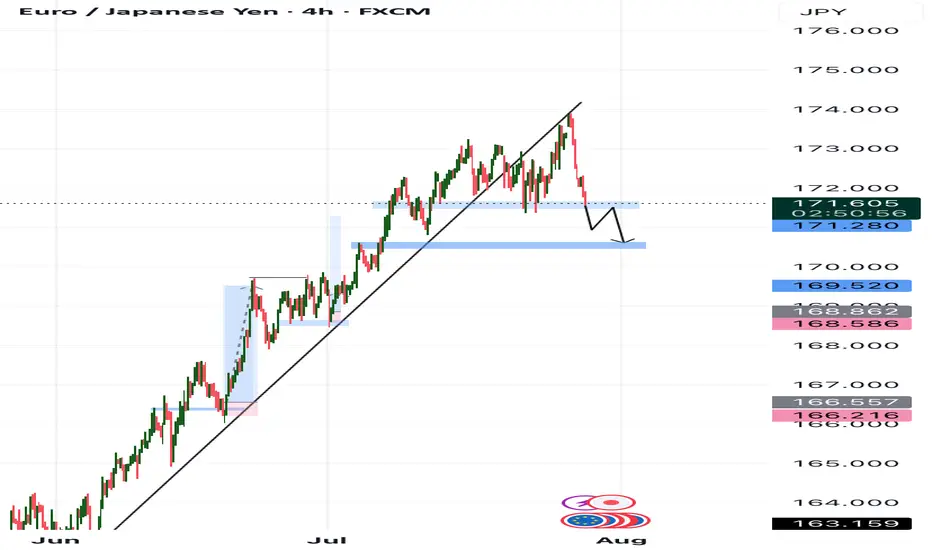
EURJPY Next Trade PlanThis Is not Advice. This is my view for next trade for a Swing, Maybe Market Goes Up With 1H OB. And Next Target Is Today High. It's My Analysis Maybe I,m wrong Because Market Is not 100% predictable.
EURJPY SELLas the main trend line is brake and the lower low is accepted. I think it moves down and good for sell
EURJPY
EURJPY SWEET BLUESEurjpy has hit all take profits with very little drawdown and huge profits very quickly nice pattern, simply followed
EURJPY 300+ PIP DROPFrom the beginning of the week i have called out shorts on EJ into 170.000 in the video we can see price hit that support and hitting target for a few positions and entry i called out during the week and also some key points for your personal trading

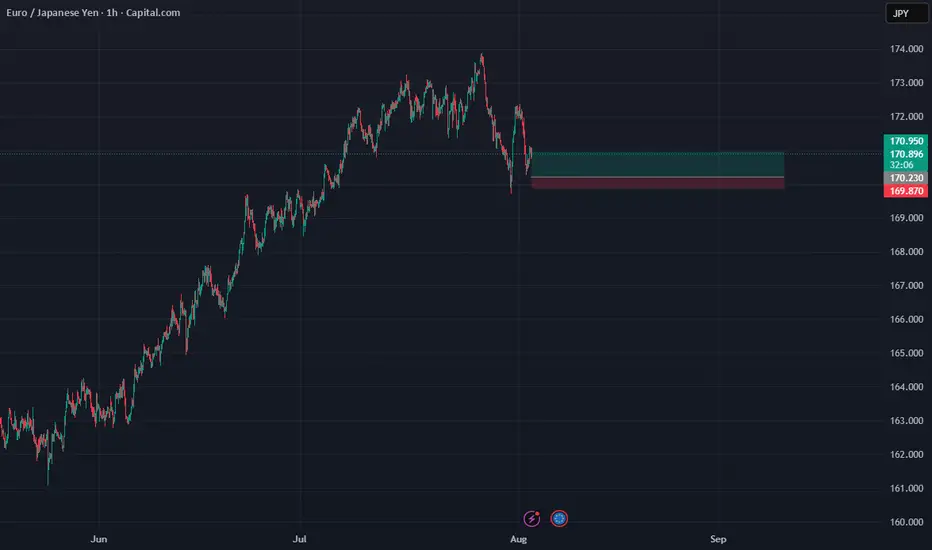
EURJPY ANALYSISAfter seeing the daily still pushing to the downside and breaking below key support of 171.250 we could be looking out for a retest and continuation to the down side target of 170.000

EUROYENEurjpy has shorter pullbacks within an ascending structure ,shall keep following it and expect it to reach a fair mount of highs or levels
EURJPY SCALP Eurjpy quick scalp trade as it can still drop so it would be wise to not target higher than normal take profits , but will scalp it
EURJPY ANALYSISAfter seeing the previous daily candle close as an engulfing and trading below the moving average we could be looking for further sell off but with the fundamentals coming out for the day we could see slowed movement till the news comes out

EURJPY Eyes New Highs After Pullback?What I see!
EURJPY Technical Outlook –
EURJPY remains in a strong uptrend and recently tapped into buy-side liquidity at 173.89, which now marks the All-Time High (ATH). After a brief rejection from that level, price is currently showing signs of a healthy pullback.
I’m observing the 170.00–171.00 zone, which aligns with previous demand. If price continues to respect this area, the overall bullish structure remains intact, with potential for a move back toward (and possibly beyond) the ATH.
A sustained break below 170.00 could indicate room for a deeper pullback, potentially toward the 168.00s, which would be a key area to monitor.
This analysis is shared for educational and discussion purposes only.
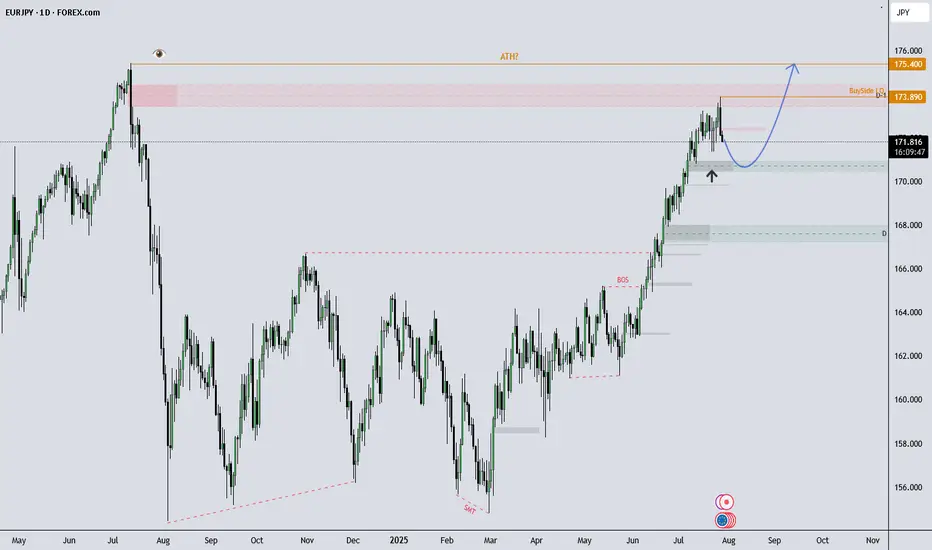
EURJPY ANALYSIS After seeing the weekly close bullish we could expect the pair to continue the bullish leg this new week with the daily and 4hr trading in the same direction. An upside target of 175.000 could be the profit taking areas for the next leg to the upside

EURJPYBank of Japan (BOJ) — July 28, 2025: Latest Overview
Policy Rate and Recent Moves
Short-term policy rate: Remains at 0.5%, the highest since 2008.
Decision timing: This rate was set in January 2025 (up from 0.25%) and has been maintained
Policy Outlook and Economic Backdrop
Inflation: Tokyo's core CPI is running above the BOJ’s 2% target (2.9% YoY in July), primarily due to external price pressures like energy and currency movements, not strong domestic demand.
Growth trends: The BOJ has trimmed its growth outlook, noting headwinds from higher U.S. tariffs and yen weakness, but still expects a moderate recovery if global trade remains stable.
Bond Purchases: The BOJ is scaling back its massive holdings of Japanese government bonds—targeting a 400 billion yen quarterly reduction through March 2026, then lowering to 200 billion yen in subsequent quarters.
Potential rate path: Market consensus and BOJ commentary indicate a possible hike to at least 0.75% by year-end 2025 if above-target inflation persists and downside global risks do not intensify.
Key Drivers and Central Bank Signals
U.S.-Japan trade: The new trade pact has reduced some uncertainties, supporting the possibility of policy tightening if inflation and yen trends remain stable.
Inflation’s nature: The BOJ stresses that any additional rate hikes will depend on seeing sustained, demand-driven price increases and wages, rather than just external cost pressures.
Governor Ueda’s message: The BOJ is maintaining a cautious, data-dependent approach, prioritizing stability and careful evaluation of global and domestic risk factors.
Quick Fact Table
Indicator Latest (July 2025) BOJ’s Signal
Policy Rate 0.5% Steady for now; another hike possible in 2025
Tokyo Core CPI (YoY) 2.9% Sustainable above-target inflation
Next Meeting July 30–31 Hawkish bias; likely no immediate change
Bonds (JGB reduction) -400B yen/Q Gradual unwinding through March 2026
Rate Outlook Stable, with upside Hike to 0.75% possible by year-end if justified
Summary:
The BOJ remains in a cautious, data-driven policy stance at 0.5% as of late July 2025, with inflation still above target and moderate growth. The central bank is slowly reducing bond purchases and may raise rates again by year-end if the current economic trends persist, but no change is expected at the imminent July meeting.
European Central Bank (ECB) — July 2025: Latest Policy and Economic Update
Key Interest Rates and Current Stance
Deposit Facility Rate: 2.00%
Main Refinancing Operations (MRO) Rate: 2.15%
Marginal Lending Facility Rate: 2.40%
These rates were set after a 25 basis point cut in early June 2025 and have now been held steady as of the ECB’s July 24, 2025 meeting.
Monetary Policy Context
Policy Pause: The ECB ended a year-long easing cycle which saw rates cut from 4% to 2%. The current pause reflects the ECB’s “wait-and-see” approach as inflation has now stabilized at its 2% target and global trade tensions—especially over U.S. tariffs—add significant uncertainty.
No Commitments: The Governing Council is explicitly not pre-committing to any future rate path, emphasizing a data-dependent, meeting-by-meeting stance.
Asset Purchases: The ECB’s asset purchase programme (APP) and the pandemic emergency purchase programme (PEPP) portfolios are being reduced gradually, with no reinvestment of maturing securities.
Inflation and Economic Outlook
Inflation: Now at 2% (its target). The ECB expects it to remain near target for the period ahead. Wage growth continues but is slowing, and underlying price pressures are easing.
Ecoomic Growth: The eurozone economy grew more strongly than expected in early 2025, but trade uncertainty and a stronger euro are holding back business investment and exports. Higher government spending, especially on defense and infrastructure, is expected to support growth over the medium term.
Loans and Credit: Borrowing costs are at their lowest since late 2022. Households are benefiting from strong labor markets and growing wages, but banks are cautious in their lending due to uncertainty and global trade tensions.
Risks and Forward Guidance
The ECB is focused on safeguarding price stability amid exceptional uncertainty due to global trade disputes and policy risks.
There is no forward guidance for the next rate change. Markets are pricing only one possible additional cut for 2025, and a potential return to tightening in late 2026 if inflation stays below target.
Summary Table: ECB at a Glance (July 2025)
Policy Rate 2.15%
Deposit Rate 2.00%
Marginal Lending 2.40%
Inflation (Jun 25) 2% (target achieved)
GDP Growth (2025) 0.9% (projected)
Policy bias Cautious, data-dependent pause
The ECB’s current stance is one of caution, monitoring the effects of prior easing and global trade risks while inflation stabilizes at target. No further near-term cuts are planned unless significant data surprises emerge. The approach is flexible, with decisions made meeting-by-meeting in response to evolving economic and financial conditions.
