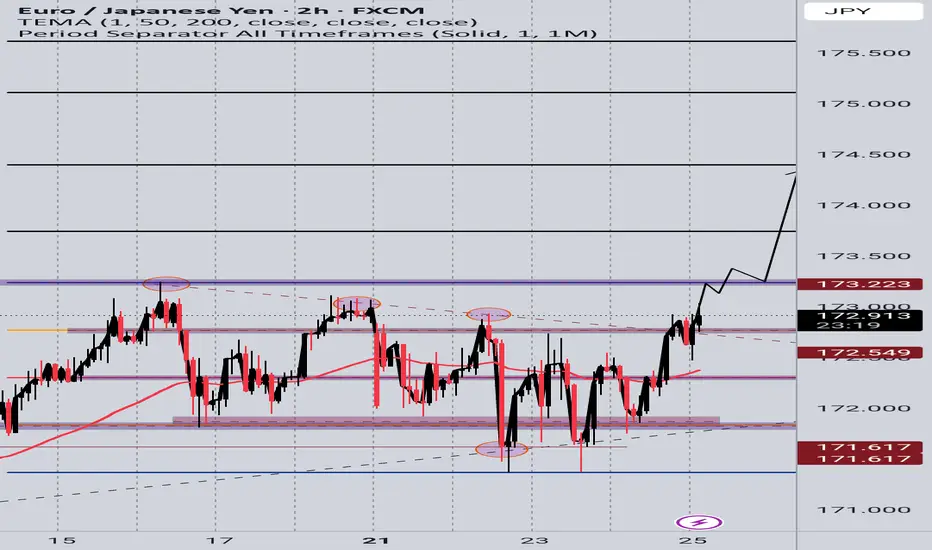
Eur/jpy Bulls to dominate @174.440 Handle As we begin a new week, I see the bulls coming in and grabbing the unmitigated liquidity @174.440 handle. My advice to fellow traders is that if the ECB stays hawkish or the BOJ remains dovish, EUR/JPY has room to stretch higher.
Watch Euro inflation numbers, BOJ yield curve control updates, and U.S. data spillovers.
Buy @ 173.15
TP 1.~174.440
EURJPY trade ideas

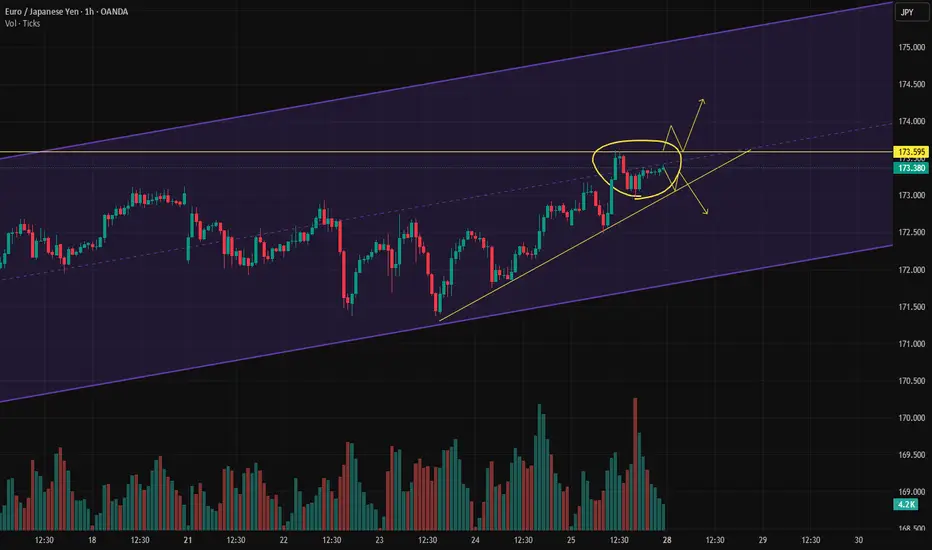
4-hour channel midlineThe price has reached the midline of the 4-hour channel, and buying volume has decreased in this area.
We need to see whether the price can break above the midline or not.
If it breaks to the upside, our first target will be the top of the channel.
If it gets rejected, our target will be the bottom of the channel.
EURJPY Bullish Breakout with IFC Confirmation | MMC Retest Play🔍 Market Structure & Price Behavior Explanation
🔹 1. Channel Structure and Bearish Trap:
The pair was previously trading within a downward sloping channel, forming lower highs and lower lows. This structure was respected for several sessions, creating a bearish bias for most retail traders.
However, as per Mirror Market Concepts, such channels often act as liquidity traps — designed to build sell-side liquidity before a strong reversal.
🔹 2. IFC Candle Break — Smart Money Confirmation:
A powerful bullish impulse candle (IFC - Institutional-Filled Candle) broke through all previous swing highs formed inside the channel. This is a critical sign that institutional buyers have stepped in and the bearish trend is likely over.
This candle is not just a breakout but also a signature of smart money transitioning the market structure from bearish to bullish. The breakout occurred with high momentum and volume, piercing through the upper channel boundary, invalidating the bearish trend.
📘 Key Note: IFC candles usually represent imbalance, strong directional intent, and are often followed by continuation after retest.
🔹 3. Retesting Phase – Key to Confirmation:
After the breakout, price retested the broken structure, which is now acting as a new demand zone. The retest is clean, holding firmly above minor support — giving confirmation of bullish control.
This zone is also aligned with a QFL (base structure) concept, where price returns to the base before a new leg of the trend begins.
🔹 4. Current Price Action: Building for Next Leg
Price is now consolidating just below the next key reversal zone (marked in green). This zone represents potential supply or resistance.
There are two likely outcomes here:
Rejection at the reversal zone, with a potential pullback before continuation.
Clean break above, followed by "Demand Doubling", where price re-tests this level again, confirming further upside momentum.
In case the second scenario plays out (as marked on the chart), EURJPY could aggressively rally toward 174.400 and beyond.
🔹 5. Demand Zones & Key Levels:
✅ Minor Demand Zone (~173.00):
Currently respected — origin of last bullish move.
✅ Major Demand Zone (~171.200):
Acts as macro support in case of deep retracement.
✅ Reversal Zone (~173.800 – 174.200):
Price may slow down, reject, or consolidate here. Smart money usually decides at this level.
📈 MMC Trading Plan (Mirror Market Concept Approach):
Buy Bias is active as long as price remains above the minor demand zone.
Any rejection from reversal zone with wick traps followed by bullish engulfing setups = potential long entries.
Break & hold above 174.200 will likely trigger momentum-based entries, targeting extended bullish continuation.
💹 Trade Setup Parameters:
📥 Entry #1: After successful retest and bullish confirmation at demand
🛑 Stop Loss: Below retest structure (~172.850)
🎯 Take Profit 1: 173.950 (within reversal zone)
🎯 Take Profit 2: 174.350+ (post-demand doubling continuation)
🧠 Trader’s Mindset – What to Expect Next:
The chart is a classic example of MMC in real-time, where:
Price traps sellers inside a fake bearish channel
Breaks structure using high-volume impulsive moves
Retests demand zone cleanly
Builds up toward the next decision-making zone
Patience is key here. Let price either break and confirm above the reversal zone or give us another deep retest for the best R:R long setup.

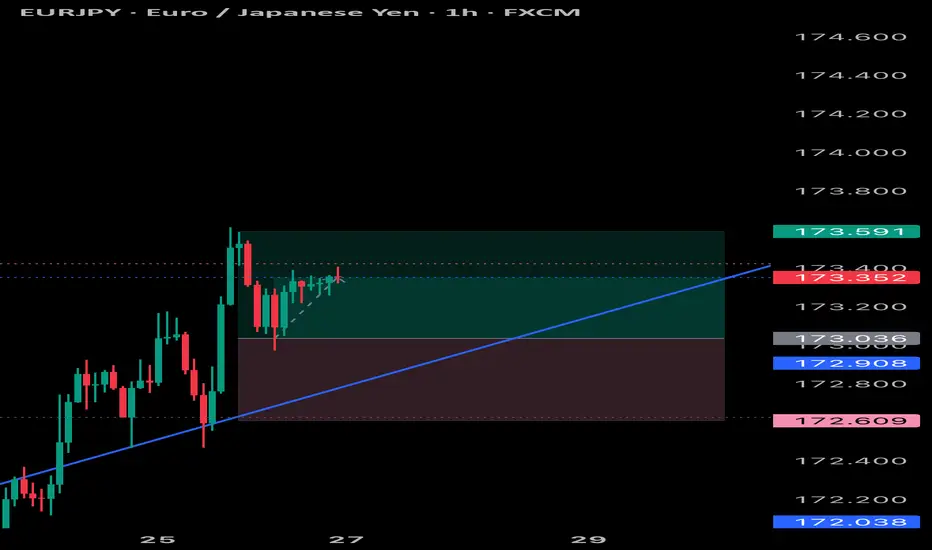
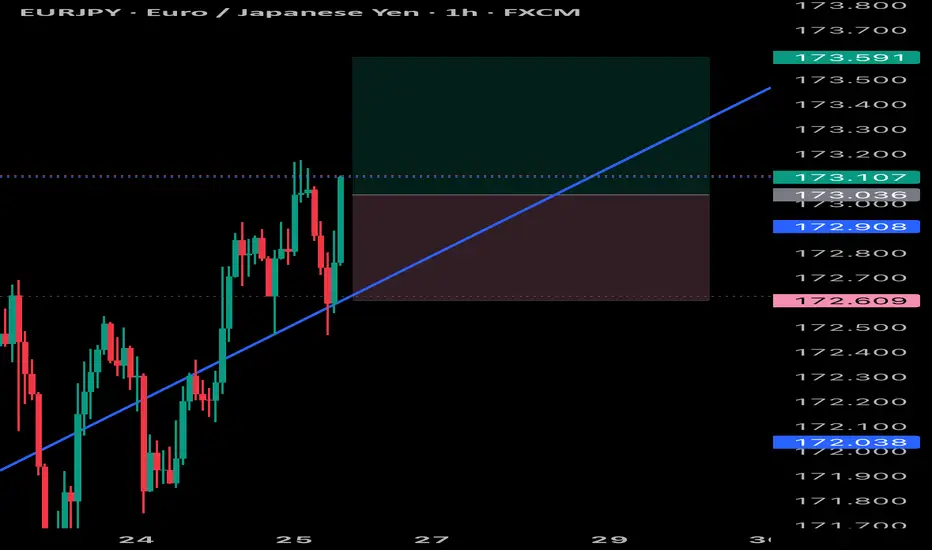
Lower Timeframe Analysis on EUR/JPYIn this trade, I intend to open a long position.
Looking at the lower timeframes (15-minute chart), I see a potential buying opportunity. After reaching the area near the 173.609 level, the pair reversed down to around 172.978, and then bounced back up. This movement may indicate the start of a reversal followed by a pullback.
Moving on to the higher timeframes (daily and weekly), the bullish candles are showing some strength, and the following technical indicators:
* 45-period Exponential Moving Average
* 70 and 95-period Simple Moving Averages
* Parabolic SAR
Are moving in line with the intended direction and objective, which may suggest a continuation of the upward trend.
That said, it's important to remember that despite this technical analysis, it's crucial to monitor economic data, news, and other fundamental factors that could affect this pair, since this assessment focuses solely on the technical side.
The long position tool displayed on the chart is just an additional aid to help support the entry decision.

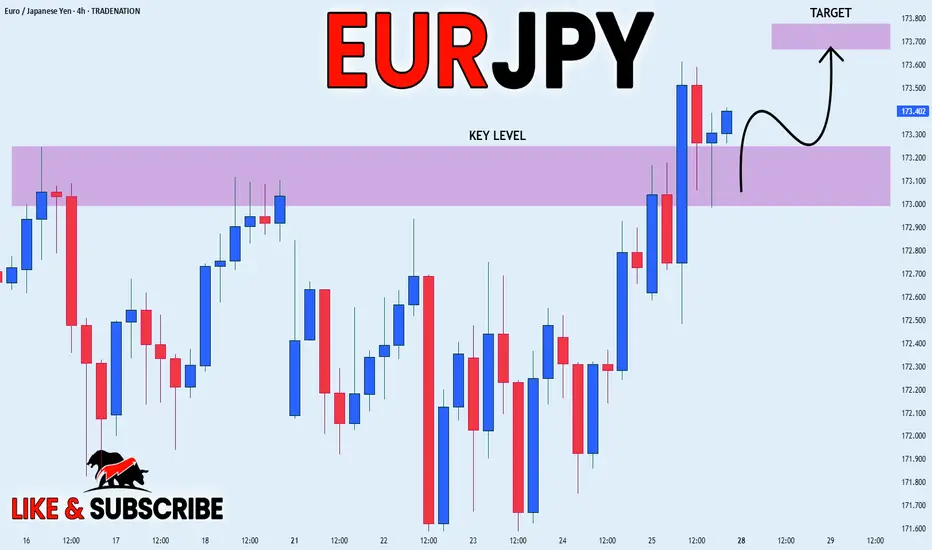
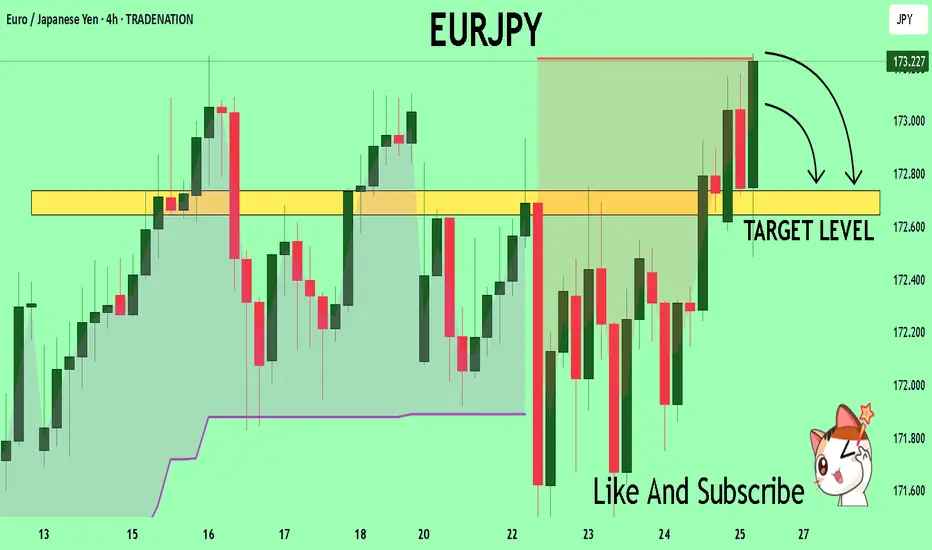
EUR_JPY WILL GROW|LONG|
✅EUR_JPY will keep growing
Because the pair is in the uptrend
And recently broke the key level of 173.200
So we will be expecting
Bullish continuation
LONG🚀
✅Like and subscribe to never miss a new idea!✅
Disclosure: I am part of Trade Nation's Influencer program and receive a monthly fee for using their TradingView charts in my analysis.
EURJPY LOOKING GOOD Eurjpy has been behaving as expected and can continue to the up side and complete its pattern
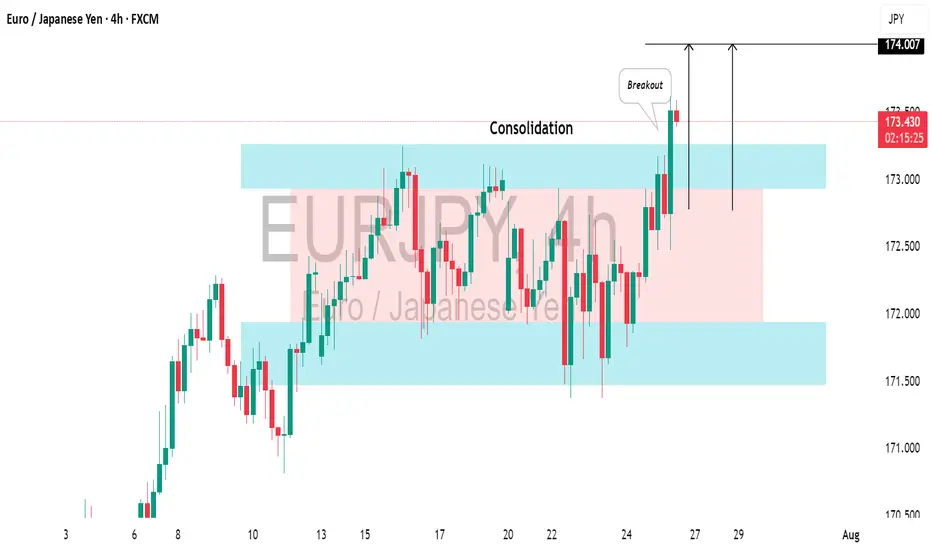
EURJPY: Correction is Over?!It seems like 📈EURJPY has finished consolidating within a broad horizontal channel on the 4H chart.
The formation of a new higher high today suggests potential upward movement.
Since it's Friday, I recommend considering trend-following buys starting Monday.
We should wait for the market to close above the highlighted resistance to establish a Higher Close on the daily chart.
Look to buy after a pullback, targeting 174.00 as the initial goal.
EURJPY; Heikin Ashi with FXAN algo indicator exampleHere you will see my approach with Heikin Ashi chart in combination of algo indicator from FXAN.

EURJPY Market Structure Analysis on 1H, 4H Timeframe4H timeframe is bullish.
1H timeframe is bearish
Price is currently clearing the top of 1H timeframe so there is a high chance that price will continue to fall to the Demand zone of 4H timeframe.

EURJPY Technical Analysis! SELL!
My dear subscribers,
EURJPY looks like it will make a good move, and here are the details:
The market is trading on 173.19 pivot level.
Bias - Bearish
Technical Indicators: Both Super Trend & Pivot HL indicate a highly probable Bearish continuation.
Target - 172.73
About Used Indicators:
The average true range (ATR) plays an important role in 'Supertrend' as the indicator uses ATR to calculate its value. The ATR indicator signals the degree of price volatility.
Disclosure: I am part of Trade Nation's Influencer program and receive a monthly fee for using their TradingView charts in my analysis.
———————————
WISH YOU ALL LUCK
EURJPY BULLS Bullish move from Eurjpy and will keep following it, to its very top with small pullbacks coming but stay prepared can put buy stops
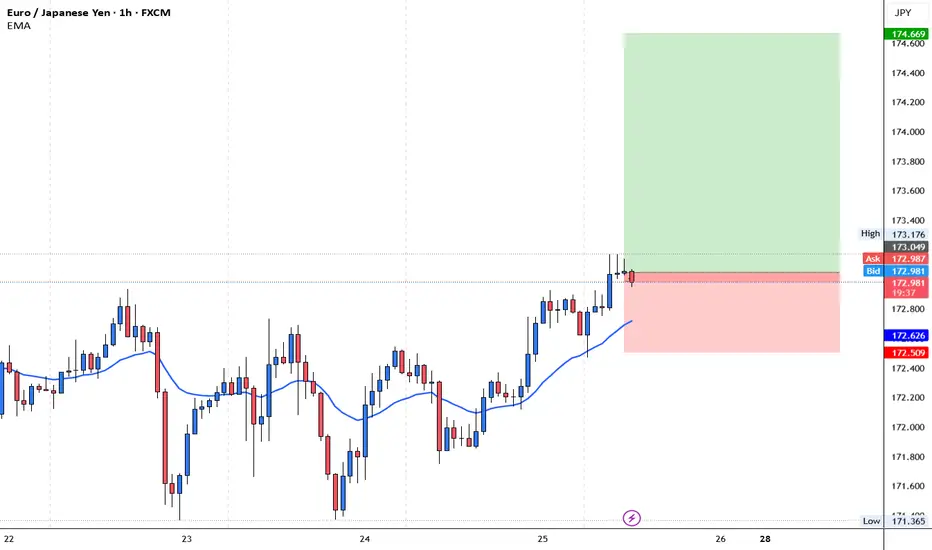
EURJPY BUYJust an idea for short term target with SL and TP.
Timeframe: H1
Price: 173.049
SL: 172.509
TP: 174.669
SL will move to breakeven at 1:1
Close 50% at 1:2
Remaining will run till 1:3
Risk Disclaimer:
Trading foreign exchange on margin carries a high level of risk, and may not be suitable for all investors. Past performance is not indicative of future results. The high degree of leverage can work against you as well as for you. Before deciding to invest in foreign exchange you should carefully consider your investment objectives, level of experience, and risk appetite. The possibility exists that you could sustain a loss of some or all of your initial investment and therefore you should not invest money that you cannot afford to lose. You should be aware of all the risks associated with foreign exchange trading, and seek advice from an independent financial advisor if you have any doubts.
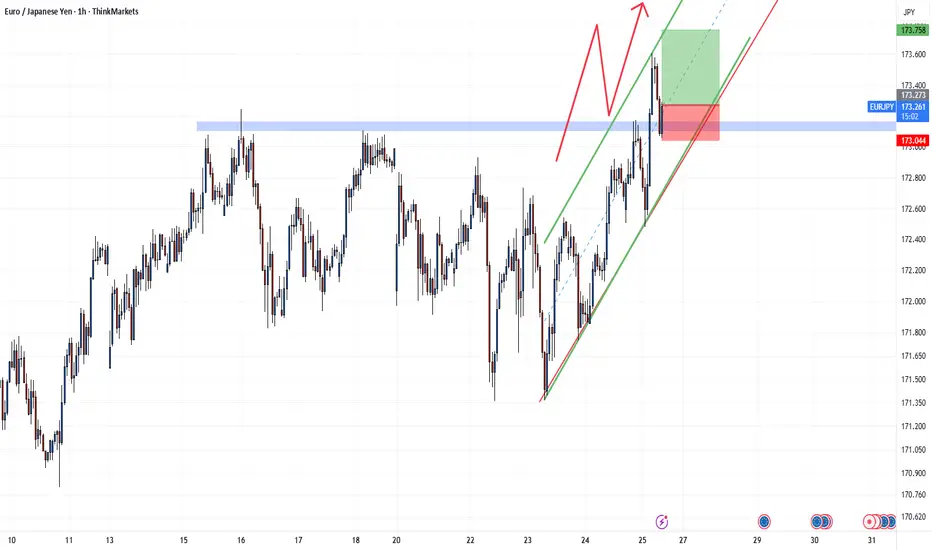
BULLISH SCENARIO EURJPY has been on a consolidation for some few days almost a week, and it looks like the asset has been printing out a flat correction for W4 before it breaks it the upside. The print out of the breakout looks like a LEADING diagonal, which leads to a new Impulse constructing W5. If all goes well we should be looking upstairs before a fall.
Don't forget to apply your trading tactics.

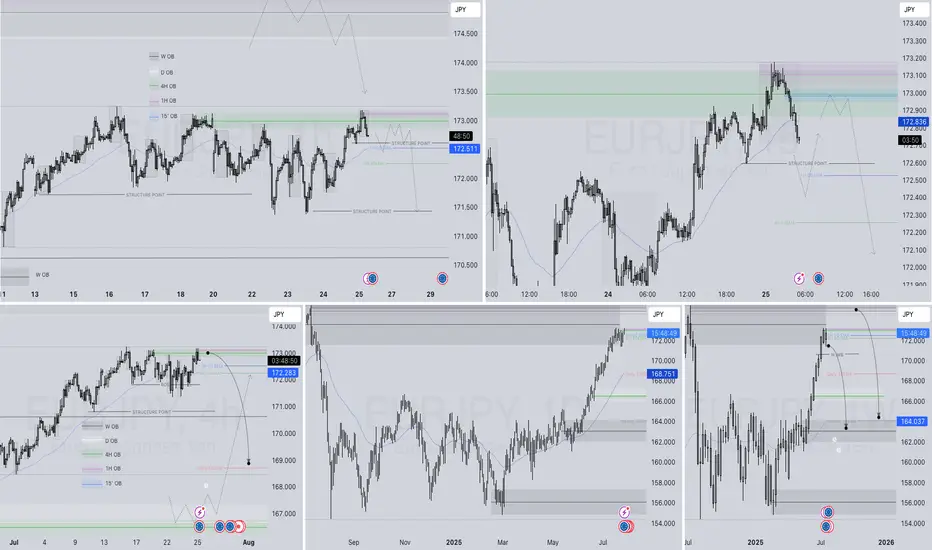
EURJPY Q3 | D25 | W30 | Y25📊 EURJPY Q3 | D25 | W30 | Y25
Daily Forecast🔍📅
Here’s a short diagnosis of the current chart setup 🧠📈
Higher time frame order blocks have been identified — these are our patient points of interest 🎯🧭.
It’s crucial to wait for a confirmed break of structure 🧱✅ before forming a directional bias.
This keeps us disciplined and aligned with what price action is truly telling us.
📈 Risk Management Protocols
🔑 Core principles:
Max 1% risk per trade
Only execute at pre-identified levels
Use alerts, not emotion
Stick to your RR plan — minimum 1:2
🧠 You’re not paid for how many trades you take, you’re paid for how well you manage risk.
🧠 Weekly FRGNT Insight
"Trade what the market gives, not what your ego wants."
Stay mechanical. Stay focused. Let the probabilities work.
FRGNT
OANDA:EURJPY
My outlook on EJJust my outlook so I can come back to this trade and see, I broke one rule here, so lets see if it plays out
Rule broken, didnt wait for Trend confirmation from London
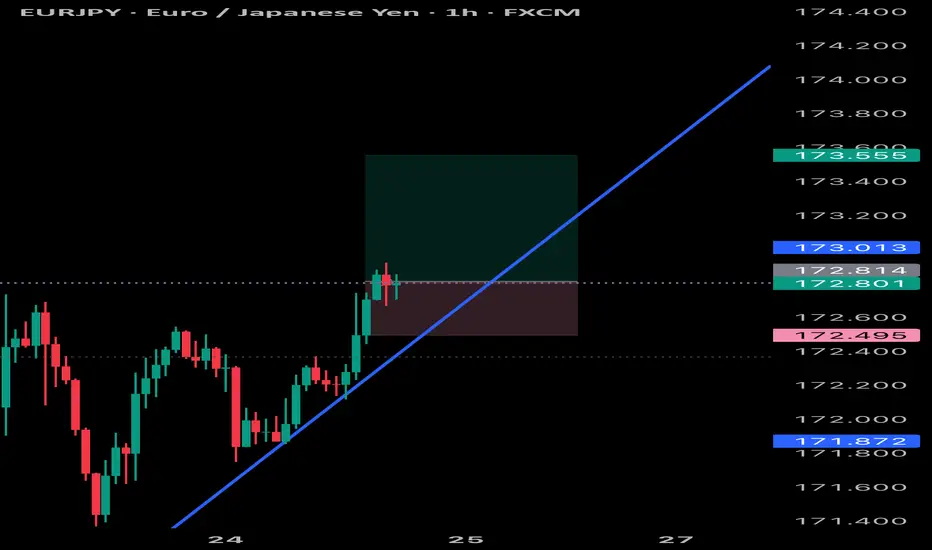
EURJPY Buy SetupEURJPY Buy Setup
📈 Entry: 172.807
🎯 Targets:
TP1: 173.742
TP2: 174.389
🔒 Reason: Price has broken out of a bullish symmetrical triangle pattern, signaling continuation to the upside. Watching for momentum to push toward key resistance levels.
EURJPY Will Explode! BUY!
My dear subscribers,
My technical analysis for EURJPY is below:
The price is coiling around a solid key level - 171.82
Bias - Bullish
Technical Indicators: Pivot Points Low anticipates a potential price reversal.
Super trend shows a clear buy, giving a perfect indicators' convergence.
Goal - 172.34
About Used Indicators:
By the very nature of the supertrend indicator, it offers firm support and resistance levels for traders to enter and exit trades. Additionally, it also provides signals for setting stop losses
Disclosure: I am part of Trade Nation's Influencer program and receive a monthly fee for using their TradingView charts in my analysis.
———————————
WISH YOU ALL LUCK

When the market owes you money. When the market plays as if it owes you money and it sure owes you some after perfect analysis.

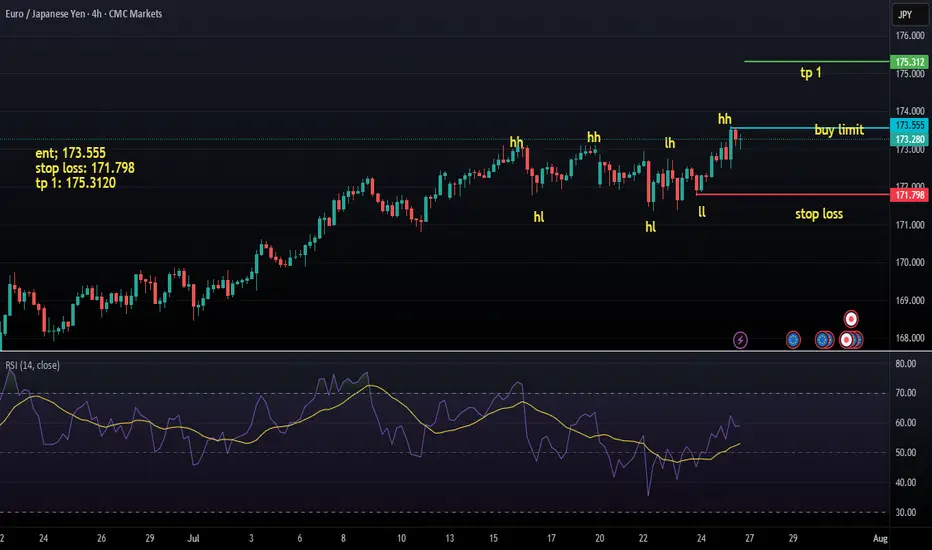
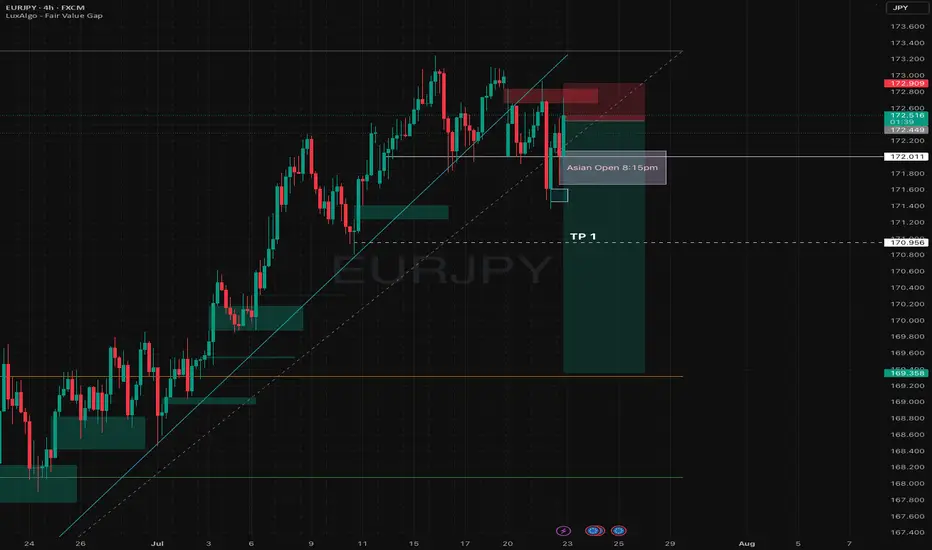
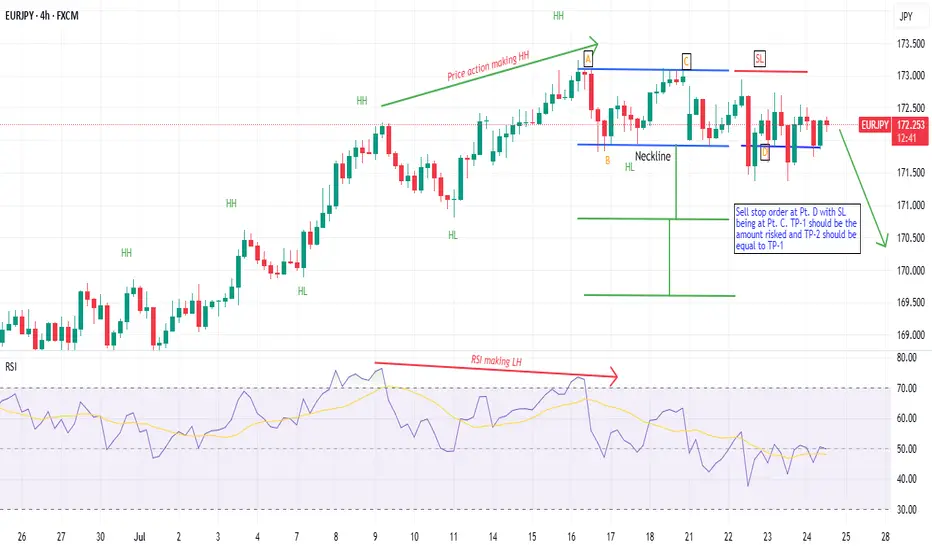
EURJPY - Short Idea - 24th July 2025- Stopped making news HHs
- Suspected Double Top pattern found
- Likely to go bearish
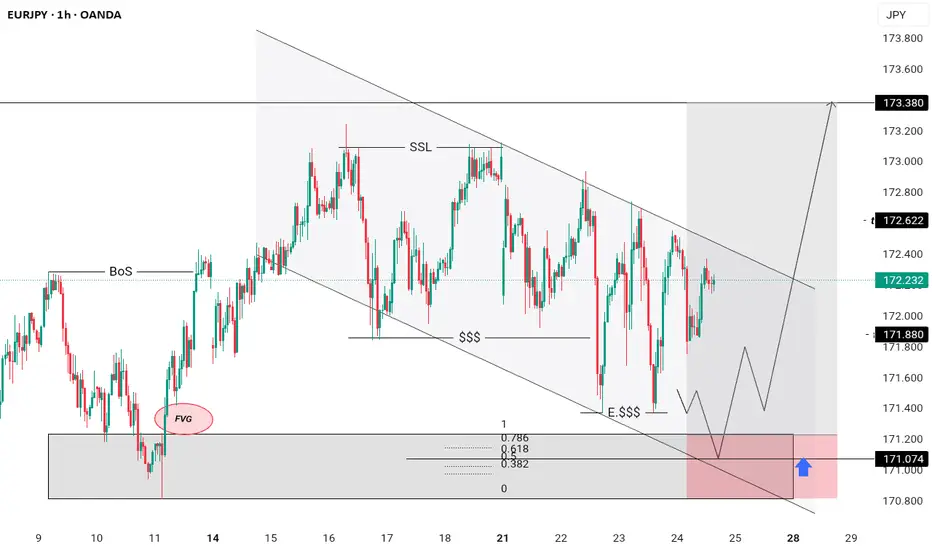
BUY LIMIT EURJPYi expect EURJPY to fall basing on ongoing bearish channel it forms , with respect to this move wednesday liquidity left overs has to swaped with efficiency fill of FVG , where we will activate our entries at 50 % FBnaccic retracement level in our POI
GOODLUCK
always use proper risk management , never riskmore than what u can afford to loose ....