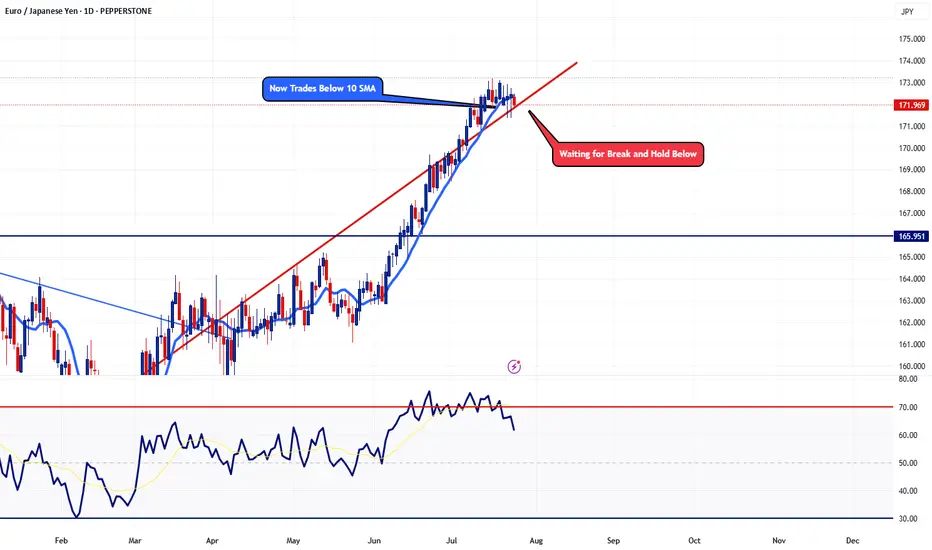
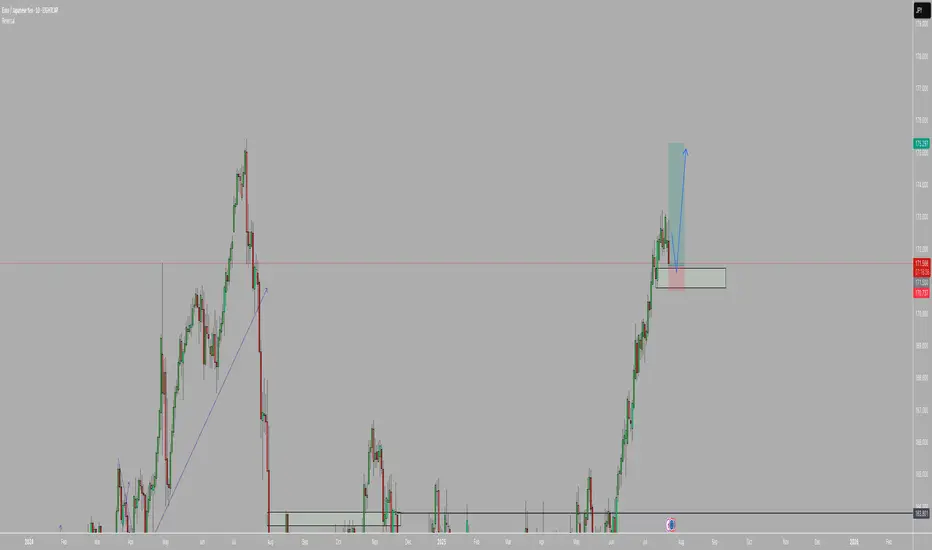
EURJPY - Potential Topping ActionTaking a look at the daily timeframe, price action is now trading below the 10 SMA. This pair has not traded below the 10 SMA since May 26. Now I'm just waiting for a few more confirmation before I'm fully confident. For now, adding a few small sells won't hurt.
Trade Safe - Trade Well
EURJPY trade ideas
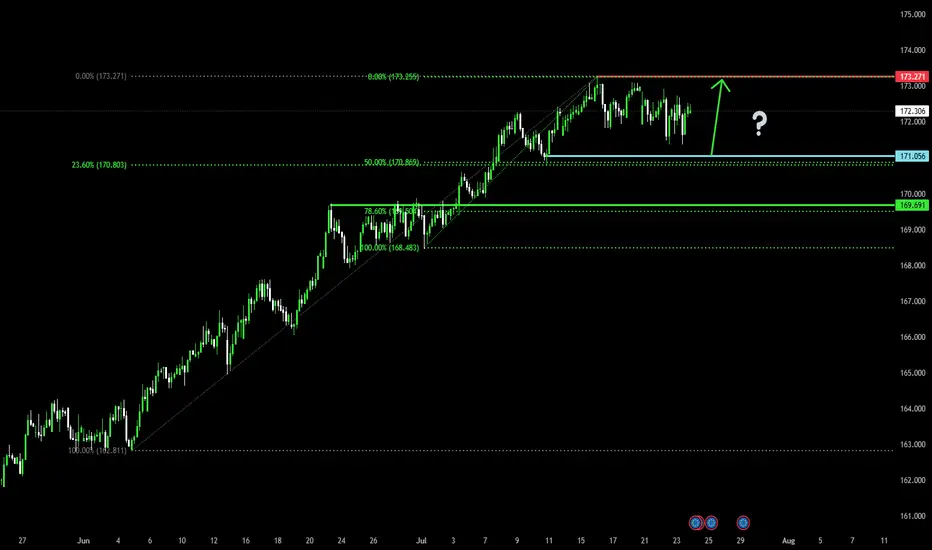
Bullish bounce?EUR/JPY is falling towards the pivot and could bounce to the 1st resistance, which acts as a swing high resistance.
Pivot: 171.05
1st Support: 169.69
1st Resistance: 173.27
Risk Warning:
Trading Forex and CFDs carries a high level of risk to your capital and you should only trade with money you can afford to lose. Trading Forex and CFDs may not be suitable for all investors, so please ensure that you fully understand the risks involved and seek independent advice if necessary.
Disclaimer:
The above opinions given constitute general market commentary, and do not constitute the opinion or advice of IC Markets or any form of personal or investment advice.
Any opinions, news, research, analyses, prices, other information, or links to third-party sites contained on this website are provided on an "as-is" basis, are intended only to be informative, is not an advice nor a recommendation, nor research, or a record of our trading prices, or an offer of, or solicitation for a transaction in any financial instrument and thus should not be treated as such. The information provided does not involve any specific investment objectives, financial situation and needs of any specific person who may receive it. Please be aware, that past performance is not a reliable indicator of future performance and/or results. Past Performance or Forward-looking scenarios based upon the reasonable beliefs of the third-party provider are not a guarantee of future performance. Actual results may differ materially from those anticipated in forward-looking or past performance statements. IC Markets makes no representation or warranty and assumes no liability as to the accuracy or completeness of the information provided, nor any loss arising from any investment based on a recommendation, forecast or any information supplied by any third-party.
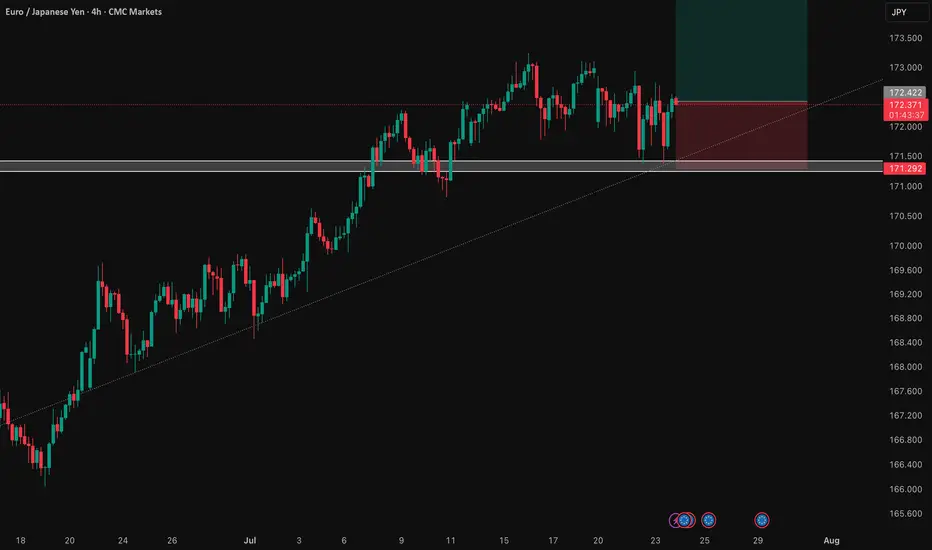
EUR/JPY: Bullish Thesis on Policy DivergenceOur primary thesis is built on a powerful confluence of compelling fundamental drivers and a clear technical structure. We are taking a long position in EUR/JPY with high conviction, anticipating significant upside fueled by a stark monetary policy divergence confirmed by a constructive chart formation.
📰 Fundamental Analysis: The core of this trade is the widening policy gap between the European Central Bank (ECB) and the Bank of Japan (BoJ). While the BoJ is only just beginning to exit its ultra-loose monetary policy, the global environment points toward continued JPY weakness. The upcoming high-impact US news will act as a major catalyst. A "risk-on" reaction to the data would significantly weaken the JPY, providing a strong tailwind for this trade.
📊 Technical Analysis: The chart structure for EUR/JPY is decidedly bullish. The pair has established a clear uptrend, and recent price action indicates a period of healthy consolidation above key support levels. This presents a strategic entry point, as the market appears to be gathering momentum for the next leg higher. The current setup suggests a low-risk entry into a well-defined upward trend.
🧠 The Trade Plan: Based on this synthesis, we are executing a precise trade with a favorable risk profile.
👉 Entry: 172.422
⛔️ Stop Loss: 171.292
🎯 Take Profit: 174.684
⚖️ Risk/Reward: 1:2
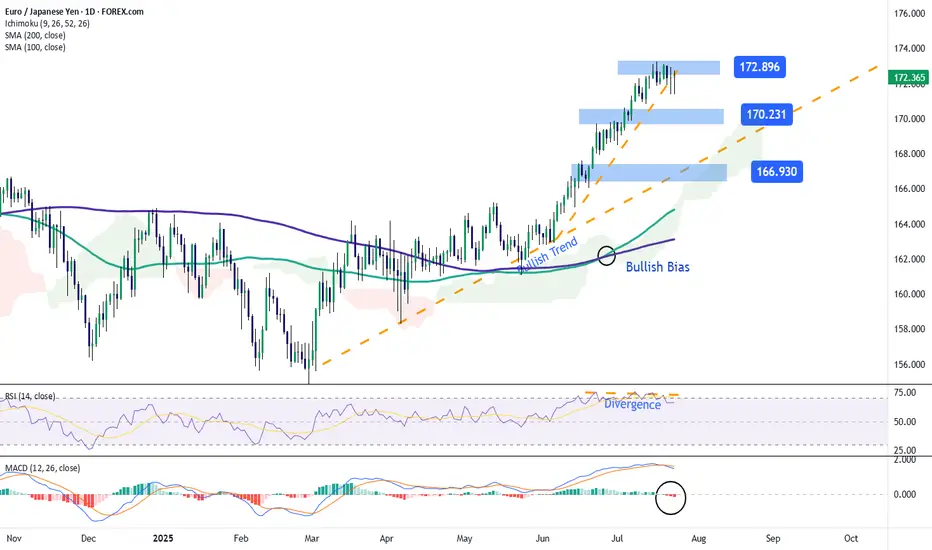
EUR/JPY: The Yen Begins to Gain GroundOver the past three trading sessions, the EUR/JPY pair has declined by up to 0.8%, as the yen has steadily gained strength, preventing the euro from maintaining its momentum in the short term. Selling pressure has held firm, especially after news that Japan finalized a new trade agreement with the United States, which lowered the initially proposed 25% tariff to 15%. This development has been perceived as a positive outcome for Japan and has supported strong demand for the yen in the latest trading session.
Uptrend Remains Intact
Despite the yen’s recent strength, it is important to note that the EUR/JPY pair remains in a well-defined uptrend, with sustained bullish momentum continuing to dominate the long-term outlook. Although some short-term selling corrections have emerged, they remain insufficient to break the current bullish structure. For now, the uptrend remains the most relevant technical formation in the chart and should continue to be monitored unless selling pressure becomes significantly stronger.
RSI
The RSI indicator has started to show lower highs, while price action continues to register higher highs. This event suggests the potential formation of a bearish divergence, which may indicate that the current selling correction could gain more traction in the coming sessions.
MACD
The MACD histogram remains close to the neutral zero line, indicating that no clear direction has formed in short-term moving average momentum. If this neutral setting continues, the chart could enter a more defined consolidation phase in the near term.
Key Levels to Watch:
172.896 – Resistance Level: This level corresponds to the recent high, and any buying momentum strong enough to break it could confirm a bullish continuation, supporting the long-standing uptrend currently in place.
170.231 – Nearby Support: This level aligns with a short-term neutral zone and may act as a temporary barrier, limiting any bearish corrections that may arise in the sessions ahead.
166.930 – Key Support: This is a critical level not seen since June of this year. If bearish pressure intensifies and the price falls to this point, it could seriously jeopardize the bullish structure that has been holding so far.
Written by Julian Pineda, CFA – Market Analyst
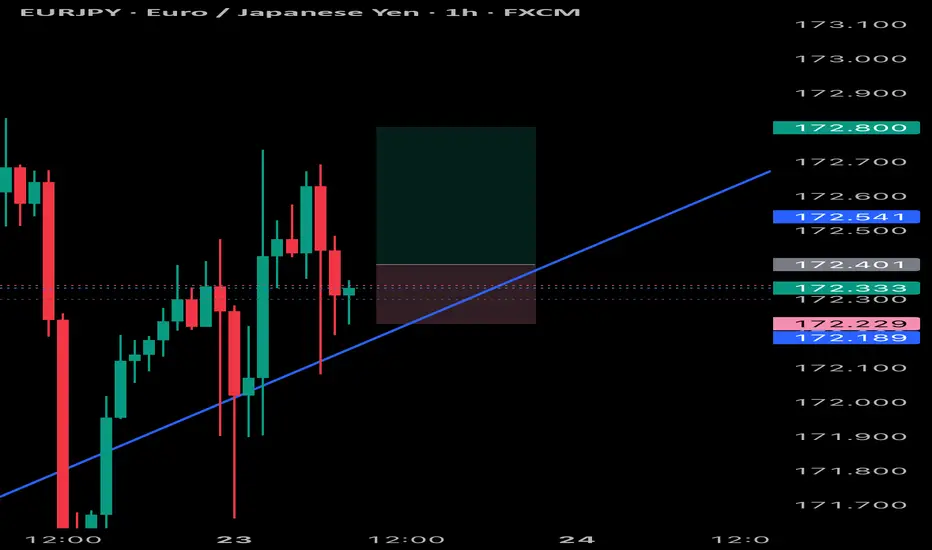
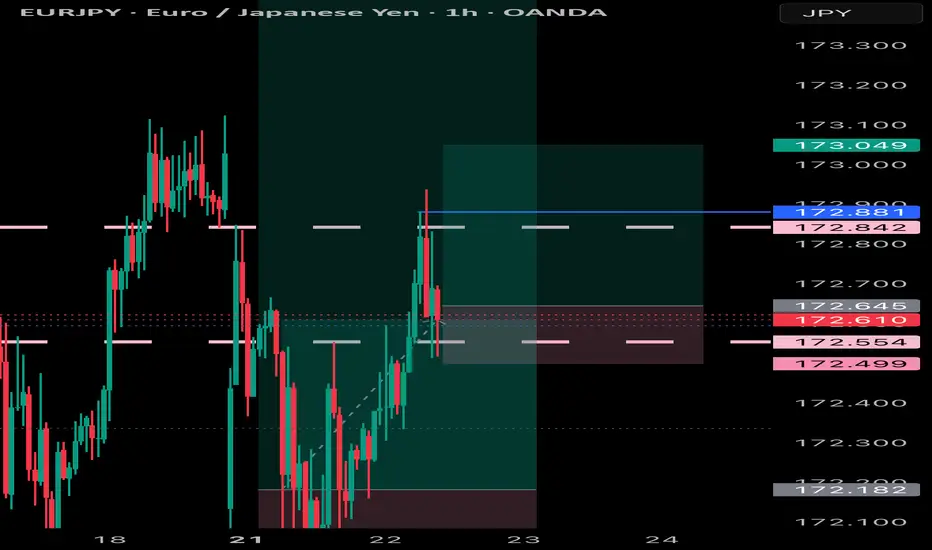
EUR/JPY - Good OpportunityPrice tapped into 1H demand zone and the 15min OB inside the FVG before showing a strong rejection. Bullish structure still intact with a clean 2:1 RR targeting previous supply zone. Patience paid off on this textbook entry.
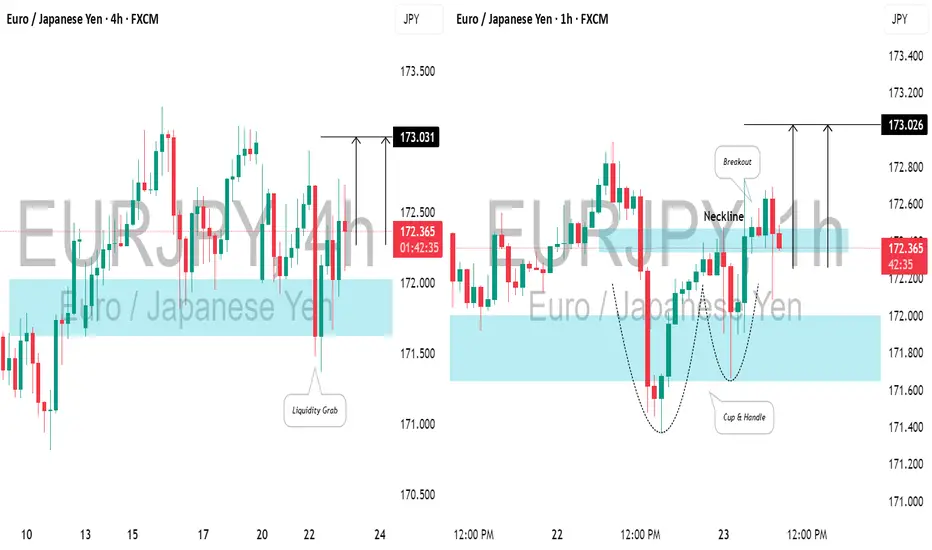
EURJPY: Bullish Move After Liquidity Grab📈EURJPY created a bearish high-range candle beneath a crucial support level in a horizontal trading range on the 4-hour chart.
However, a subsequent recovery and a bullish opening in the Asian session indicate a strong likelihood of an upward movement today, targeting 173.00.
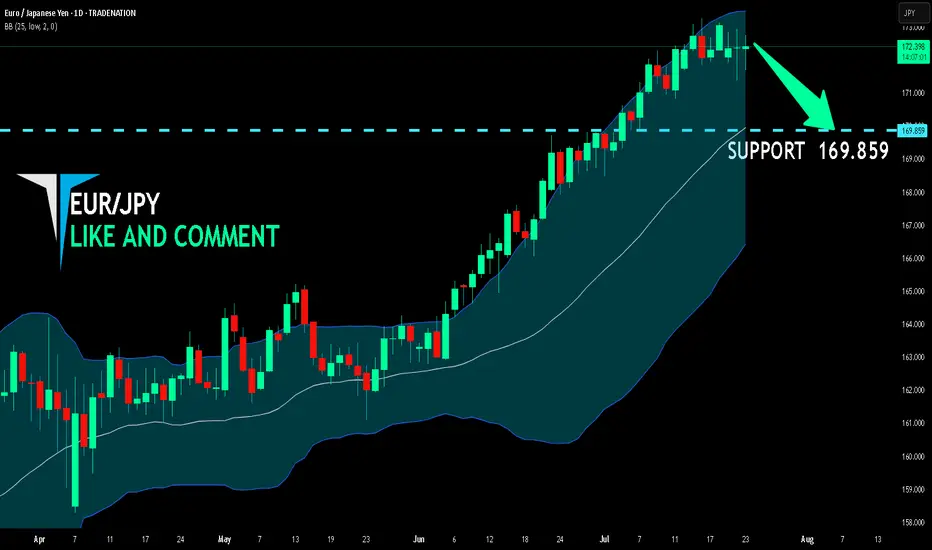
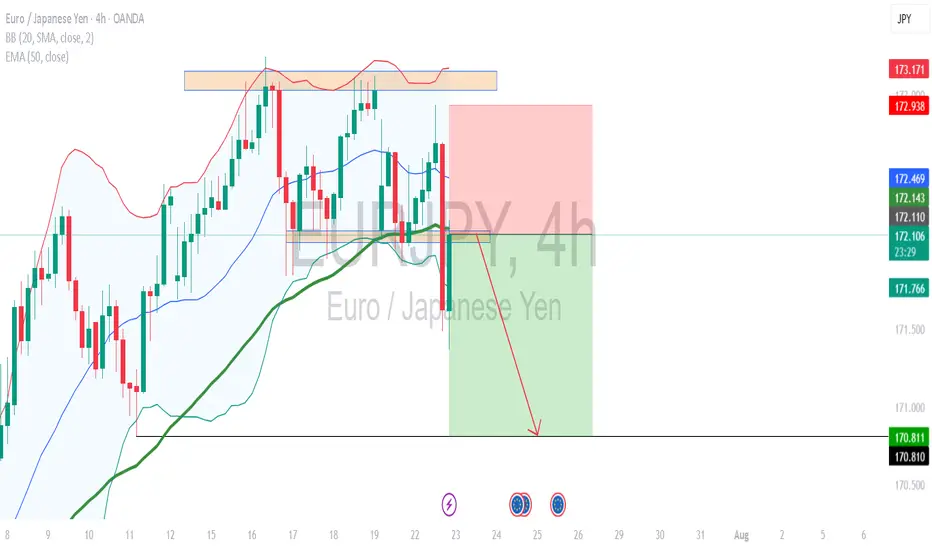
EUR/JPY BEST PLACE TO SELL FROM|SHORT
Hello, Friends!
EUR-JPY uptrend evident from the last 1W green candle makes short trades more risky, but the current set-up targeting 169.859 area still presents a good opportunity for us to sell the pair because the resistance line is nearby and the BB upper band is close which indicates the overbought state of the EUR/JPY pair.
Disclosure: I am part of Trade Nation's Influencer program and receive a monthly fee for using their TradingView charts in my analysis.
✅LIKE AND COMMENT MY IDEAS✅
EURJPY break of strong support , at fib 0.5 short EURJPY was trending in uptrend but recently a strong support was broken and Big Sell candle is formed and currently price has pulled back to fib 0.5 and soon may price go down.

EURJPY
📍 Strategy: BoS + Retest Sniper Entry
🔍 Market Context:
Break of Structure (BoS) confirmed
Price returned to retest broken structure zone
RSI showing overbought divergence (above 70)
Perfect rejection from AREA OF INTEREST near 172.90–173.00
🔻 TRADE DETAILS
🟣 Sell Entry: 172.349
🔺 Stop Loss: 172.948 (Above structure high)
🎯 Take Profit: 169.146
🧮 Risk/Reward: ~1:5.6
🧠 Confidence: 75% setup based on structure + RSI + fakeout wick

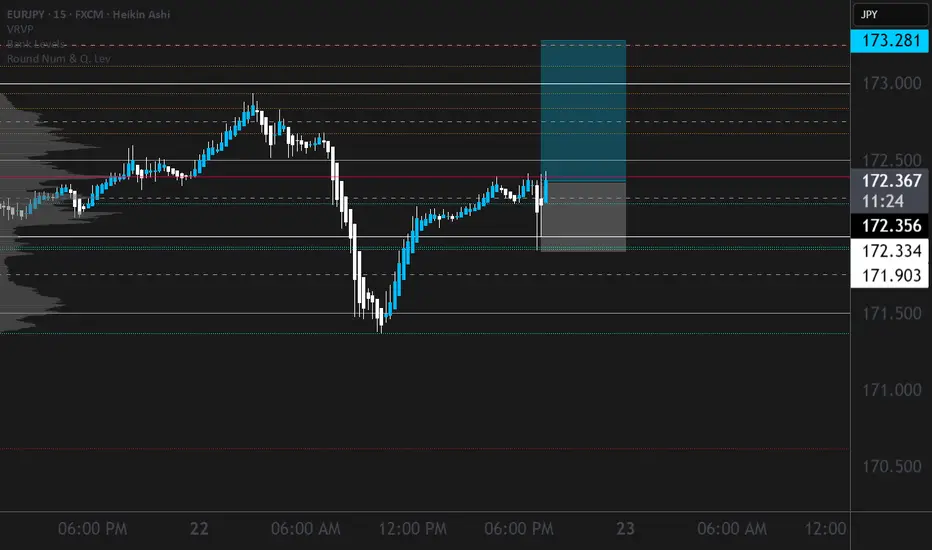
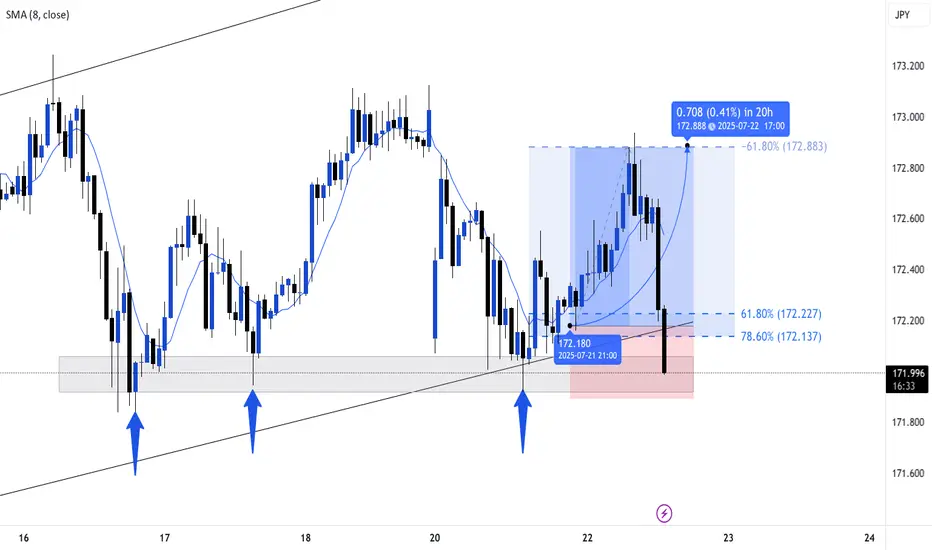
EURJPY 4H chartIf price fails to reclaim above 172.5 and prints a bearish confirmation candle on the retest, it's a high-probability short opportunity targeting the 170.000–169.800 support zone — as you've marked.
EURJPY Short at current market priceH4 Price action showing support has been broken.
Seller started to stepping in.
Now support become resistant.
calculate your own risk & reward.
Good Luck
RESET PRICE FOR EJEurjpy has gone down but only to clear stops and lows but we keep following the trend because it is the only true direction for now

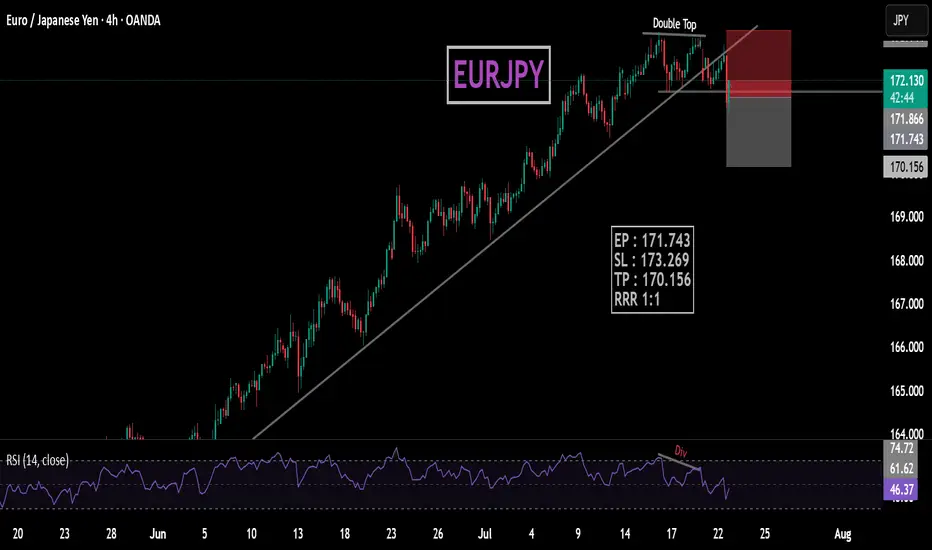
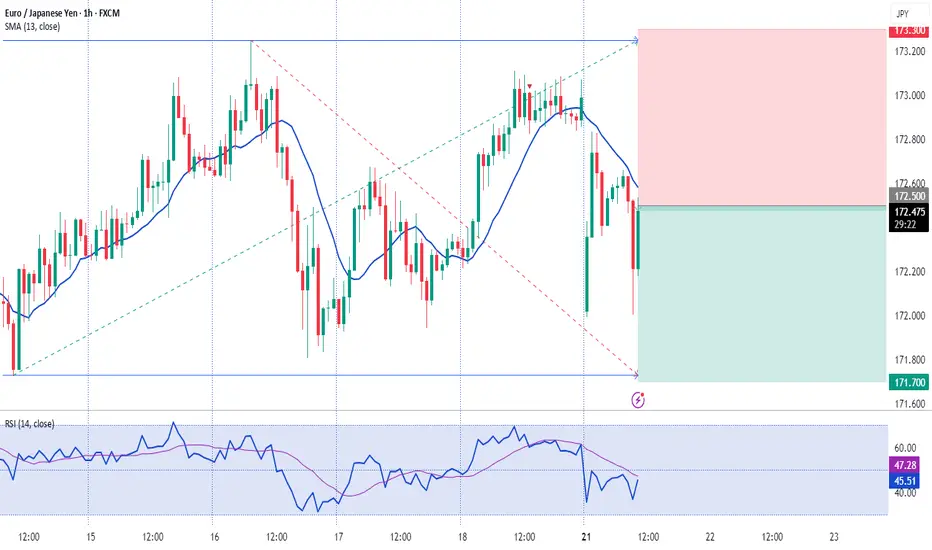
EURJPYDouble top with rsi bearish Divergence also bulish trendline beark.
EP : 171.743
SL : 173.269
TP : 170.156
RRR 1:1
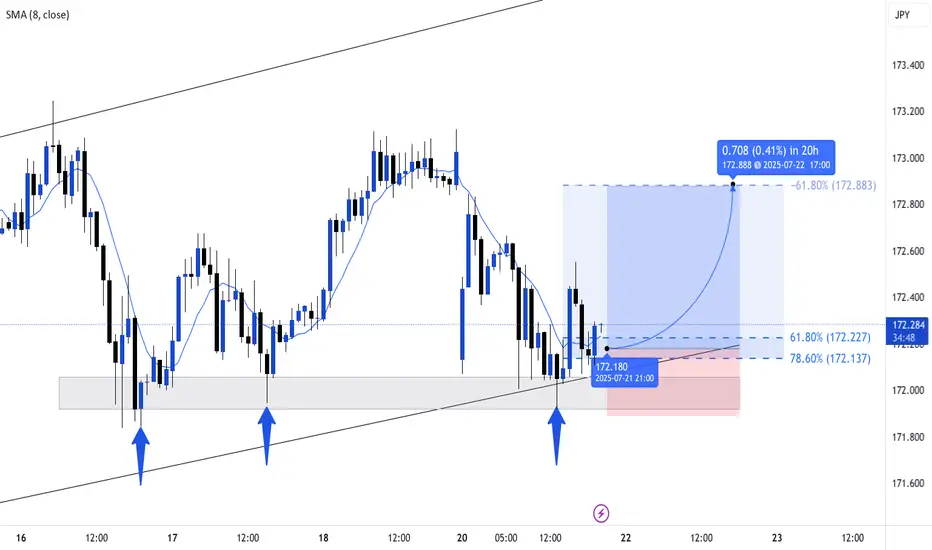
EURJPY BUYSI'm still strongly bullish on the Euro, and this current pullback on EURJPY appears to be a healthy retracement within the larger uptrend. It offers a good opportunity to enter long positions with the expectation of a move back to retest the highs reached in July 2024.
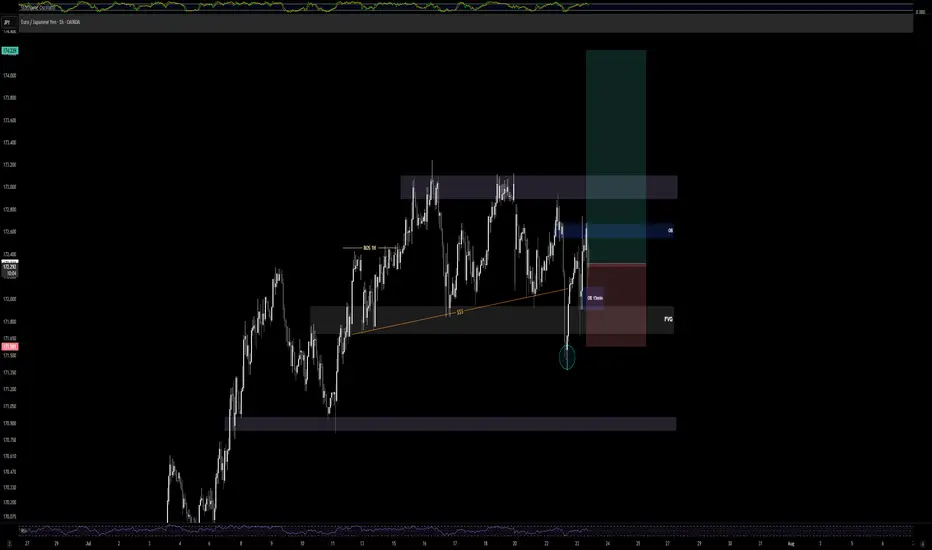
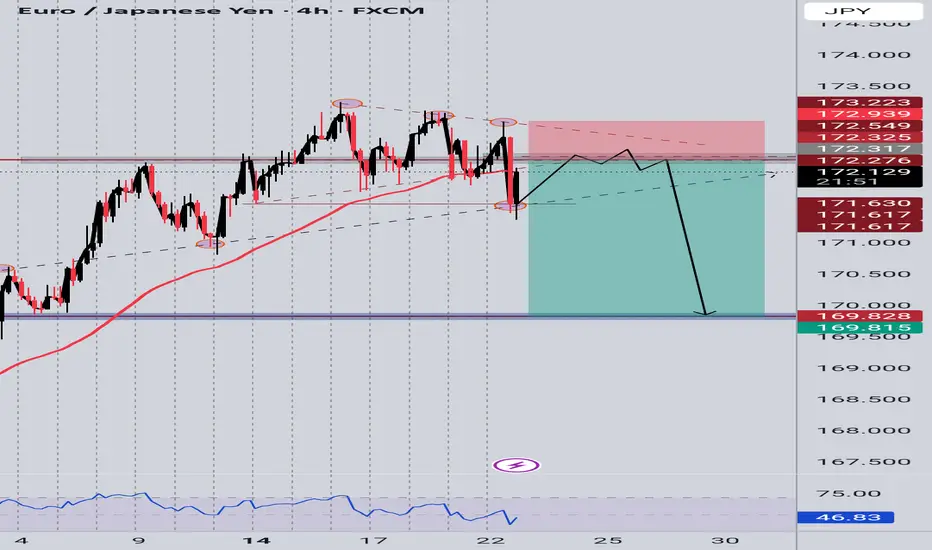
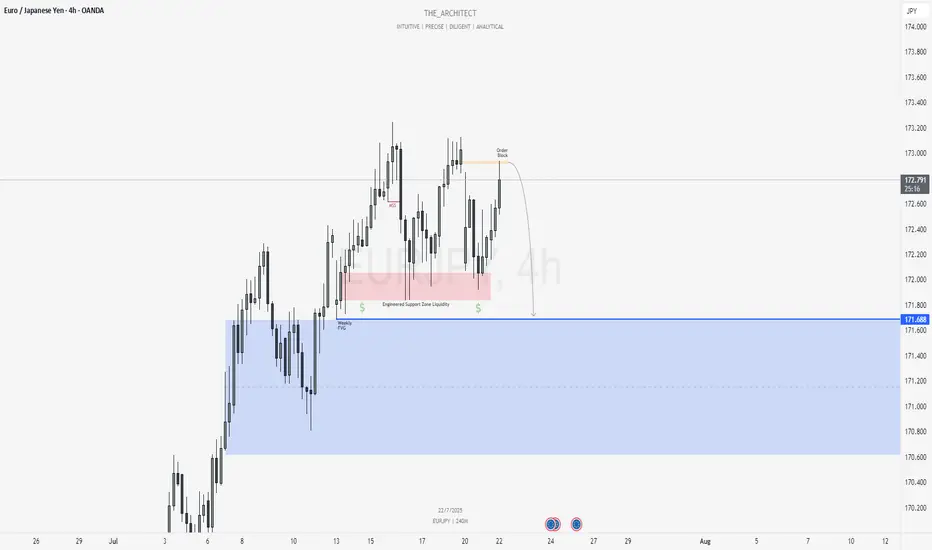
EURJPY: MSS on H4 Signals Bearish Shift Toward Weekly FVGGreetings Traders,
In today’s analysis of EURJPY, we observe that a Market Structure Shift (MSS) has recently occurred on the H4 timeframe, indicating a potential change in directional bias. This suggests that price may begin to draw toward the Weekly Fair Value Gap (FVG), presenting a favorable opportunity to align with bearish order flow.
Higher Timeframe Context:
The weekly timeframe currently shows an unfilled Fair Value Gap (FVG) to the downside, acting as the primary draw on liquidity. This macro bearish draw adds weight to the idea of shorting the pair from premium levels. On the H4—our intermediate timeframe—we now have structural confirmation via a bearish MSS, aligning the two timeframes toward downside targets.
Key Observations on H4:
Bearish Order Block in Premium: Price has recently retraced into an H4 bearish order block situated within premium pricing. This zone acts as institutional resistance and is currently showing signs of rejection.
Confirmation Zone: This H4 bearish order block is being monitored for M15 confirmation entries, as we look for price to break lower from this key institutional level.
Engineered Support & Resting Liquidity: Just above the weekly FVG lies an engineered support zone—characterized by equal lows—suggesting that liquidity has been pooled there. This area serves as a high-probability draw for institutional price delivery.
Trading Plan:
Entry Strategy: Seek lower timeframe (M15) confirmation around the H4 bearish order block before initiating short positions.
Targets: The first target lies at the H4 internal liquidity pool within discounted pricing. The longer-term objective is the weekly FVG, where liquidity is likely to be delivered next.
For a detailed analysis, please watch this weeks Forex Outlook:https://tradingview.sweetlogin.com/chart/EURNZD/BZC9xW1L-July-21-Forex-Outlook-Don-t-Miss-These-High-Reward-Setups/
Maintain patience, follow your confirmation rules, and always adhere to sound risk management principles.
Kind Regards,
The_Architect 🏛️📉
UP TREND Simple up trend that is being followed and respected here by the price , we BULLS are in control
EURJPY in bullish trend EURJPY in bullish trend, potential reversal setup Entry with sell stop. RR 1:1

EURJPY buysHello everyone,
I am looking for eurjpy buys only because on the 15 min chart, price decided to take out EQL's to go long thus creating a big bullish move which has been marked in yellow and annotated.
Price than made this wedge liquidity zone where both EQL's and EQH's are present so we believe outside of this range is where the liquidity actually is.
4hr and 15 min demand zone is still untouched so we're looking for the buy around the 171.185 area to be precise.
I will be putting up screenshots as well so that it makes sense.
