EURJPY – TCB Setup (Higher Timeframe Validation)🕐 EURJPY – TCB Setup (Higher Timeframe Validation ✅)
Strategy: Trend → Countertrend → Breakout (TCB)
Timeframe: 1H
Status: Breakout confirmed — now watching EP1/EP2 for clean entry signals
🔍 Setup Breakdown:
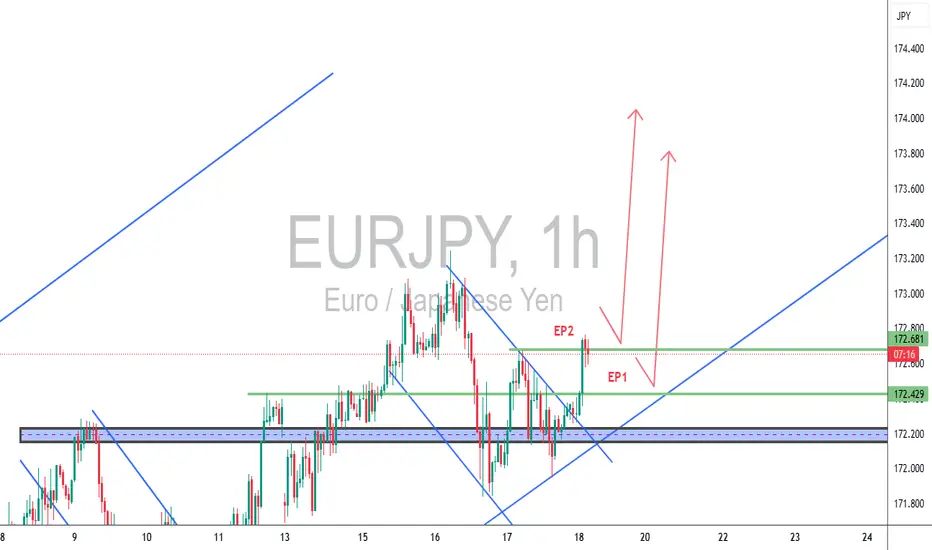
📈 Trend: Clean bullish channel structure still intact
↘️ Countertrend: Descending wedge fully broken to the upside
🚀 Breakout: Price is now testing key structure → breakout above 172.429 & 172.681 zones
📌 Trade Plan:
EP1: 172.429 — safer, structure-based retest
EP2: 172.681 — aggressive entry if price holds above
SL: 172.150
TP1: 173.400
TP2: 174.000
R:R: 1:2.5+ depending on entry location
Checklist Score: 95% — confirmed breakout, now waiting for execution model in NY or Asia session
🧠 TCB Note:
Higher timeframe confluence makes this setup stronger. Look for price action confirmation (e.g. bullish engulfing or rejection wicks) at EP1/EP2 before executing.
#EURJPY #ForexTCB #BreakoutTrading #PriceActionFX #SmartMoneyFlow
EURJPY trade ideas
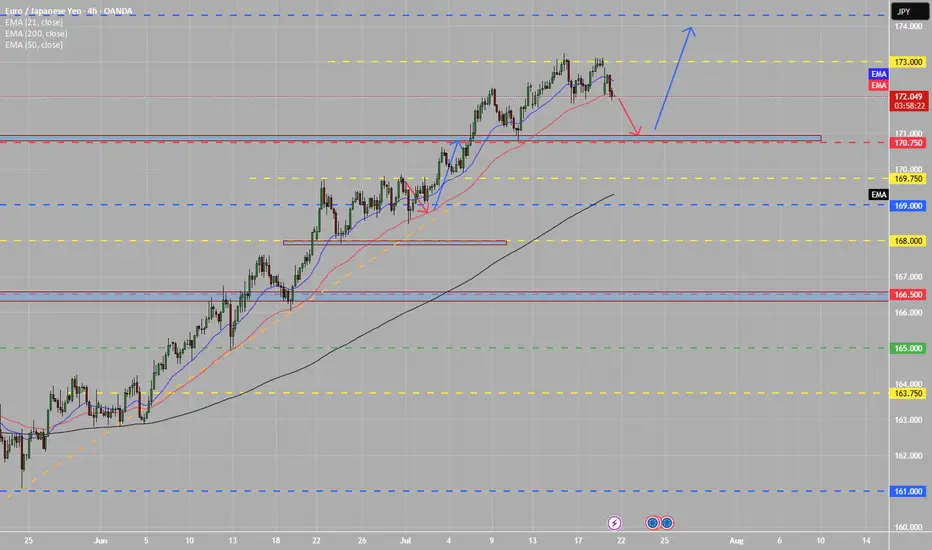
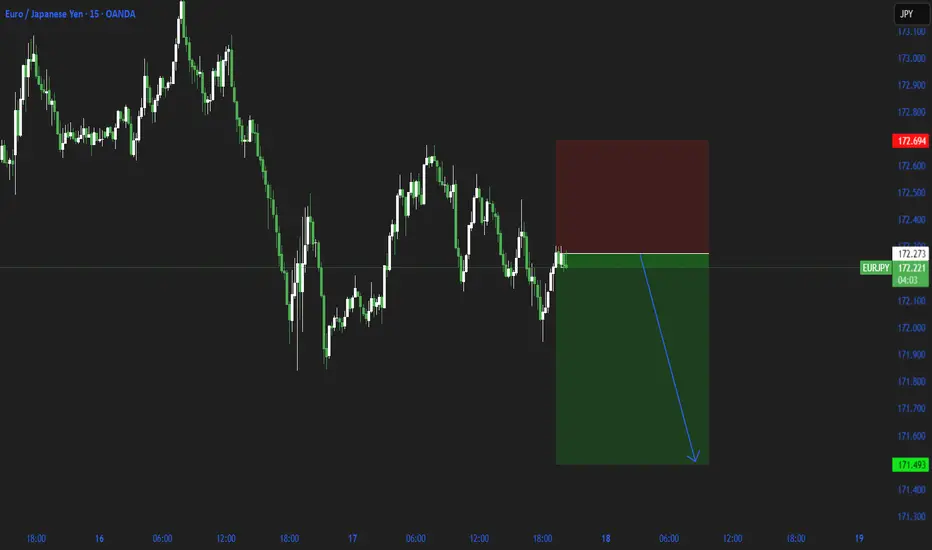
EJ BULLISH SETUP Looking for a nice retest at the daily support zone, if this holds true price will start to look for monthly resistance marked in blue.
EURJPY at Risk of Breakdown Below Key Support📈 EURJPY Approaches Key Technical Breakout Point
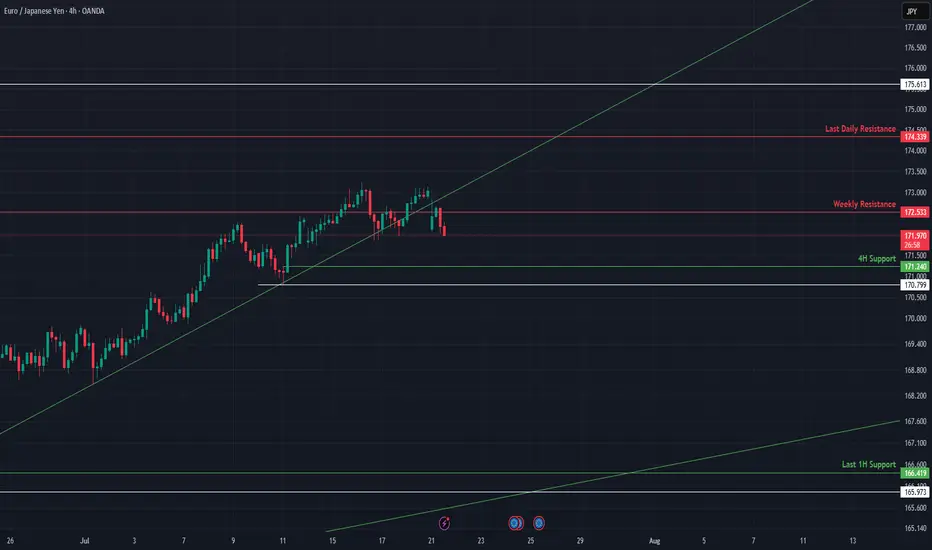
EURJPY is caught between a critical 4H support and weekly resistance, with momentum beginning to compress. The next move hinges on whether price holds the rising trendline or breaks beneath it. This update outlines the active structure, key levels, and macro narrative around JPY weakness.
🔍 Technical Analysis:
EURJPY recently rejected from weekly resistance at 172.53 and is now sitting on the 4H support at 171.24, right above an ascending trendline. The structure remains bullish while this trendline holds, but a breakdown below 170.77 would flip the bias.
On the upside, reclaiming 172.53 opens the path toward 174.33 (Last Daily Resistance). If support gives way, expect a drop toward 166.80 or lower.
🛡️ Support Zones (if pullback continues):
🟢 171.24 – 4H Support (High Risk)
Immediate support. Good for tight risk scalps.
Stop-loss: Below 170.77
🟡 166.89 – 165.27 – 1H Last Support (Medium Risk)
Strong historical base + diagonal confluence. Favorable for intraday or swing entries.
Stop-loss: Below 165.00
🔼 Resistance Levels:
🔴 172.53 – Weekly Resistance
Key rejection point. Break above this confirms upside continuation.
🔴 174.33 – Last Daily Resistance
Major supply zone. Bullish breakout target.
🧭 Outlook:
Bullish Case:
Hold above 171.24 and break 172.53 = upside continuation toward 174.33.
Bearish Case:
Break below 170.77 and failure to reclaim = possible slide toward 166.80 and below.
Bias:
Neutral–bullish while price holds above trendline. Flip bearish on close below 170.77.
🌍 Fundamental Insight:
JPY remains weak due to BoJ’s ultra-loose stance. However, intervention risk remains elevated if yen depreciation becomes disorderly. Euro remains supported by ECB’s hawkish tone and improving economic data. Watch for BOJ rhetoric and global yield shifts.
✅ Conclusion:
EURJPY is resting at a structural pivot between 4H support and weekly resistance. A breakout in either direction will likely determine the trend into August. Bulls must defend the trendline and 171.24 to stay in control.
Not financial advice. Like & follow for more high-probability setups across FX majors.
short eurjpysell eurjpy targetting 100% fib level as tp1. even though it is a weekly analysis, i dont intend to stay in it for more than a week

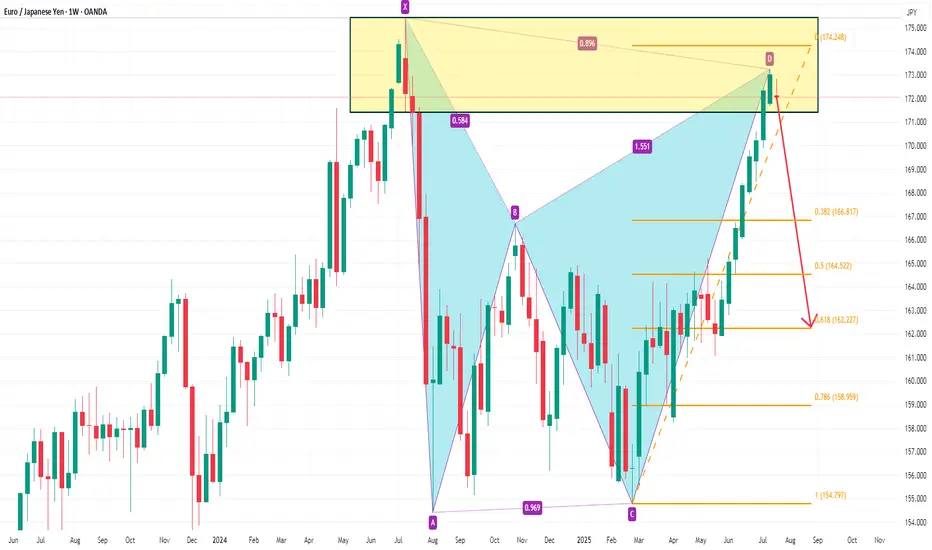
EURJPY Bearish Bat PatternOn the weekly chart, EURJPY has currently formed a bearish bat pattern, and short selling can be considered at present. The downside target is around 166.8. After breaking through, the support below is around 162.2.
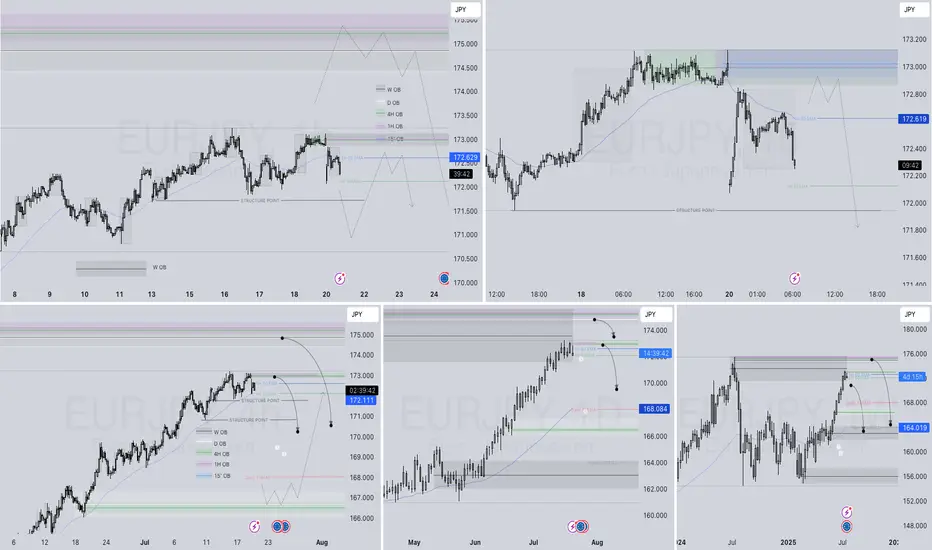
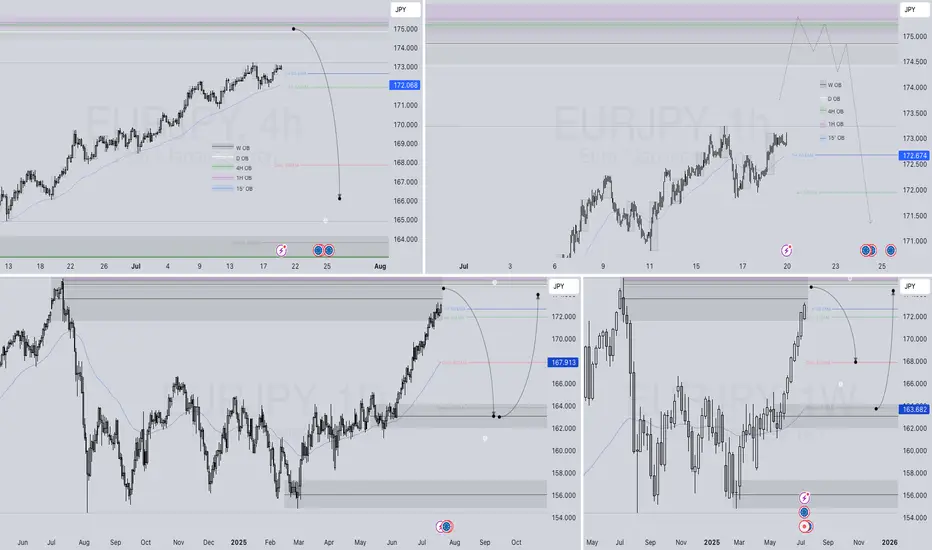
EURJPY Q3 | D21 | W30 | Y25📊EURJPY Q3 | D21 | W30 | Y25
Daily Forecast 🔍📅
Here’s a short diagnosis of the current chart setup 🧠📈
Higher time frame order blocks have been identified — these are our patient points of interest 🎯🧭.
It’s crucial to wait for a confirmed break of structure 🧱✅ before forming a directional bias.
This keeps us disciplined and aligned with what price action is truly telling us.
📈 Risk Management Protocols
🔑 Core principles:
Max 1% risk per trade
Only execute at pre-identified levels
Use alerts, not emotion
Stick to your RR plan — minimum 1:2
🧠 You’re not paid for how many trades you take, you’re paid for how well you manage risk.
🧠 Weekly FRGNT Insight
"Trade what the market gives, not what your ego wants."
Stay mechanical. Stay focused. Let the probabilities work.
FRGNT 📊
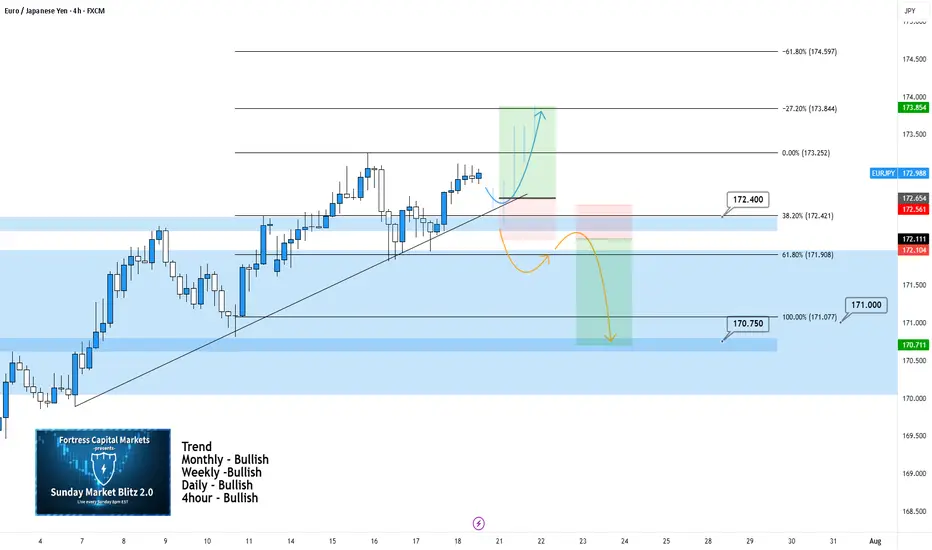
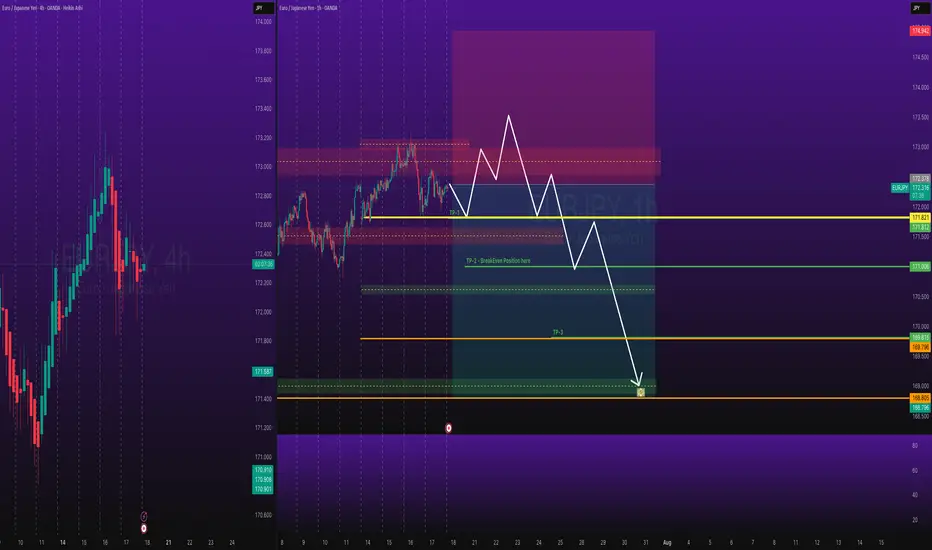
EURJPY 4Hour TF - July 20th, 2025EURJPY 7/20/2025
EURJPY 4hour Bullish Idea
Monthly - Bullish
Weekly - Bullish
Daily - Bullish
4hour - Bullish
Bullish Continuation - This is the most likely scenario for EJ this week as nothing suggests anything other than Bullish activity.
EJ could take off right at market open and start pushing up without giving us a retest to enter on. If we do get some sort of retest or pullback, look for rejection as close to 172.400 as possible before looking long.
If this does execute it looks like it will be a very small window of opportunity to enter. Trade cautiously with EJ in this bullish scenario.
Bearish Reversal - This scenario is less likely but is much more favorable in my opinion.
For us to consider EJ bearish we would need to see a clear break below 172.400 with a lower high below. This would give us enough confidence to consider short scenarios and start looking lower toward major support levels like 170.750.
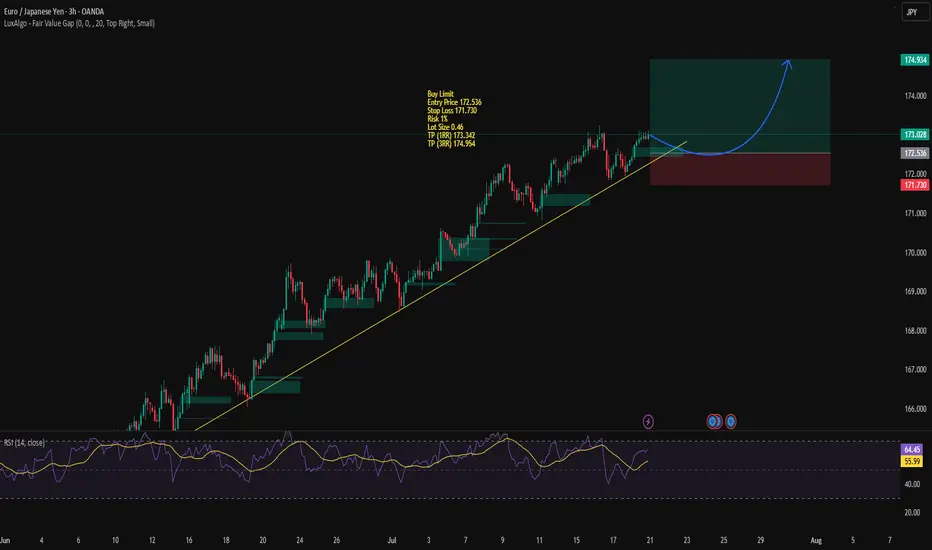
EURJPY in Uptrend ContinuationBuy Limit
Entry Price 172.536
Stop Loss 171.730
Risk 1%
Lot Size 0.46
TP (1RR) 173.342
TP (3RR) 174.954
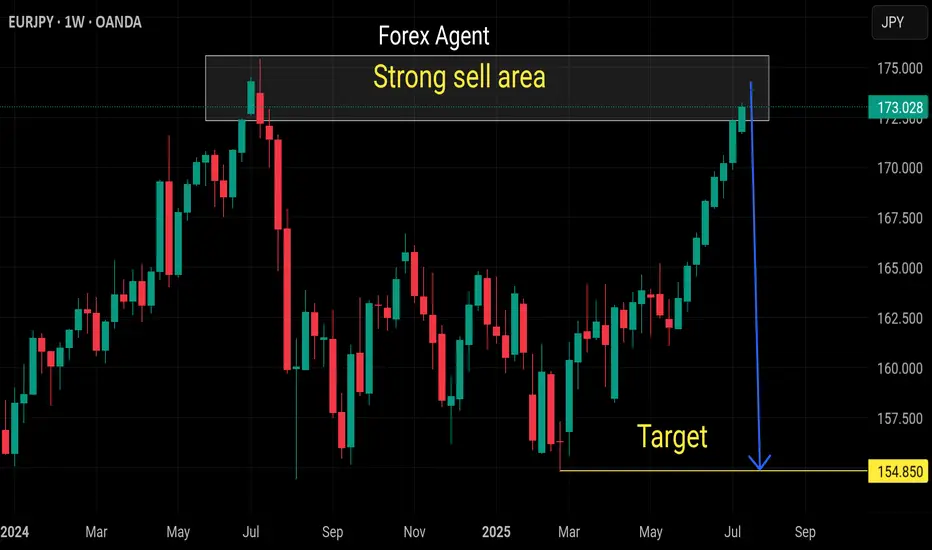
Selling eurjpyStrong sell coming in next weeks
Already 8 consecutive weekly buy candels
Now strong bearish correction expected
Weekly too overbought pair
Strong selling area reached
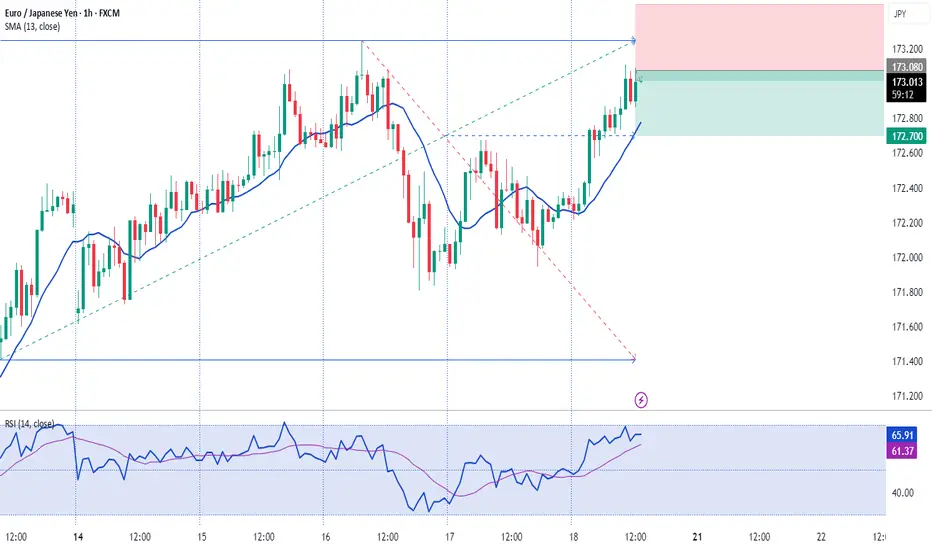
EUR/JPY – Double Top with RSI Divergence (Bearish Setup)Technical Analysis (Short Trade Idea)
EUR/JPY is forming a textbook double top pattern with notable bearish signals:
First top: 173.242
S econd top: 173.111 (lower high, indicating weakening bullish pressure)
Neckline: 171.650 – key support level, potential breakdown trigger
RSI divergence: Bearish divergence observed as RSI prints lower highs while price forms nearly equal tops, signaling momentum loss
This structure suggests a potential reversal from recent highs. A short opportunity may arise if price breaks below the neckline at 171.650 with confirmation.
Trade Setup
Sell Stop: 171.650
Stop Loss: 173.148
Take Profit 1: 170.180
Take Profit 2: 168.642

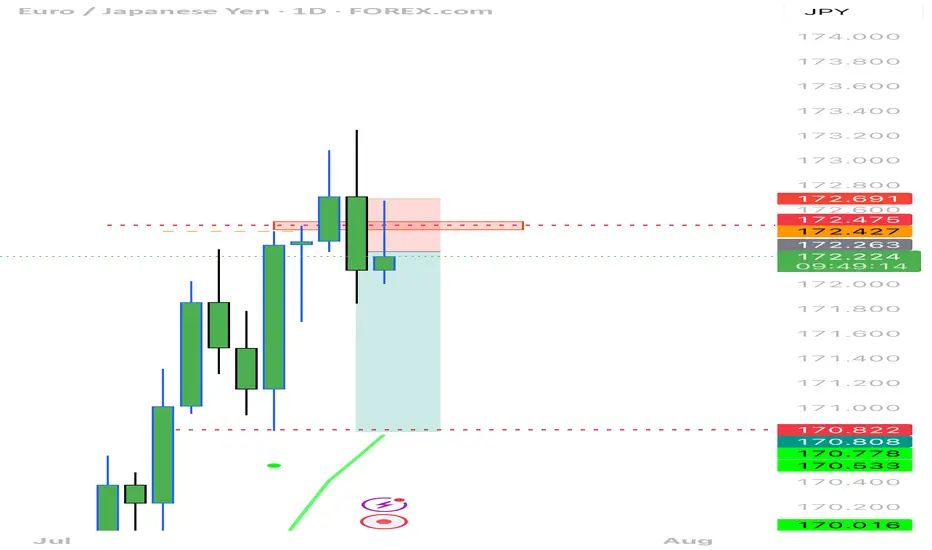
EURJPY Hits Major Weekly Supply | Is the Bull Run Over?EUR/JPY – Institutional Macro Context (COT)
EUR (Euro)
Non-commercials net longs increased by +16,146 → strong buying.
Commercials added +25,799 long positions.
✅ Bias: Moderately bullish.
JPY (Japanese Yen)
Non-commercials decreased longs by -4,432.
Commercials cut -20,405 long contracts.
❌ Bias: Bearish pressure remains on JPY.
Conclusion (COT): EUR remains fundamentally strong, JPY structurally weak. Institutional flows favor long EUR/JPY, but positioning is stretched.
Seasonality (July)
EURJPY shows strong bullish seasonality in July, especially over the 2Y and 5Y averages (+1.03% and +0.66% respectively).
✅ Seasonality bias: Bullish.
Retail Sentiment
89% of traders are short on EUR/JPY.
Contrarian bias = bullish confirmation.
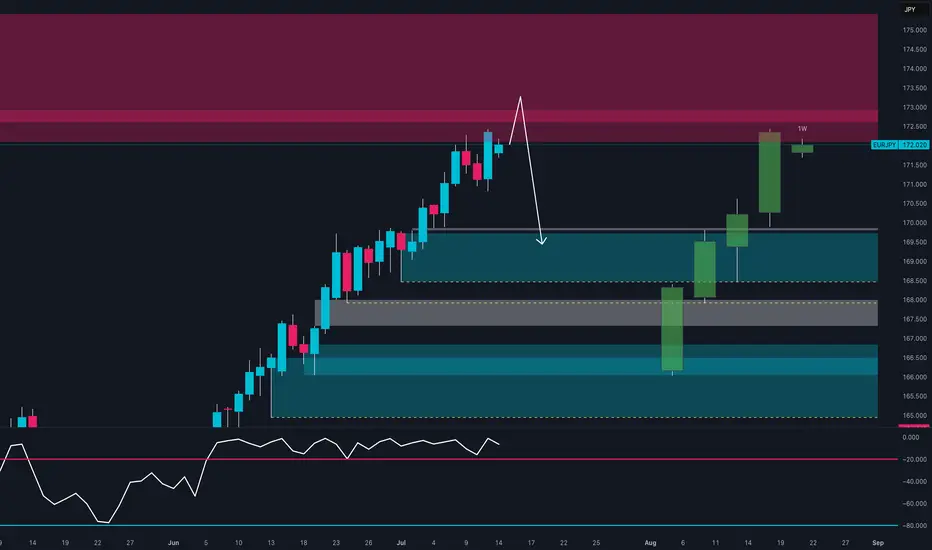
Technical Analysis (Weekly View)
Price is pushing into a major weekly supply zone around 172.50–173.00.
RSI still elevated but showing signs of weakening momentum.
Potential double top structure forming in confluence with liquidity grab.
First downside target sits around 169.50 (daily demand zone).
Awaiting a reaction in supply and confirmation for short.
Trading Plan (Top-Down)
Wait for price to reject the 172.50–173.00 area
Watch for bearish confirmation on Daily (engulfing or lower high)
Target: 169.50 zone
Risk: tight above 173.20 (invalidating supply zone)
EURJPY – WEEKLY FORECAST Q3 | W30 | Y25📊 EURJPY – WEEKLY FORECAST
Q3 | W30 | Y25
Weekly Forecast 🔍📅
Here’s a short diagnosis of the current chart setup 🧠📈
Higher time frame order blocks have been identified — these are our patient points of interest 🎯🧭.
It’s crucial to wait for a confirmed break of structure 🧱✅ before forming a directional bias.
This keeps us disciplined and aligned with what price action is truly telling us.
📈 Risk Management Protocols
🔑 Core principles:
Max 1% risk per trade
Only execute at pre-identified levels
Use alerts, not emotion
Stick to your RR plan — minimum 1:2
🧠 You’re not paid for how many trades you take, you’re paid for how well you manage risk.
🧠 Weekly FRGNT Insight
"Trade what the market gives, not what your ego wants."
Stay mechanical. Stay focused. Let the probabilities work.
FRGNT FOREX ANALYSIS 📊

Potential BEARSOn a 1D TF, looks like we having a wedge/ending diagonal after a long bullish trade. On a 1H TF, we're having a bearish BAT Pattern which On completion will result into breaking out of the wedge. So we're looking to go down for more oil 🛢 .
EurjpyThe price has reached an important level and I think we can go back down to the specified targets.

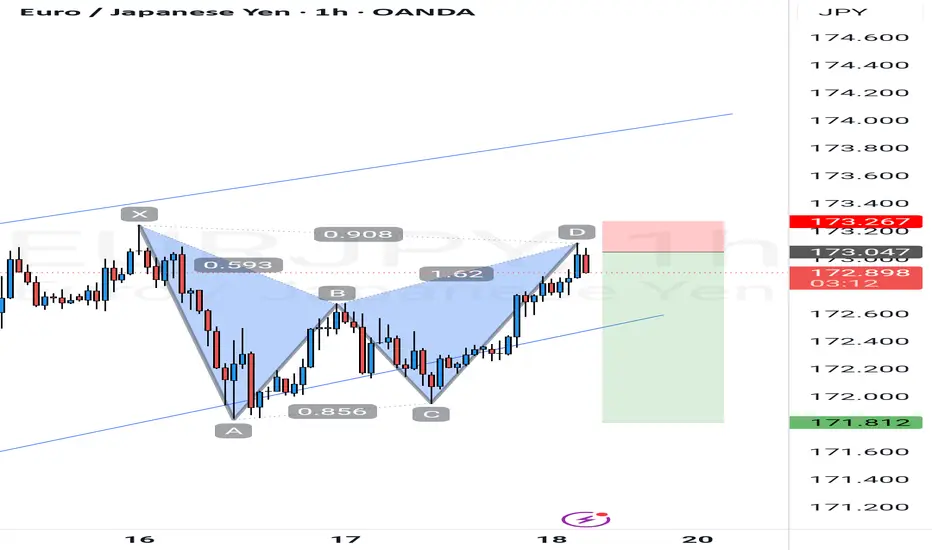
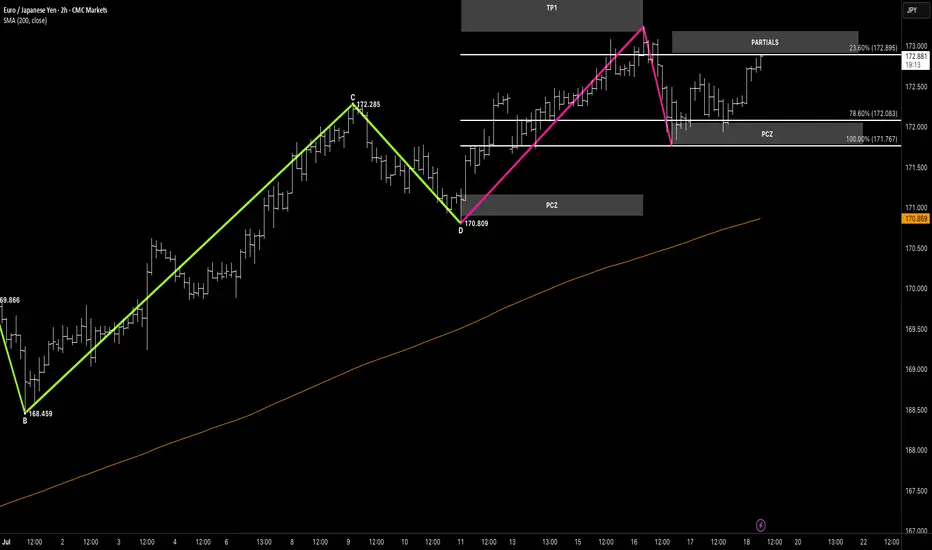
EURJPY / Euro – Japanese Yen (2H) – Bullish Structure Rebuilding
Hello awesome traders! 👋
Wrapping up the week with one more setup review — this one’s moving step by step, and now testing a critical level. Let's break it down.
📌 Pattern Breakdown
We had a clean multi-leg impulse and harmonic rotation:
🔹 D-leg reversal formed at 170.809, right inside the PCZ
🔹 Strong rally into the 23.6% fib zone (172.895)
🔹 Partial profits were taken at that first resistance
🔹 Price is now testing that same level as resistance turned support (R→S)
This is the decision point — a confirmed hold above 172.89 signals potential continuation toward TP1.
🎯 Targets Ahead
📍 TP1 Zone:
• 78.6% = 173.694
• 100% = 174.215
💡 But first — 23.6% is the gate. If it holds as new support, momentum should carry this back into the higher fibs.
🧠 What to Watch
✅ Structure respected from PCZ
✅ Partial taken on first reaction
🟡 Now watching reaction at 23% for direction:
• 🔼 Break + hold → continuation toward TP1
• 🔽 Failure + breakdown → reversion back into PCZ
🗝 Final Thoughts
This is how measured setups evolve — from structure → to reaction → to resolution.
You’ve got the edge — now it’s about letting price show the hand.
“The 23% isn’t just a pullback — it’s a pressure point. Hold it, and the next move builds.”
EURJPY ANALYSISAfter seeing that the previous daily candle could not trade below the moving averages and had a retracement to the upside it will be a good idea to wait and see how the pair trades before executing in a specific direction

EURJPY Short Swing TradeOANDA:EURJPY Short trade, with my back testing of this strategy, it hits multiple possible take profits, manage your position accordingly.
This is good trade, don't overload your risk like greedy, be disciplined trader, this is good trade.
Use proper risk management
Looks like good trade.
Lets monitor.
Use proper risk management.
Disclaimer: only idea, not advice
EURJPYEUR/JPY is in a clear downtrend, and the marked zone is the best area for selling.
Dear friends, always trade with the trend
"Three Drives" And EURJPY Bulls Could Be Out!!OANDA:EURJPY has potentially been forming quite a rare Reversal Pattern, the Three Drives Pattern, after making a Bullish Breakout of the Triangle, lets break it down!
Three Drive Patterns are very similar to ABCD patterns except for one thing, a Retracement instead of a Reversal after the CD Leg is finished!
In the CD Leg, Price creates quite a Trading Volume Gap between 172.1 - 171.8 and after Price declines from Point D (normally a Short Opportunity on an ABCD Pattern), Price actually makes a 61.8% Retracement of CD, creating Point E in that very Price Range and moves up, which "drives" a strong case that we potentially could be looking at a Three Drive Pattern!
Now that we have Point E, we can use the Fibonacci Retracement Tool to help give us an idea on where the Extension of the EF Leg could potentially end and the Fibonacci Levels suspected are:
123.6% --> 173.585
138.2% --> 173.795
161.8% --> 174.134
Once Price has made an Extension, shows Reaction, and moves Down from these levels; this could generate a great Short Opportunity!

EURJPY Is Going Up! Long!
Here is our detailed technical review for EURJPY.
Time Frame: 7h
Current Trend: Bullish
Sentiment: Oversold (based on 7-period RSI)
Forecast: Bullish
The market is approaching a significant support area 172.355.
The underlined horizontal cluster clearly indicates a highly probable bullish movement with target 174.222 level.
P.S
Please, note that an oversold/overbought condition can last for a long time, and therefore being oversold/overbought doesn't mean a price rally will come soon, or at all.
Disclosure: I am part of Trade Nation's Influencer program and receive a monthly fee for using their TradingView charts in my analysis.
Like and subscribe and comment my ideas if you enjoy them!
