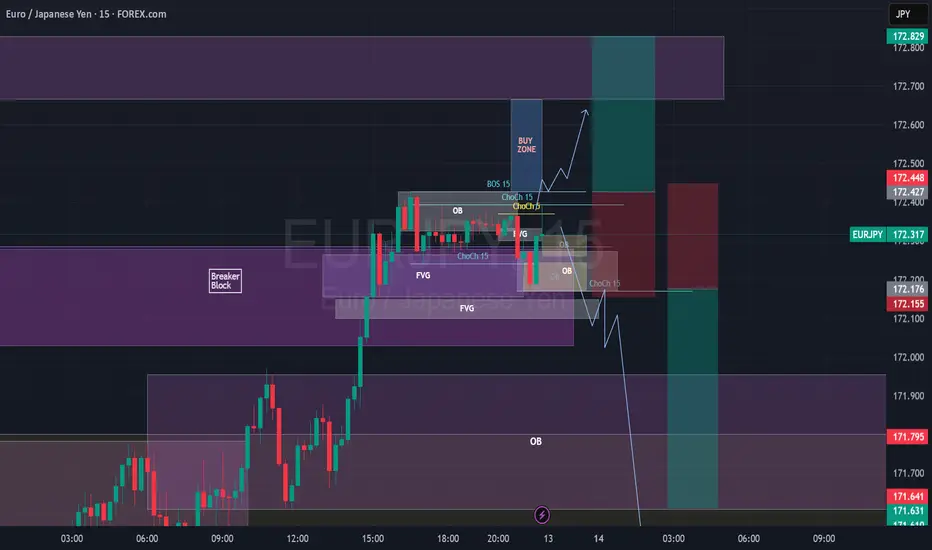
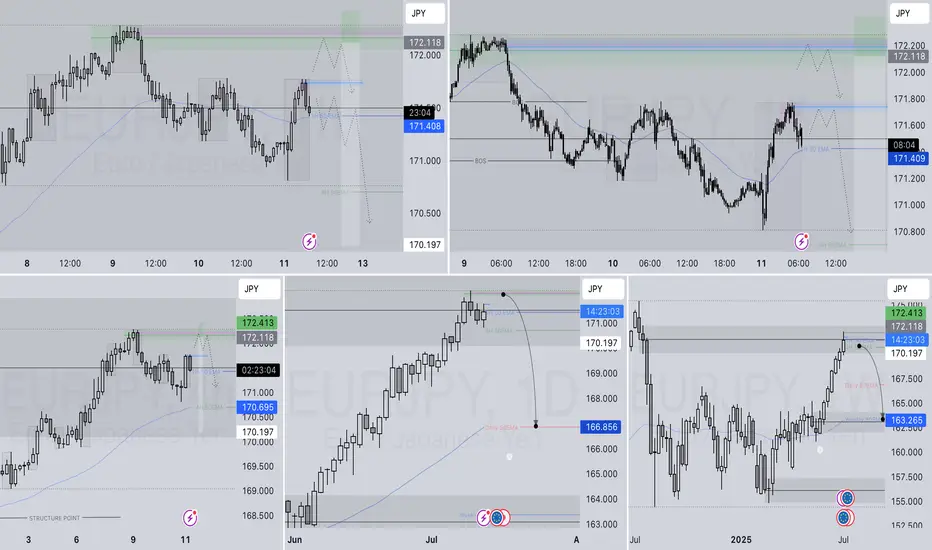
EURJPY Break of Structure, Retest and Fly5m - Monthly timeframes Bullish.
Price body candle closed and retested a 1H BB on 1H Timeframe.
Also retesting a 5M Bullish OB.
I want to wait for price to body candle close above the 15m BoS, create 3m/5m ChoCh, retest and look for Buys towards 172.665 (at the 1H OB or potentially 172.829, top of the 1H OB. SL under the 15m ChoCh.
EURJPY trade ideas
EURJPY–trend continuation, engulfing candle .. the week of 14/07Friday’s candle engulfed 2 previous days of price action. I interpret this as strongly bullish, especially since this happened in an already nicely bullish trend. However, the room to the upside it not unlimited - the ATH is at 175.421. We are likely to see sideways price action there due to some profit taking and maybe even some selling. IMO there are 2 possible options to get a 2R return:
- we may get a pullback before the bullish trend resumes.
- we drop down to the H1 chart and look for an opportunity to go long.
Either way, in my opinion, the trade should be closed before the ATH.
This is not a trade recommendation; it’s merely my own analysis. Trading carries a high level of risk so carefully managing your capital and risk is important. If you like my idea, please give a “boost” and follow me to get even more.

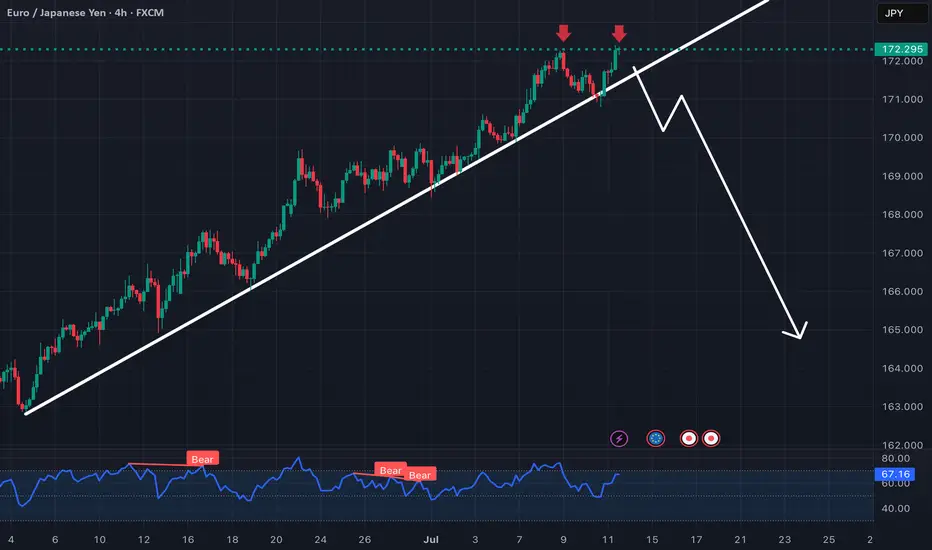
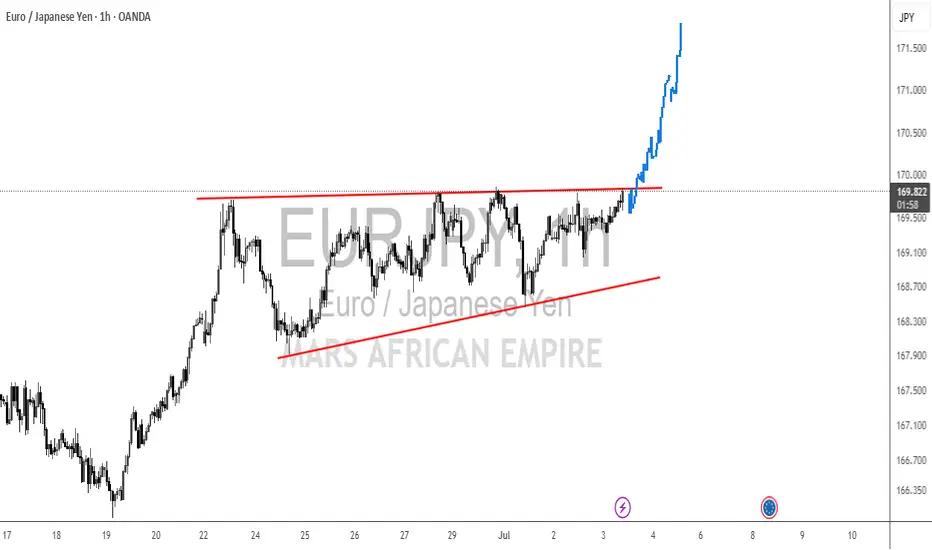
Potential Short Opportunity on EURJPYReasons I think this pair will fall:
- Confirmed Trend line means harder break out.
- RSI was overbought on the 4H time frame
- Potential double top
What do you think?
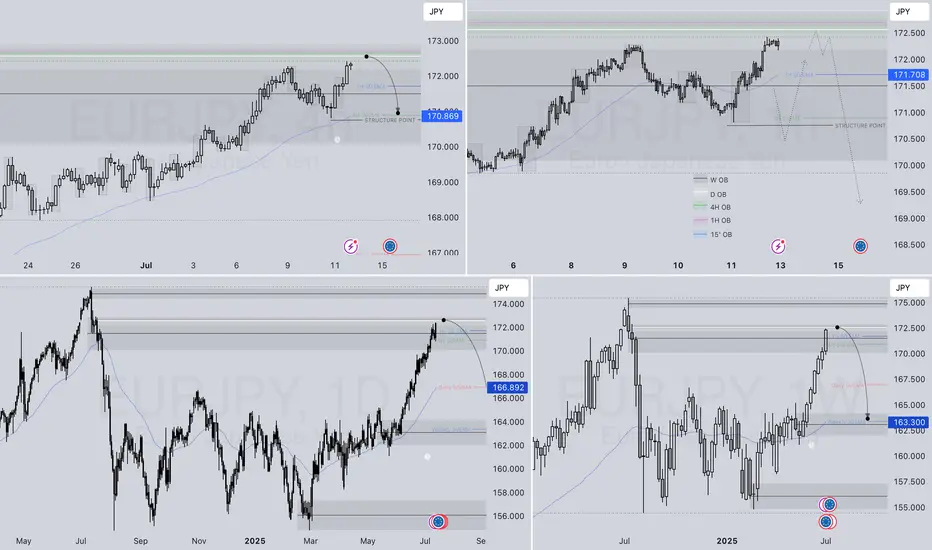
EURJPY SHORT – WEEKLY FORECAST Q3 | W29 | Y25💼 EURJPY SHORT – WEEKLY FORECAST
Q3 | W29 | Y25
📊 MARKET STRUCTURE SNAPSHOT
EURJPY is currently reacting from a key higher time frame supply zone, with price action showing weakness at premium levels. Structure and momentum are now aligning for a short opportunity backed by multi-timeframe confluence.
🔍 Confluences to Watch 📝
✅ Daily Order Block (OB)
Strong reaction and early signs of distribution.
Previous bullish momentum is losing steam; structure is flattening with rejection wicks forming.
✅ 4H Order Block
Break of internal structure (iBoS) confirms a short-term bearish transition.
✅ 1H Order Block
1H structure shift bearish
📈 Risk Management Protocols
🔑 Core principles:
Max 1% risk per trade
Only execute at pre-identified levels
Use alerts, not emotion
Stick to your RR plan — minimum 1:2
🧠 You’re not paid for how many trades you take, you’re paid for how well you manage risk.
🧠 Weekly FRGNT Insight
"Trade what the market gives, not what your ego wants."
Stay mechanical. Stay focused. Let the probabilities work.
🏁 Final Thoughts from FRGNT
📌 The structure is clear.
The confluences are stacked.
Let execution follow discipline, not emotion.
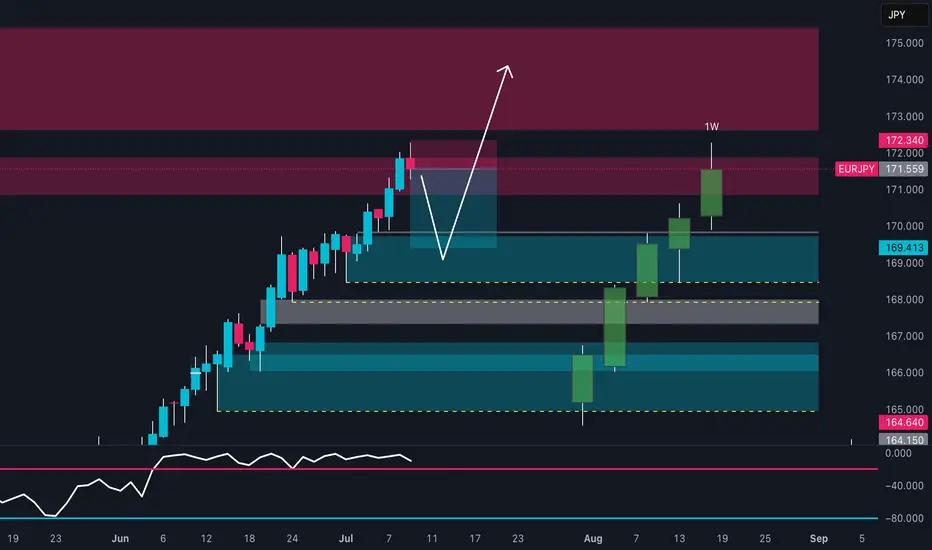
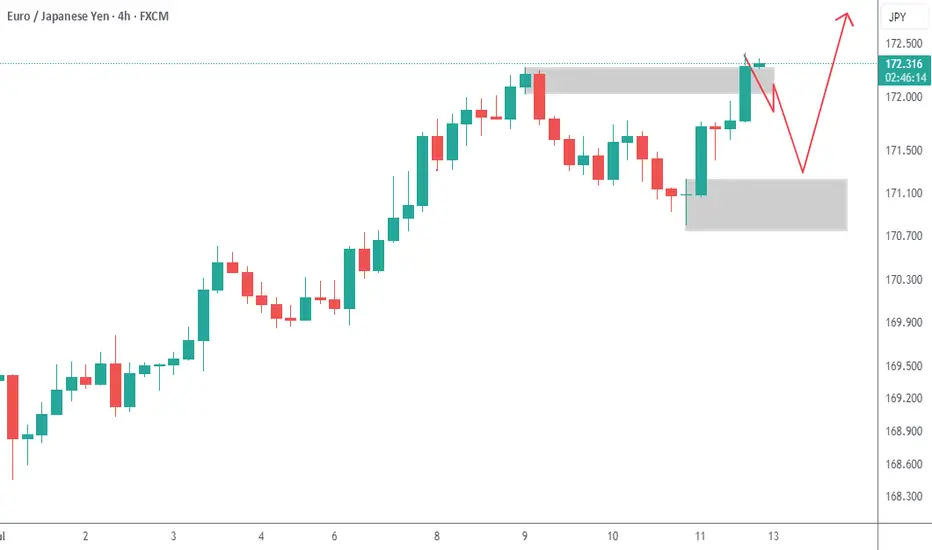
EURJPY Hits Supply | Pullback Is ComingPrice has entered the daily supply zone (red area) between 170.80 and 171.80, showing immediate rejection with a long upper wick — a signal of potential short-term bearish reaction.
The RSI is turning lower, indicating loss of momentum, although it hasn’t reached extreme levels yet.
The current map suggests a technical pullback toward the 169.40–168.50 zone (FVG + dynamic support) before any potential bullish continuation toward 174+.
The overall structure remains bullish, but a correction looks likely due to technical exhaustion and retail positioning.
📊 2. COT Report (JPY Futures – as of 2025-07-01)
Non-Commercials (speculators) reduced long positions on the JPY by -7,779 contracts, and also slightly trimmed shorts → clear sign of position reduction.
Net positioning remains strongly negative (JPY weakness), but it's starting to recover slightly.
Commercials added both longs (+2,830) and shorts (+5,977), indicating indecision but growing interest.
Open interest slightly decreased (–516), though it remains elevated.
👉 The market has not yet reversed, but the JPY downtrend may be approaching exhaustion.
🧠 3. Retail Sentiment
86% of retail traders are short EUR/JPY — a strong contrarian bullish signal.
Average retail short entry: 166.27, while current price is 171.55 → retail traders are trapped and under pressure.
A short squeeze is likely underway or already completed, increasing the risk of a technical correction after distribution.
📅 4. Seasonality
July is historically weak for EUR/JPY:
20Y: -0.35
15Y: -0.49
10Y: -0.18
August tends to be even worse from a seasonal perspective.
This supports the idea of a potential pullback in the coming days or weeks.
Trading Conclusion
Current Bias: Short-term Neutral–Bearish, Medium-term Bullish.
✳️ Potential pullback from 172.30 toward 169.40–168.50
🎯 If price holds and builds clean bullish structure, expect continuation toward 174.00–175.00
❌ Invalidation on daily close below 167.80
EURJPY Long Trade There is an order block that started the long ride up, the ride up broke the previous Higher high.
It is expected that it come back to retest the order block, if this happen it will give up opportunity to go long
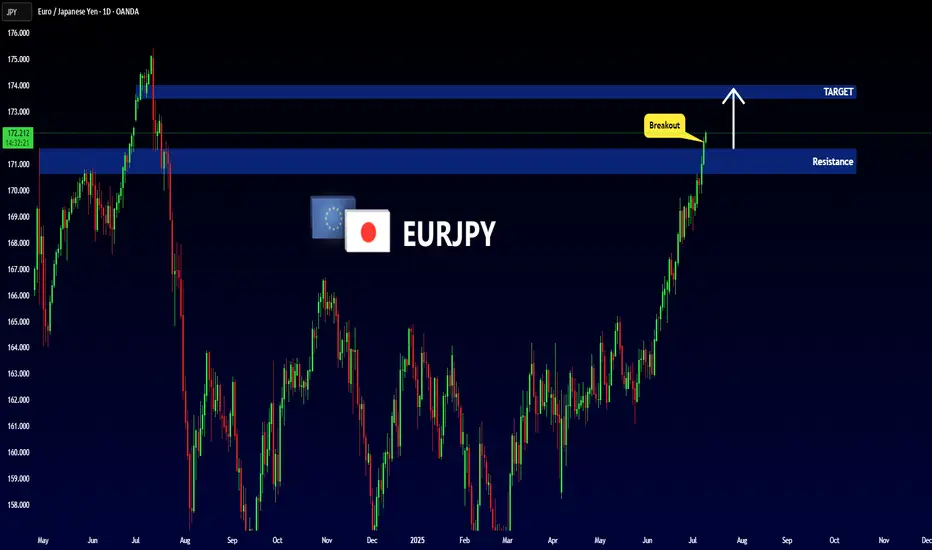
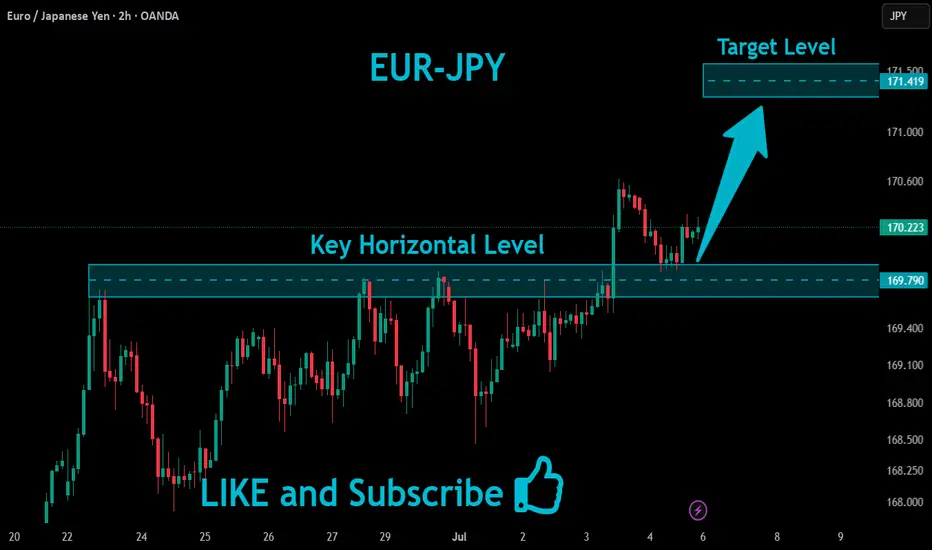
EURJPY - NEW BREAKOUT !Hello Traders !
After a huge bullish move,
The EURJPY broke the resistance level (170.639 - 171.605).
This key level becomes new support!
So, I expect a new bullish move🚀
_____________
TARGET: 173.530🎯
EUR-JPY Will Keep Growing! Buy!
Hello,Traders!
EUR-JPY is trading in an
Uptrend and the pair already
Made a bullish rebound from
The rising support so we are
Bullish biased and we will
Be expecting a further
Bullish move up
Buy!
Comment and subscribe to help us grow!
Check out other forecasts below too!
Disclosure: I am part of Trade Nation's Influencer program and receive a monthly fee for using their TradingView charts in my analysis.

ABCHello traders! Happy Friday — hope you're closing the week strong.
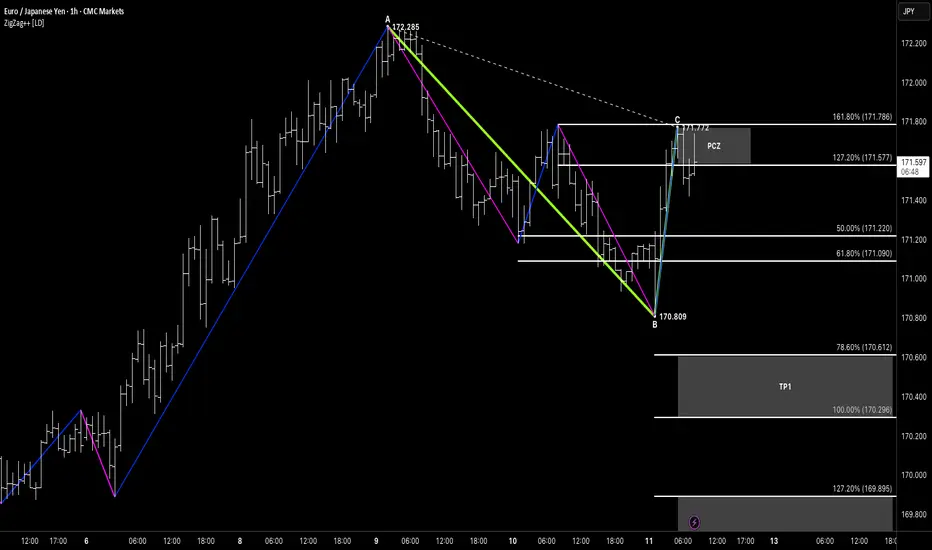
Let’s break down this clean ABC Bearish pattern on EURJPY from the 1H chart.
📍 Structure Breakdown
We’re looking at a sharp A to B decline followed by a corrective rally into point C.
Point C completes just under the previous swing high, creating a potential lower high setup.
Price has reacted from this level and is now pushing lower, confirming bearish momentum.
🎯 Target Zones
We’ve projected the AB leg from point C to define a measured move:
TP1: 170.29 (100%)
TP2: 169.89 (127.2%)
Final extension at 169.38 (161.8%) offers additional confluence
Note how the TP1 zone aligns with prior structure levels and the 78.6% extension — offering a clean reaction area.
🧠 Pattern Notes
ABC symmetry-based projection
Bearish impulse > corrective rally structure
Potential for deeper extension if TP1 breaks
Beautiful example of structure-followed geometry
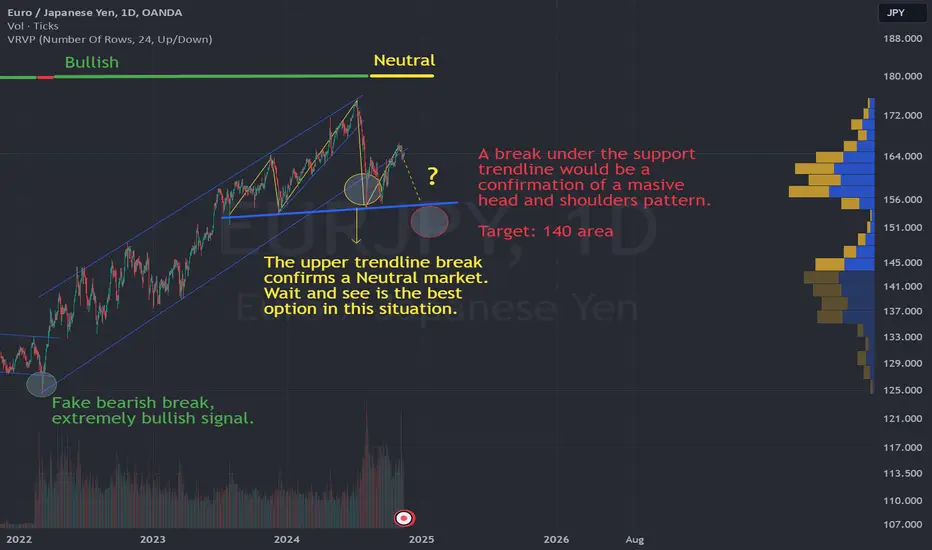
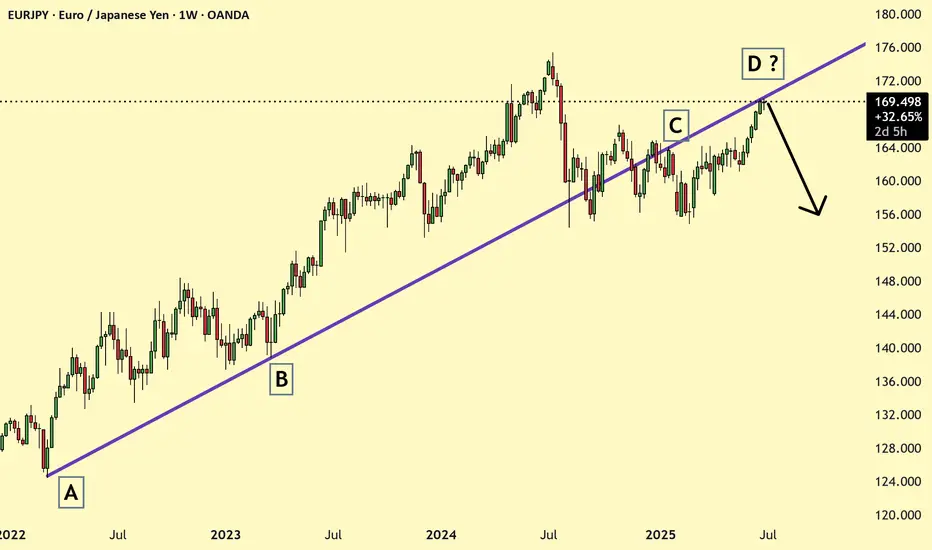
EUR/JPY ready to confirm the biggest trend change in many yearsEven though I post Chart patterns that have finished or are almost finished, let met share with you an unfolding pattern in EUR/JPY so you can easily follow it.
EUR/JPY has been rallying lately after a sharp decline this summer and this is forming a HEAD AND SHOULDERS pattern.
This kind of patterns work over 90% of the time and the returns in the first 20 days are usually over 10% with a minimal risk.
After the break of the previous bull trendline, EUR/JPY is in a neutral market so it's not time to short yet.
How to trade it?
The easiest way to trade it is by selling if the price breaks the blue support line, around the 158 area . This gives you the potential to move to 140 area, where:
1. You can win 8% in few days without leverage.
2. You just need to risk around 1,5% by using a tight stop loss.
So the profit will outweigh the risk by 5 times.
The risk management trick
Instead of investing everything in the previous idea, you could:
1. Invest 50% with a take profits at the 150 target. This is over 2% returns.
2. Keep investing 50% for an 8% return.
When the first TP occurs, you earn more than what you owe for the stop loss of the second position, meaning you have a now a sure trade whatever happens to the other 50%.
You keep risking 2% but you lock in profits as soon as the price touches 150.
EURJPY SHORT DAILY FORECAST Q3 D11 W28 Y25EURJPY SHORT DAILY FORECAST Q3 D11 W28 Y25
It’s Fun Coupon Friday! 💸🔥
Professional Risk Managers👋
Welcome back to another FRGNT chart update📈
Diving into some Forex setups using predominantly higher time frame order blocks alongside confirmation breaks of structure.
Let’s see what price action is telling us today! 👀
💡Here are some trade confluences📝
✅Daily Order block identified
✅4H Order Block identified
✅1H Order Block identified
🔑 Remember, to participate in trading comes always with a degree of risk, therefore as professional risk managers it remains vital that we stick to our risk management plan as well as our trading strategies.
📈The rest, we leave to the balance of probabilities.
💡Fail to plan. Plan to fail.
🏆It has always been that simple.
❤️Good luck with your trading journey, I shall see you at the very top.
🎯Trade consistent, FRGNT X
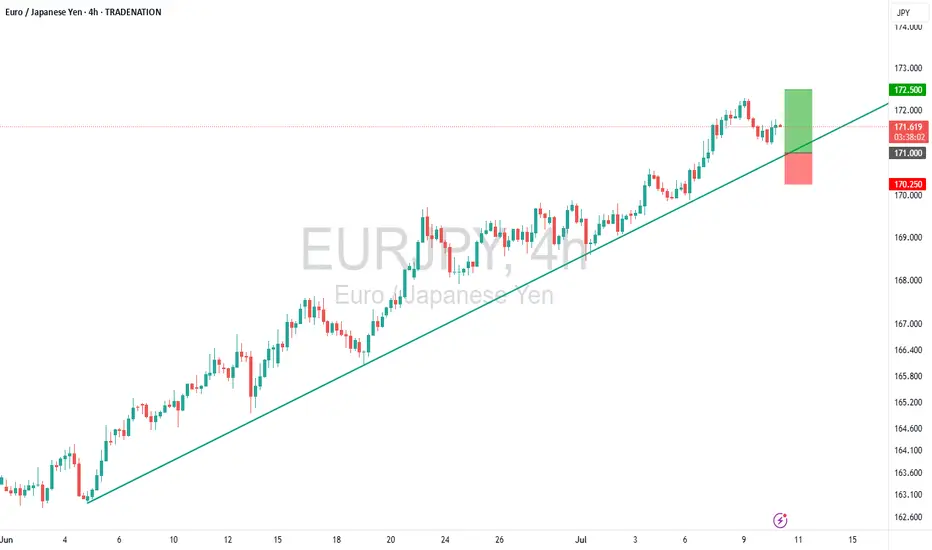
EURJPY – Buy the Dip in a Continuing UptrendTrade Idea
Type: Buy Limit
Entry: 171.00
Target: 172.50
Stop Loss: 170.25
Duration: Intraday
Expires: 11/07/2025 06:00
Technical Overview
The primary trend remains bullish, with no clear signs that the upward move is ending.
While a correction is possible, it is expected to be contained within the broader uptrend, providing an opportunity to buy at lower levels.
A move above 172.00 will confirm renewed bullish momentum, supporting a move toward 172.50, with a measured move target at 172.75.
Current levels do not offer a good risk/reward for immediate buying, so waiting for a dip to 171.00 is preferred.
No significant economic events are scheduled in the next 24 hours, keeping the focus on technical factors.
Key Technical Levels
Support: 172.00 / 171.50 / 171.00
Resistance: 172.00 / 172.50 / 172.75
Disclosure: I am part of Trade Nation's Influencer program and receive a monthly fee for using their TradingView charts in my analysis.

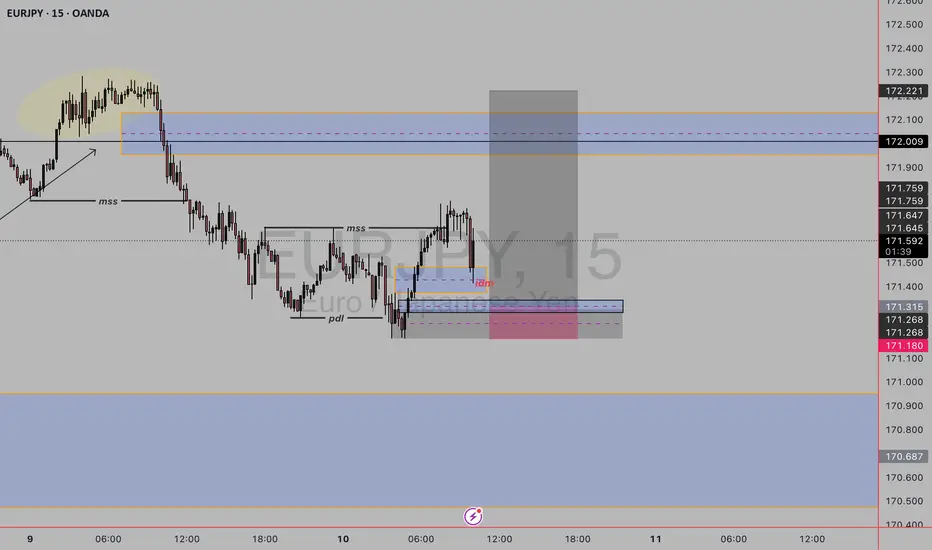
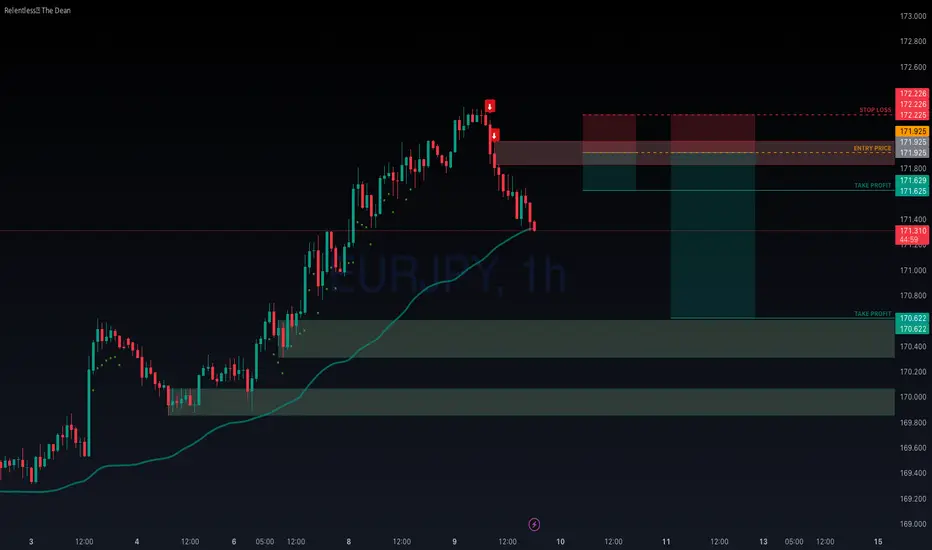
eurjpy buy setup Setup Breakdown:
1. Previous Downtrend and Market Structure Shift (MSS):
Price was in a clear downtrend, as seen on the left side.
A Market Structure Shift (MSS) is marked — this suggests the beginning of a potential bullish reversal.
After MSS, price makes a higher high and pulls back, indicating bullish interest.
2. Liquidity Grab Below Previous Day’s Low (PDL):
Price swept below the Previous Day's Low (PDL) and into a demand zone (blue and purple shaded box).
This is a classic liquidity hunt — smart money clears out stop losses below the PDL before reversing.
3. Refined Demand Zone (Entry):
Entry is planned at the refined demand zone, where price previously showed buying interest.
The entry (pink box) is within this zone, suggesting you’re anticipating a reaction there.
4. FVG (Fair Value Gap) Fill and Targeting Supply:
The target zone is marked in the grey box at the top, just below 172.221, likely a previous supply area or unmitigated order block.
The grey shaded area is a high reward zone, showing you expect a strong bullish move from demand into that supply.
5. Risk-to-Reward:
Stop loss just below the demand zone, likely under the liquidity sweep.
Take profit is around 2–3x the stop distance, targeting the premium/supply area.
✅ Why This is a Strong Buy Setup:
MSS confirmed (shift from bearish to bullish structure).
PDL sweep = liquidity grab → fuels bullish move.
Entry in refined demand aligned with price action logic.
Clear imbalanced area above → price may seek to fill inefficiencies.
High Risk-Reward with low drawdown potential if demand holds
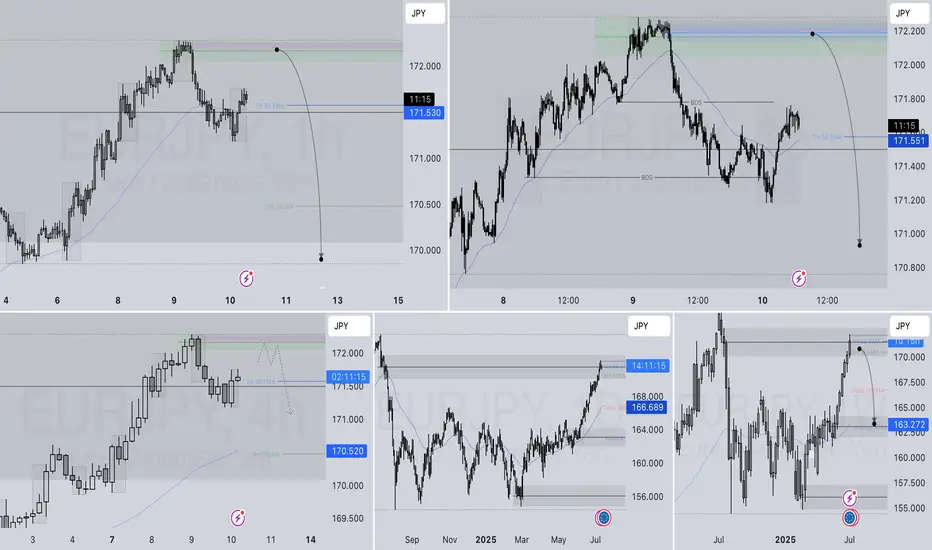
EURJPY SHORT DAILY FORECAST Q3 D10 W28 Y25EURJPY SHORT DAILY FORECAST Q3 D10 W28 Y25
Professional Risk Managers👋
Welcome back to another FRGNT chart update📈
Diving into some Forex setups using predominantly higher time frame order blocks alongside confirmation breaks of structure.
Let’s see what price action is telling us today! 👀
💡Here are some trade confluences📝
✅Daily Order block identified
✅4H Order Block identified
✅1H Order Block identified
🔑 Remember, to participate in trading comes always with a degree of risk, therefore as professional risk managers it remains vital that we stick to our risk management plan as well as our trading strategies.
📈The rest, we leave to the balance of probabilities.
💡Fail to plan. Plan to fail.
🏆It has always been that simple.
❤️Good luck with your trading journey, I shall see you at the very top.
🎯Trade consistent, FRGNT X
EURJPY Potential Sell ZoneI've set 2 pending limit orders here. One for the 1:1 RR and the other for a 1:4.3 RR. If the first trade holds we get a free shot at the 1:4 RR. NFA. Manage your risk accordingly. Sometimes I'll move to BE on trade 2 once we clear 1:2 RR.
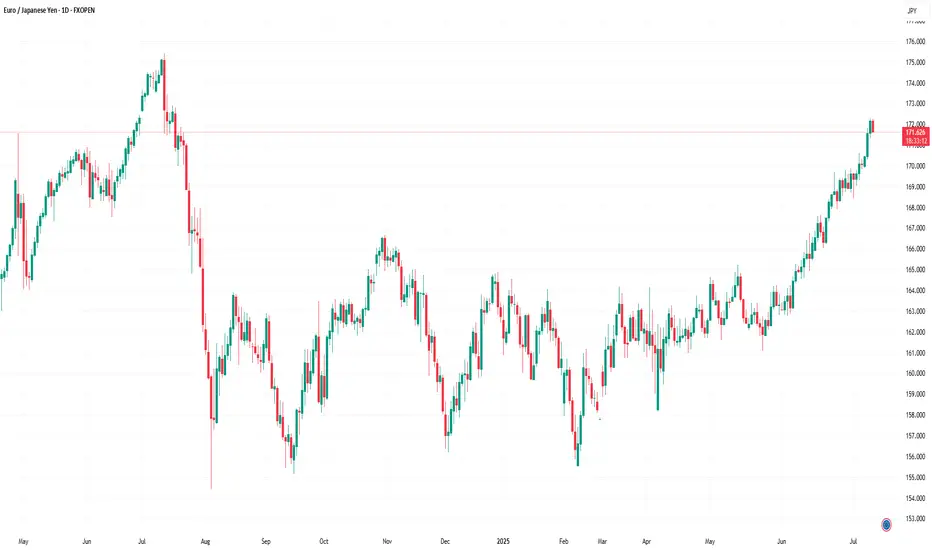
EUR/JPY Hits 12-Month HighEUR/JPY Hits 12-Month High
As the chart indicates, the EUR/JPY pair has risen above ¥172 per euro — a level last seen in July 2024.
Since early June, the exchange rate has increased by approximately 5.6%. This upward movement is driven by a combination of factors, including:
→ Divergence in central bank policy: The European Central Bank’s key interest rate remains significantly higher than that of the Bank of Japan, making the euro more attractive in terms of yield compared to the yen.
→ US trade tariffs on Japan: The potential imposition of 25% tariffs by the United States on Japanese goods poses a threat to Japan’s export-driven economy, placing downward pressure on the national currency.
→ Eurozone expansion and consolidation: News of Bulgaria’s potential accession to the euro area is strengthening investor confidence in the single currency.
→ Weakness in the US dollar: As the US Dollar Index fell to its lowest level since early 2022 this July, demand for the euro has grown, positioning it as a key alternative reserve currency.
Can the rally continue?
Technical Analysis of EUR/JPY
For several months, the pair traded within a range of approximately ¥156–165 per euro, but has recently broken above the upper boundary of this channel. Based on technical analysis, the width of the previous range implies a potential price target in the region of ¥174 per euro.
It is noteworthy that the rally gained momentum (as indicated by the arrow) following the breakout above the psychological threshold of 170, a sign of bullish market dominance. At the same time, the RSI has surged to a multi-month high, signalling moderate overbought conditions.
Under these circumstances, the market may be vulnerable to a short-term correction, potentially:
→ Towards the lower boundary of the ascending channel (shown in orange);
→ To retest the psychological support around ¥170.
That said, a reversal of the prevailing trend would likely require a significant shift in the fundamental backdrop — for example, progress towards a trade agreement between Japan and the United States.
This article represents the opinion of the Companies operating under the FXOpen brand only. It is not to be construed as an offer, solicitation, or recommendation with respect to products and services provided by the Companies operating under the FXOpen brand, nor is it to be considered financial advice.
EUR JPY has reached a resistance area and more likely to go downEURJPY has good rally recently and crossed fib 0.5 and now looks to be facing resistance at a trendline which was support earlier, on 4 hr chart look for breakout of this trendline and enter the trade.
EUR/JPY buy opportunity!!!Eurjpy provides us with a possible buy opportunity around 170.544 (pullback support) a retrace to that zone provides a potential buy opportunity. Keep a close a watch to take advantage of this opportunity
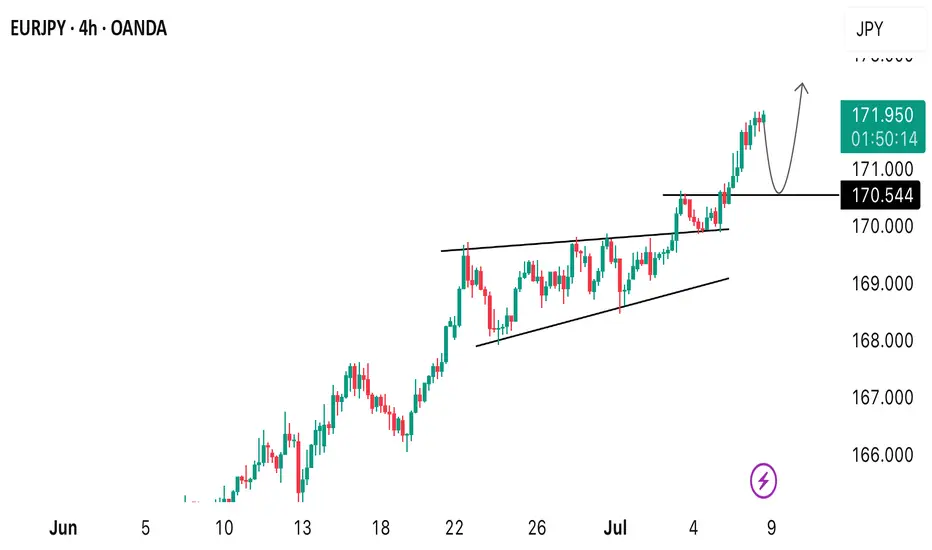
EURJPY Bullish Breakout!
HI,Traders !
#EURJPY is trading in an
Uptrend an the pair made a
Bullish breakout of the key
Horizontal level of 169.790
Which is confirmed so after
pullback we will
Be expecting a further
Bullish continuation !
Comment and subscribe to help us grow !
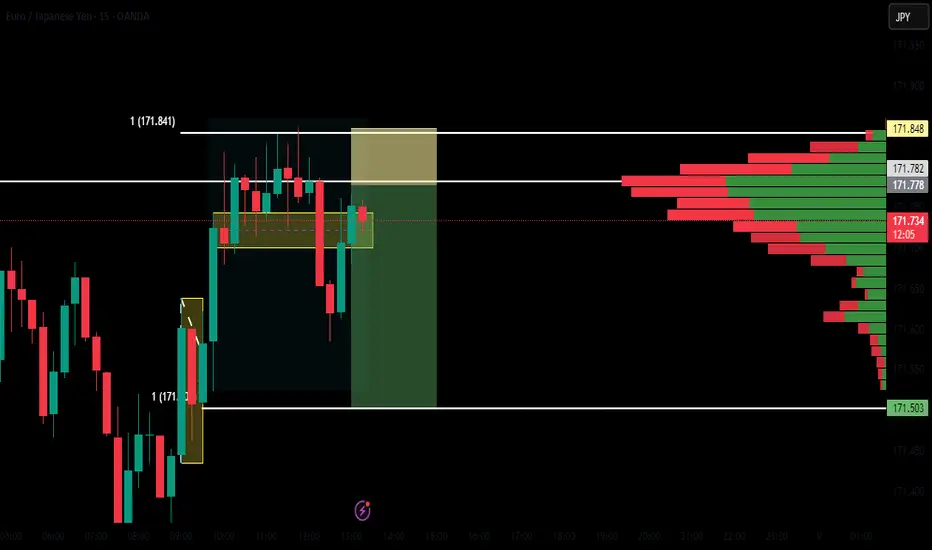
Bullish trade idea for EUR/JPYBullish trade idea for EUR/JPY:
Buy near 171.15
Take Profit at 171.78
Stop Loss below 171.10
Risk Management is important
