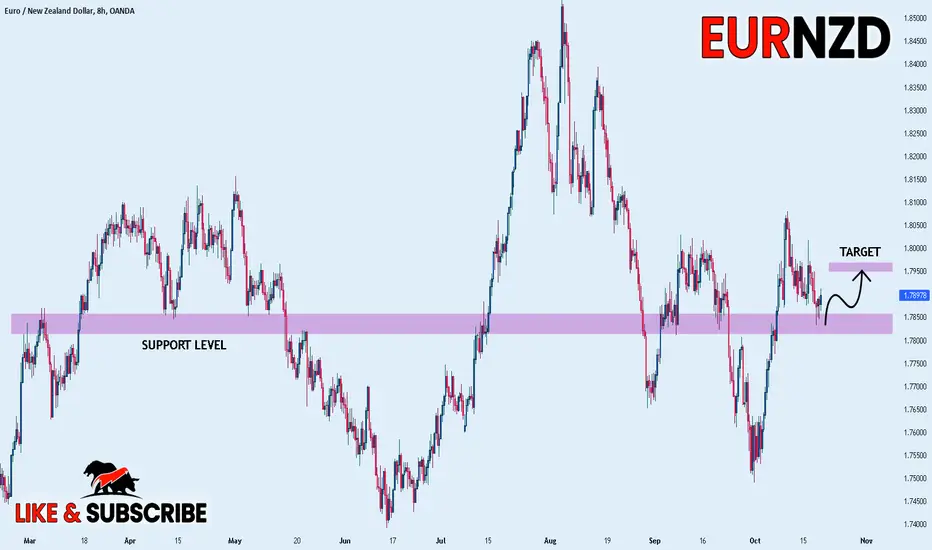
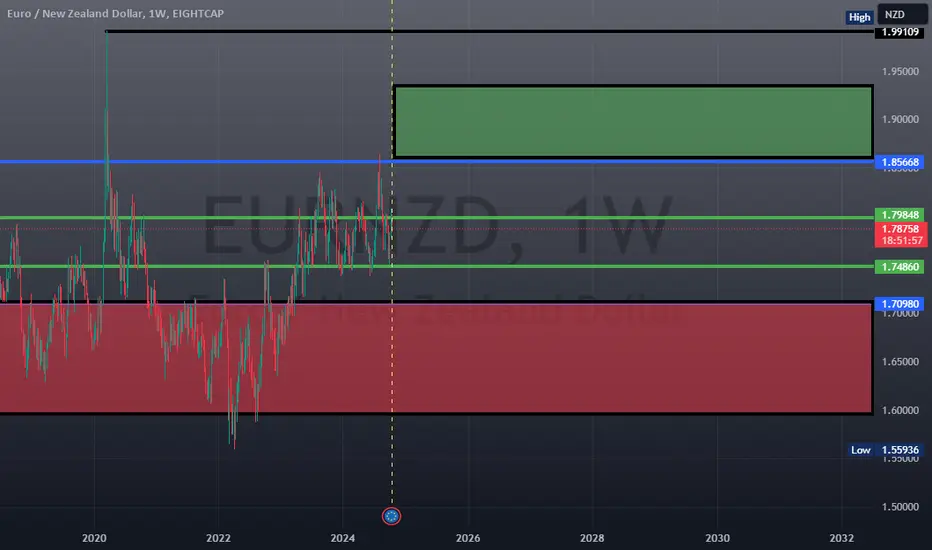
EURNZDEURNZD is in strong bullish trend.
As the market is consistently printing new HHs and HLs.
currently the market is retracing a bit after last HH, which is also the 50% Fib retracement level and local support as well. if the market successfully sustain this buying confluence the next leg up could go for new HH.
What you guys think of this idea?
EURNZD trade ideas

EURNZD 20/10/2024Weekly:
-Weekly highs.
-Bearish W pattern.
Daily:
-Bearish W pattern.
-H&S pattern.
4H:
-Bearish W pattern.
-H&S pattern.
-IC.
flag pattern setupi'm seeing a flag pattern, I'm eating for price action to go tap the demand zone at the bottom, when I get buy setup confirmation, I pull the trigger!!!
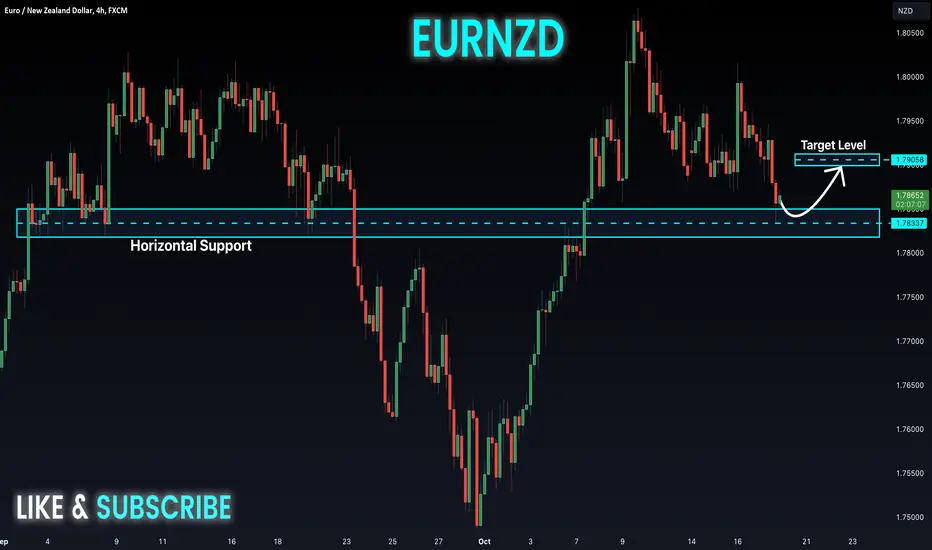
eurnzd buy signalIn this analysis, eurnzd is suitable for buying after crossing a downward channel and entering the downward channel and passing through a strong resistance and after pullback according to our analysis and with a risk of 1 to 8 reward.

EUR_NZD WILL GROW|LONG|
✅After the retest of the of horizontal support of 1.7850
It makes sense to expect a bullish correction
As EUR_NZD is oversold and the market players
Will be taking profit from the level
Fueling a buying wave
LONG🚀
✅Like and subscribe to never miss a new idea!✅
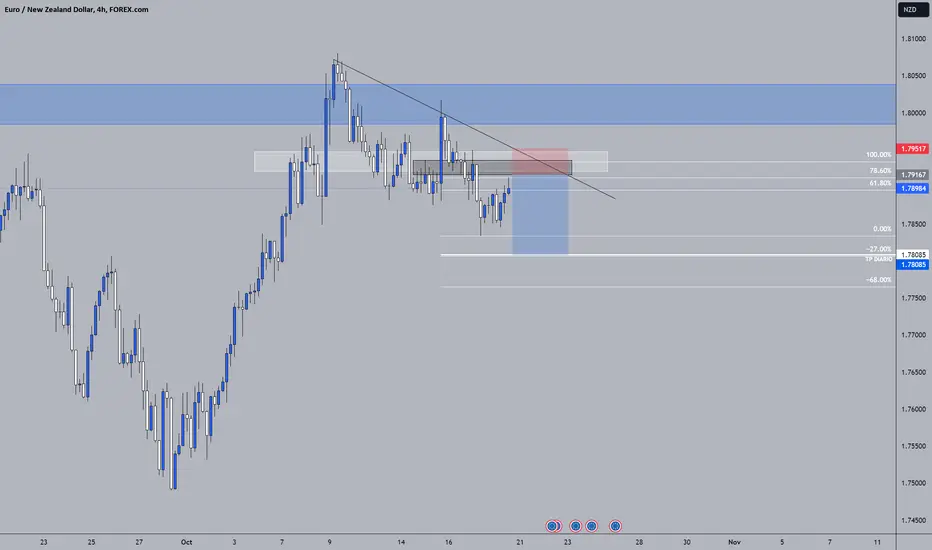
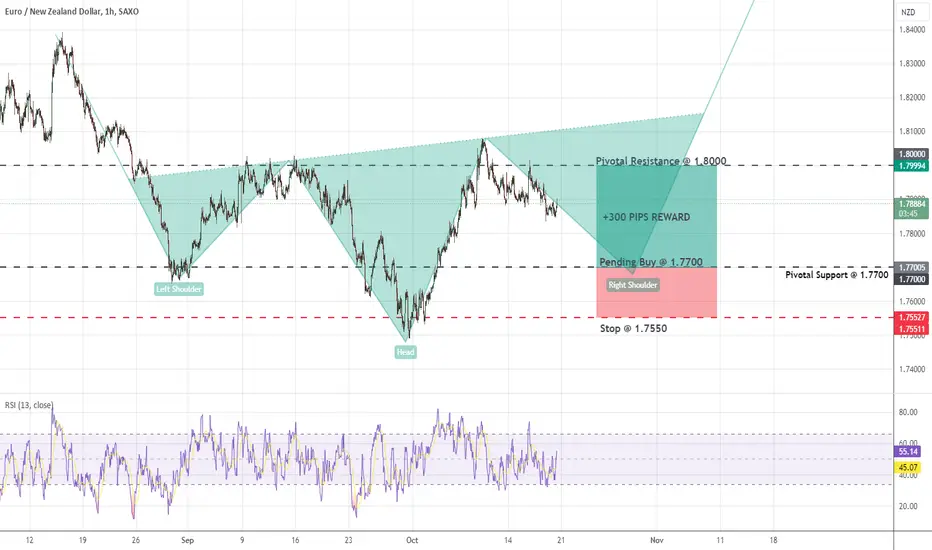
Buy idea on the EURNZD @ 1.7700I expect the NZD to weaken vs the EUR if price hits pivotal support at 1.7700. The target is Pivotal Resistance at 1.8000
If price moves above 1.8000 then I'll continue buying
18.10.24 Morning ForecastPairs on Watch -
FX:EURNZD
A short overview of the instruments I am looking at for today, multi-timeframe analysis down to what I will be looking at for an entry. Enjoy!

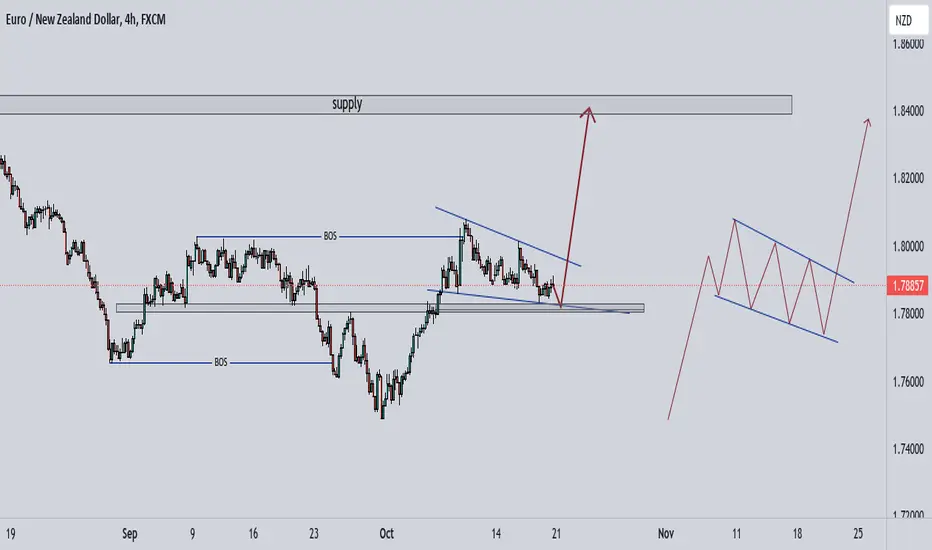
EURNZDTraders! This pair is impressing guys! We can see a bigger moves to the downside and one of the trades, that will be good for those who like to swing when we have the confirmation that we are waiting. I love the way structures are, everything has been confirmed so its the matter of waiting for the clear point to enter the market

EURUSD CHARTING IDEA W/ AMILIA
We're looking for the market to do a sell sweep, and then push back into a buy, so we're going to be looking at volatile buys and sharp bull engulfs.
We're going to use this chart to send out vault and team trades for the next 30 days and potentially plus, if it doesn't break out the demand era and our major resistance location.
2024-10-17
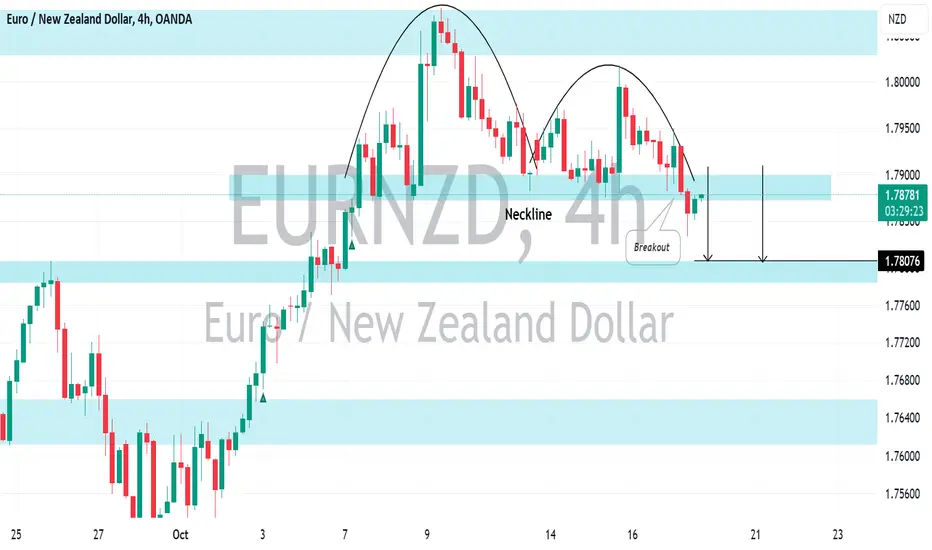
EURNZD: Time to Fall?!EURNZD has established a cup and handle pattern and has broken through its neckline on the 4-hour chart.
This breakout confirms a Change of Character (CHoCH) and indicates a potential bearish reversal in the near term.
The price is likely to decline, potentially reaching the support level at 1.7807.

EURNZD: Time to Fall?!EURNZD has successfully formed a cup & handle pattern and has broken through its neckline on the 4-hour time frame.
This violation confirms a Change of Character (CHoCH) and suggests a potential bearish reversal in the near term.
The price is expected to decrease and potentially reach the support level at 1.7807.
EUR-NZD Will Grow! Buy!
Hello,Traders!
EUR-NZD went down
To retest the horizontal
Support level of 1.7825
And after the retest
A local bullish rebound
Will be expected
Buy!
Like, comment and subscribe to help us grow!
Check out other forecasts below too!
EURNZD BUY signal. Don't forget about stop-loss.
Write in the comments all your questions and instruments analysis of which you want to see.
Friends, push the like button, write a comment, and share with your mates - that would be the best THANK YOU.
P.S. I personally will open entry if the price will show it according to my strategy.
Always make your analysis before a trade

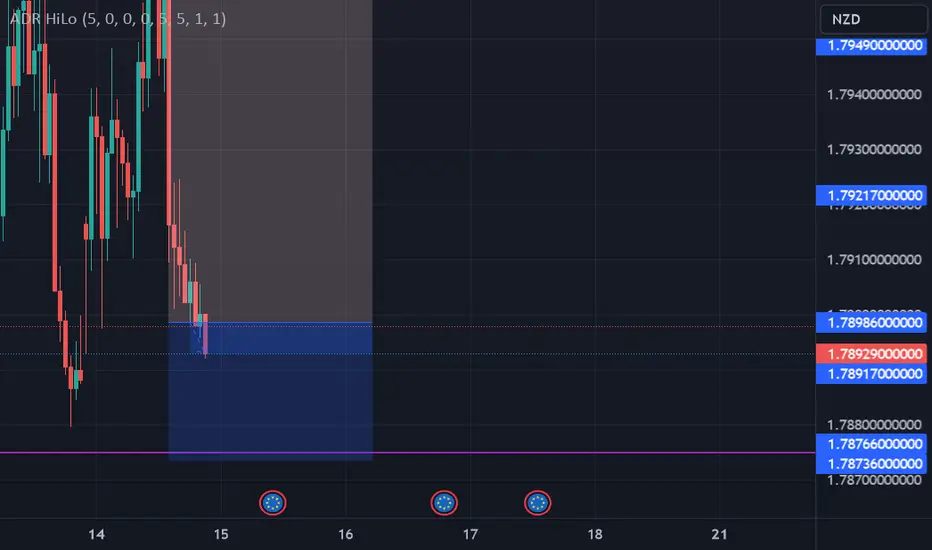
EurNzd expecting a reversal soonAt the moment market is choppy and it's hard to say what's a good place to sell,
Expecting a reversal anywhere in there are of 1.796 - 1.786,
Waiting for confirmations

EUR/NZD Pre ECB Rate DecisionEUR/NZD has fell tentatively on comments out the ECB.
Technical levels persist above and below, as drawn.

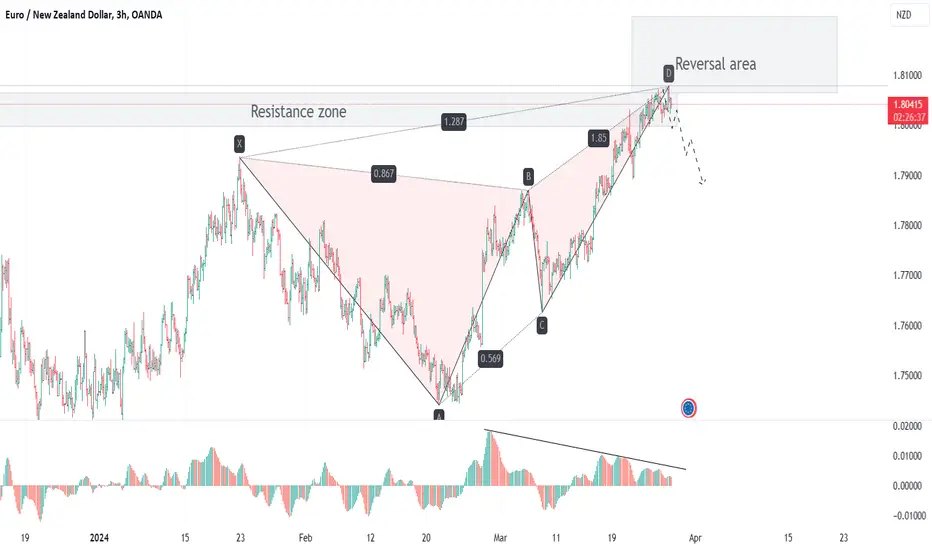
Technical Analysis: EURNZD Bearish ButterflyHello Traders,
Below is my Technical Analysis of EURNZD.
EURNZD has formed a bearish butterfly pattern with points X: 1.79369, A: 1.7442, B: 1.78702, C: 1.76273, D: 1.80786. The current price is 1.80379. Expectation for a drop to 1.78808 in the coming weeks. Additionally, a bearish divergence is noted on the Awesome Oscillator, indicating weakening bullish momentum.
Cheers and Happy Trading.
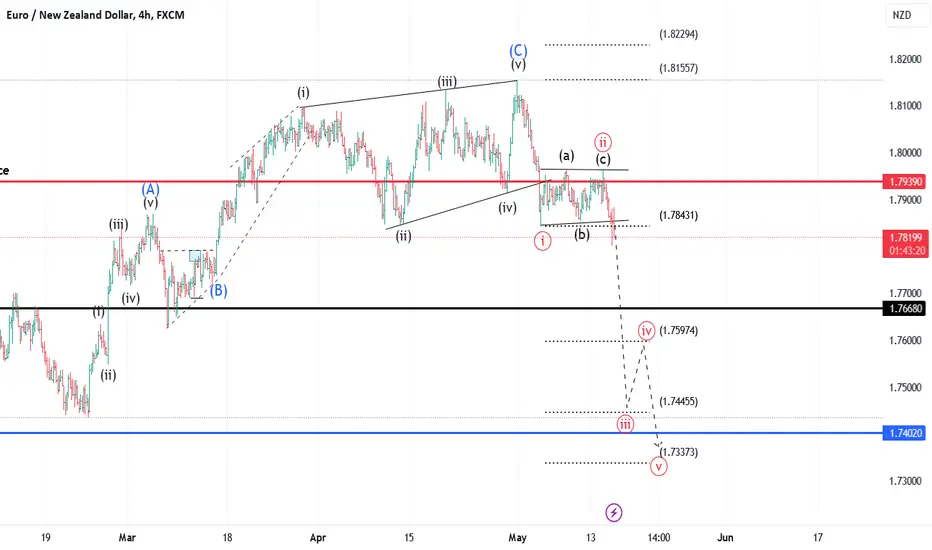
EURNZD: Preparing for a larger descentHello Traders,
We have an interesting setup on EURNZD. Between 23rd of Feb and 1st of May, we saw an upward move identified as a corrective wave ABC, with Wave C forming an ending diagonal. Recently, we saw a break of the ending diagonal pattern in wave C, setting the stage for a decline. The break of wave 1 to the downside further confirms our bearish outlook. As such I expect EURNZD to continue the downward movement.
However, if the price goes above 1.81557, my analysis of a drop will be invalid.
Cheers and happy trading!

EURNZD Structure Analysis Ahead of RBNZ Rate DecisionEURNZD Structure Analysis Ahead of RBNZ Rate Decision
In this video, I analyze the price behavior of EURNZD, considering past price developments and potential movements ahead of the Reserve Bank of New Zealand (RBNZ) interest rate decision on Wednesday, October 9.
The market anticipates that the RBNZ will cut rates by 50 basis points, from 5.25% to 4.75%.
You may watch the video for further details.
Thank you and Good Luck!

An idea on A Certain Pair has to be a swing tradeWe now wait for price to return back to our order block and tab 50% of it then we continue with the bullish moment to the weekly high note this is EURCAD

The EURNZD is bullish.The EURNZD has strong potential on the 15-minute chart to reach 1.803 and possibly higher targets but before that , this needs a good correction.
eurnzd bullish around 1200 pipsThe EUR/NZD currency pair has exhibited some bullish trends recently, but for a comprehensive bullish analysis, it’s important to consider multiple factors, such as technical analysis, macroeconomic fundamentals, and market sentiment. Here's an overview of what typically drives a bullish case for EUR/NZD:
1. Technical Analysis
Uptrend Continuation: If EUR/NZD is forming higher highs and higher lows on a daily or weekly chart, this is a signal of an ongoing uptrend. Key indicators to watch would include:
Moving Averages (50-day, 200-day): If the short-term moving averages are crossing above long-term moving averages (a “golden cross”), it signals bullish momentum.
Fibonacci Levels: Fibonacci retracement levels can help identify support and resistance areas for potential entry points.
RSI (Relative Strength Index): An RSI value below 70 but trending upwards could suggest that bullish momentum is building without being overbought.
MACD (Moving Average Convergence Divergence): A bullish crossover in the MACD line above the signal line is a strong confirmation of upside momentum.