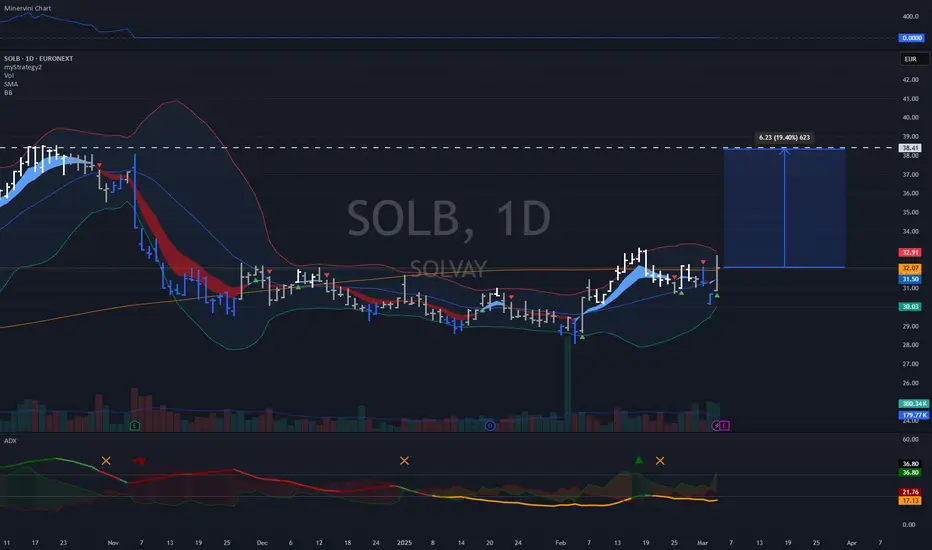
SOLB | Confirmed Descending Triangle Breakout – 32% Target📍 Ticker:
SOLB (Solvay SA – Euronext Brussels)
📆 Timeframe: 1D (Daily)
📉 Price: €30.14
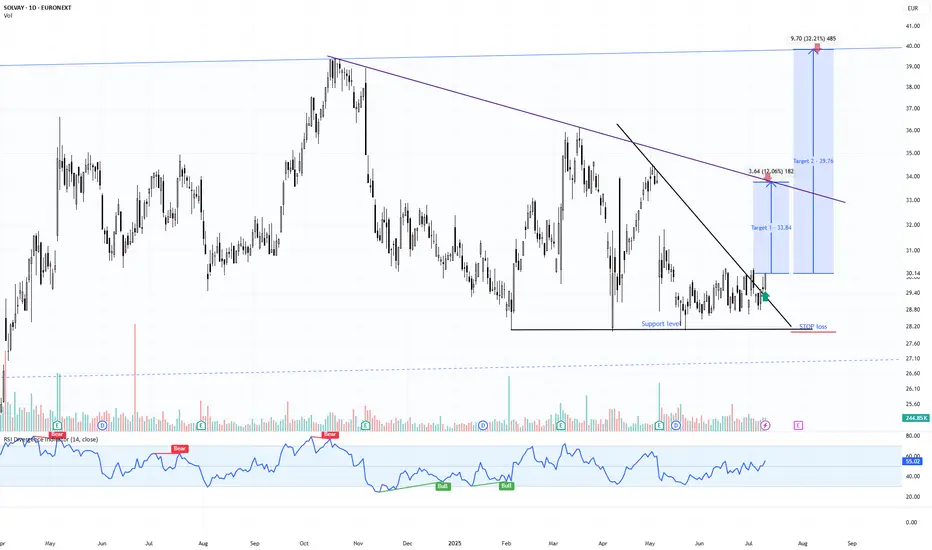
📈 Pattern: Descending triangle breakout confirmed on daily close
📊 Breakout Probability estimation: ~73% (short-term triangle breakout upward)
🔍 Technical Setup (Updated on Daily Chart):
Solvay has now confirmed the breakout on the daily timeframe, closing above both the horizontal support and the descending trendline. This marks a multi-timeframe confluence breakout, increasing confidence in the projected move toward upper resistance levels.
✅ Daily candle close above descending resistance
✅ RSI breakout above 55, building momentum
📉 Stop clearly defined under €27.90 → optimal risk profile
📊 Volume expanding, validating move
🧠 Updated Trade Plan:
📥 Entry Zone: €29.90–€30.50 (daily confirmation)
⛔ Stop-Loss: Below €27.90
🔁 Hold while structure remains above descending trendline support
🎯 Upside Targets & Potential Return (from €30.14)
🎯 Target Price Return
Target 1 €33.84 +12.06%
Target 2 €39.76 +32.21%
📊 Pattern Probability – Daily Structure:
📐 Pattern: Descending Triangle Breakout
🔺 Upward breakout probability: ~73%
🎯 Full measured move supports Target 2 if buyers remain active
⚠️ Technical Signals to Watch:
🔎 Retest of descending line on lower volume = strong
✅ RSI > 55 with bullish structure
📈 Rising volume → growing institutional interest
📊 Price reclaiming structure from broader daily consolidation
💬 Solvay is transitioning from a textbook 4H breakout to a multi-day continuation setup. The alignment of pattern, structure, and momentum makes this one of the cleaner swing setups on the European market right now.
🔔 Follow @TargetTraders for high-probability technical trades.
#SOLB #BreakoutSetup #DescendingTriangle #TechnicalPattern #SwingTrade #Euronext #TargetTraders #VolumeBreakout #ChartAnalysis
4SOLBM trade ideas
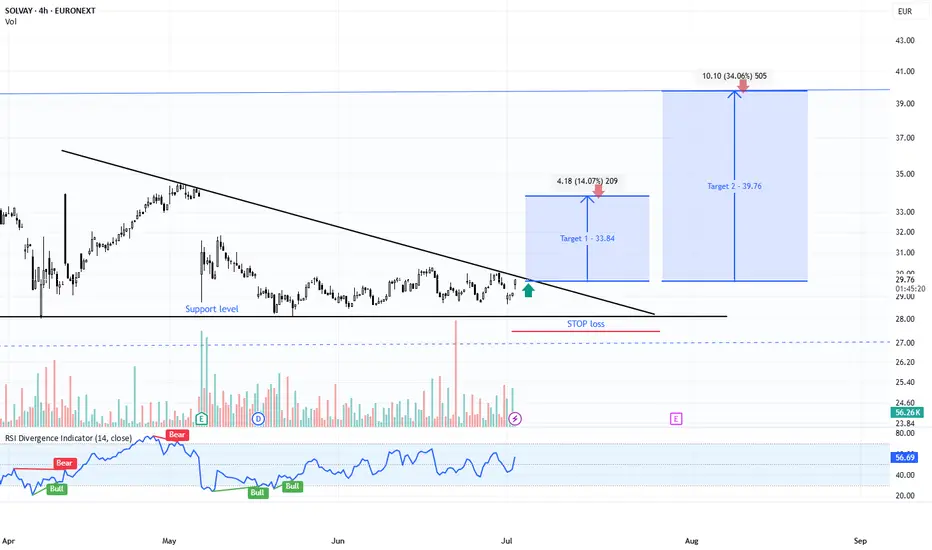
SOLB | Descending Triangle Breakout – Targeting +34% MoveTicker: EURONEXT:SOLB (Solvay SA – Euronext Brussels)
📆 Timeframe: 4H (4-hour)
📉 Price: €31.58
📈 Pattern: Descending triangle breakout from horizontal support
📊 Breakout Probability : ~73% upward breakout (short-term triangle)
🔍 Technical Setup:
SOLB has successfully broken above a descending resistance line, bouncing off a solid horizontal support level near €28.00. This forms a bullish descending triangle breakout – a structure that historically resolves upward in short- to mid-term timeframes.
✅ Confirmed breakout from descending triangle
🟢 RSI pushing above 56 = bullish short-term momentum
📉 Defined support below = favorable risk/reward
🧠 Trade Plan:
📥 Entry Zone: €31.40–€31.70 (post-breakout confirmation)
⛔ Stop-Loss: Below €27.90 (under support base and triangle invalidation)
🎯 Upside Targets & ROIC (from €31.58):
Target Price Return
🎯 Target 1 €33.84 +7.15%
🎯 Target 2 €39.76 +25.9%
📊 Pattern Probability – Based on Bulkowski:
📐 Pattern: Descending Triangle (short-term breakout)
🔺 Upward breakout probability: ~73%
💹 Measured move confirms Target 2 if volume remains elevated
⚠️ Technical Signals to Watch:
🔎 Strong green candle breaking the triangle → initial confirmation
✅ RSI breakout with no bearish divergence = supports continuation
📈 Volume spike = buyer interest returning
💬 Solvay’s breakout is a classic textbook move off strong horizontal support.
This is a high-probability swing setup with tight risk and excellent upside potential.
#SOLB #BreakoutSetup #DescendingTriangle #TechnicalPattern #SwingTrade #TargetTraders
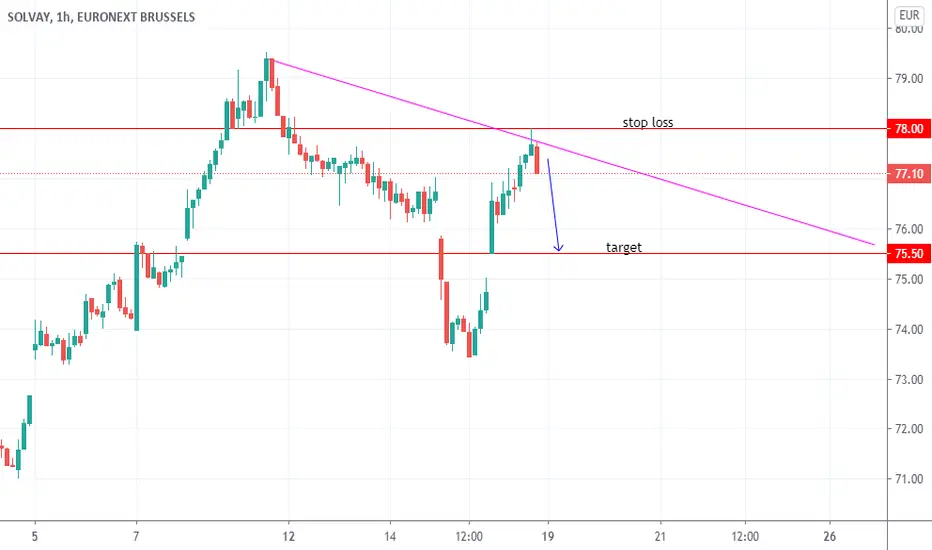
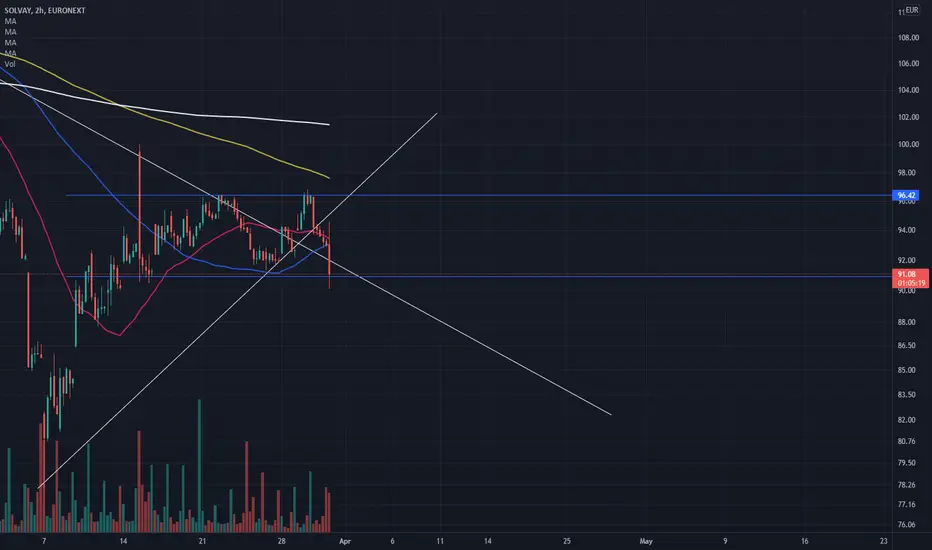
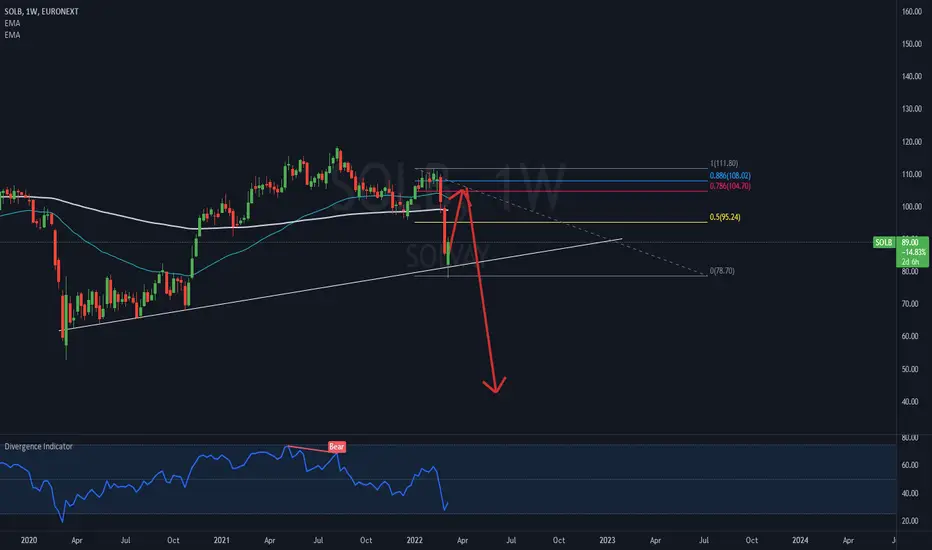
SOLVAY GOING DOWN??SOLVAY broke it's trading range with rising volume of the sellers.
Let's see where this take's us.
Solvay Europe Sun Storm Investment Trading Desk & NexGen Wealth Management Service Present's: SSITD & NexGen Portfolio of the Week Series
Focus: Worldwide
By Sun Storm Investment Research & NexGen Wealth Management Service
A Profit & Solutions Strategy & Research
Trading | Investment | Stocks | ETF | Mutual Funds | Crypto | Bonds | Options | Dividend | Futures |
USA | Canada | UK | Germany | France | Italy | Rest of Europe | Mexico | India
Disclaimer: Sun Storm Investment and NexGen are not registered financial advisors, so please do your own research before trading & investing anything. This is information is for only research purposes not for actual trading & investing decision.
#debadipb #profitsolutions
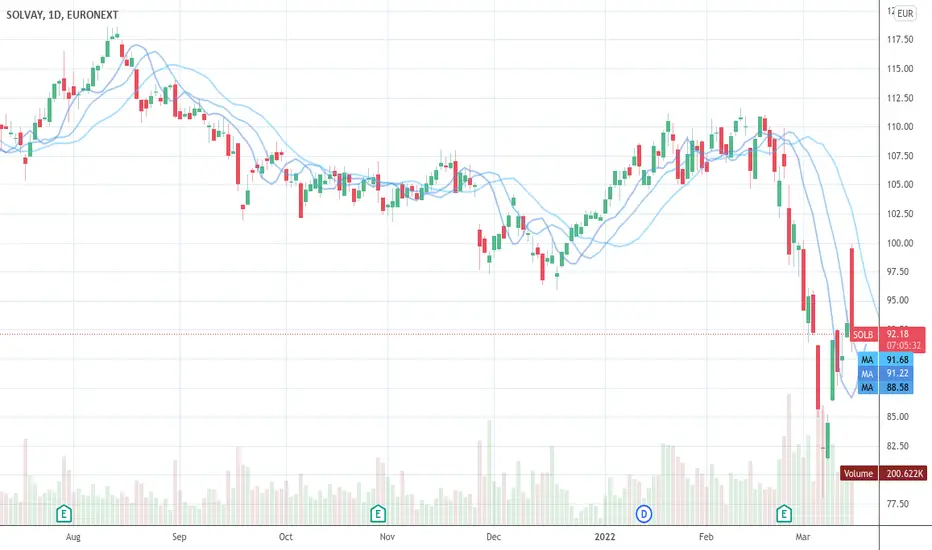
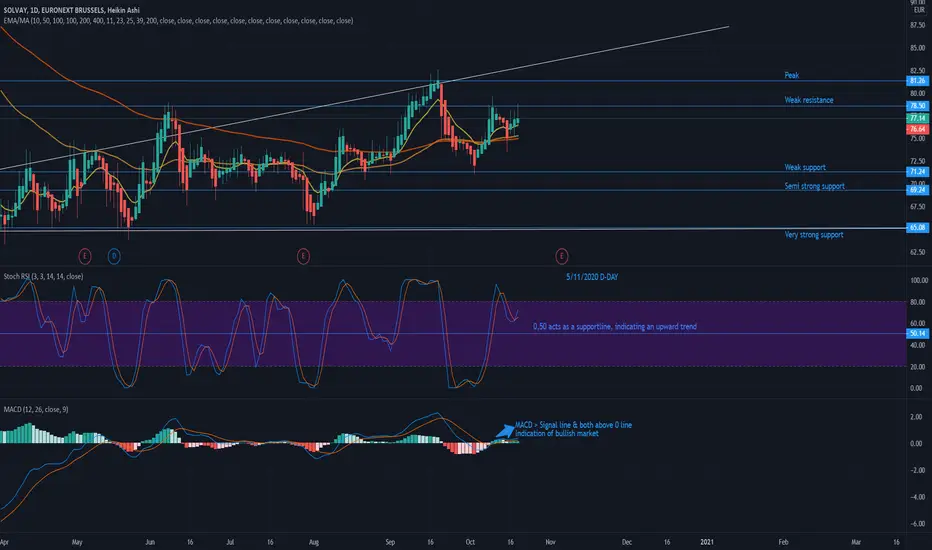
Hold Solvay-Weak bullish trendline
-Current price close to resistance level (€78 & €82).
Considering uncertainties regarding financial releases Q3 (05/11) and the impact of COVID (most likely limited) on the financials I would hold Solvay.
=> Will it break resistances after financial releases?
To revisit per 05/11.