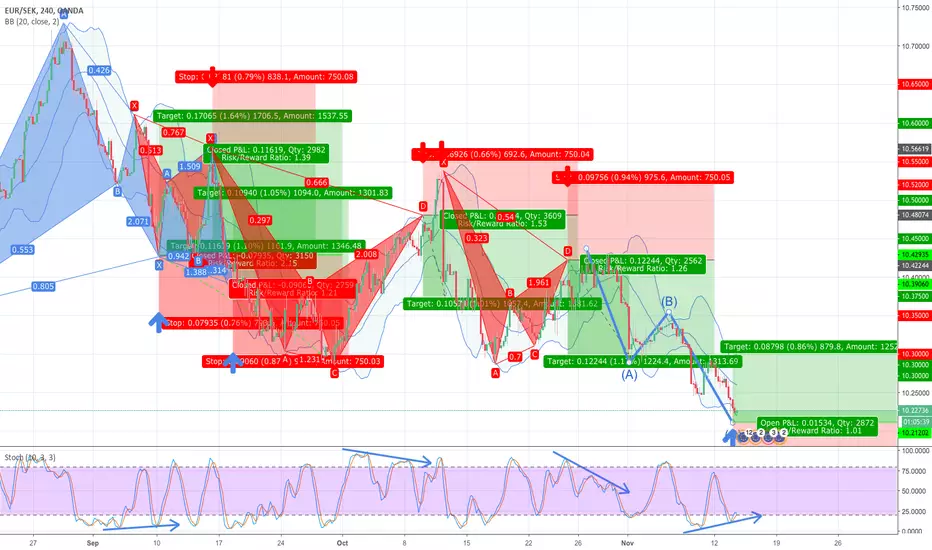
eur/sek short double topdouble top formed after an up trend . buyers are showing less interest. trend change possible
EURSEK trade ideas

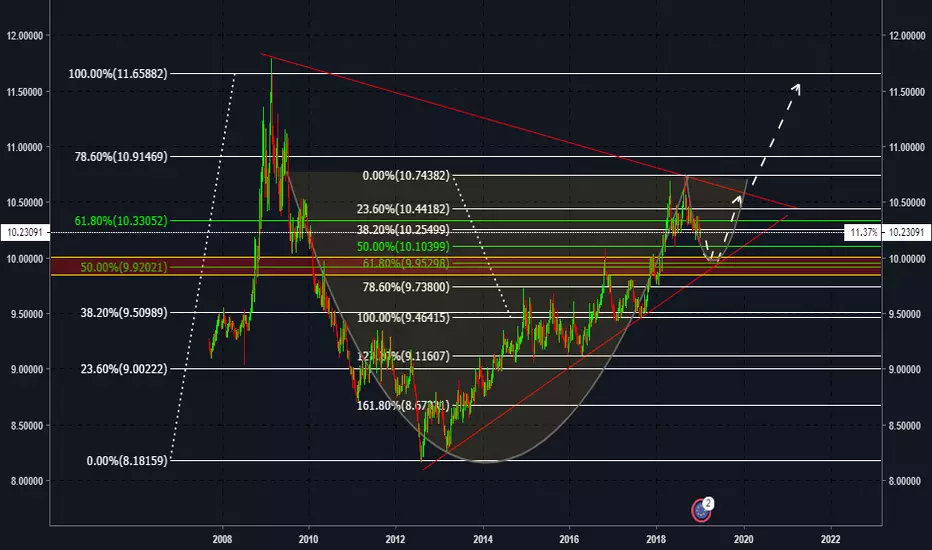
EUR/SEK Analysis of Multiple ConfluencesI would first like to preface that this analysis is simply for educational purposes and does not constitute a signal. With this idea, I would like to touch on the topic of confluences. When performing technical analysis on pairs in the forex market, it's great practice to study confluences in the market. What are confluences? Confluences are levels in the market where there is more than one indication that a particular price point is of certain interest for a buy or a sell. Although not a guarantee of a buy or a sell, these areas should be watched closely for action of price. Price can be impacted by a variety of factors, including fundamentals. Given this, only after studying and obtaining confirmation should a trade be entered. In this example for EUR/SEK, I see a few confluencing factors as follows:
1. Taking a fib on two separate time frames we see confluence of fibs on both the 50% and 61.8% levels. This area is highlighted. We see zone that is of particular interest.
2. We also can draw trendlines and see confluence between the price point of these fib levels and the respect of the trend line.
3. I have done some further research to study that the fib levels as noted happen to fall at historical key levels in the market.
4. Although the market does not have to follow particular patters, if price followed through as indicated, price action would closely follow that of a cup and handle pattern.
Study such as this is very helpful for strengthening one's technical analysis. I invite you to study this with me, watch price action and take notes along the way.
Again, this is not a signal but simply for educational and study purposes. If you decide to take this trade, use proper risk management and trade at your own risk.
EURSEKEursek is making triangle.As if it might go up
This is not a investment idea just my analysis.

EURSEK: 1D Channel Down/ sell signal to 10.070.The pair is trading inside a Channel Down on 1D and the current neutrality (RSI = 47.632, Williams = -49.587, CCI = -47.5862, Highs/Lows = 0.0000) indicates that a Lower High level has been reached. Based on the previous Lower Low measurements, we are short on EURSEK targeting 10.07000.


EURSEK Broke Major Support, Potential DropThis is a 4H chart for FX:EURSEK
Probability : Short
Price broke a very important support and retested it after finding some minor support around 1.2125 this doesn't seem to hold, SL around 10.4500 and target will be 10.0000
Updates will be available later.
This is not a signal, it's just my opinion, Good luck

EURSEK is not ready! Hurry Up and Wait!EURSEK : Price is consolidating. It will break out very soon. The double top indicates it may break out to the downside, however we need to wait for confirmation because price is at a very strong support level. EURSEK

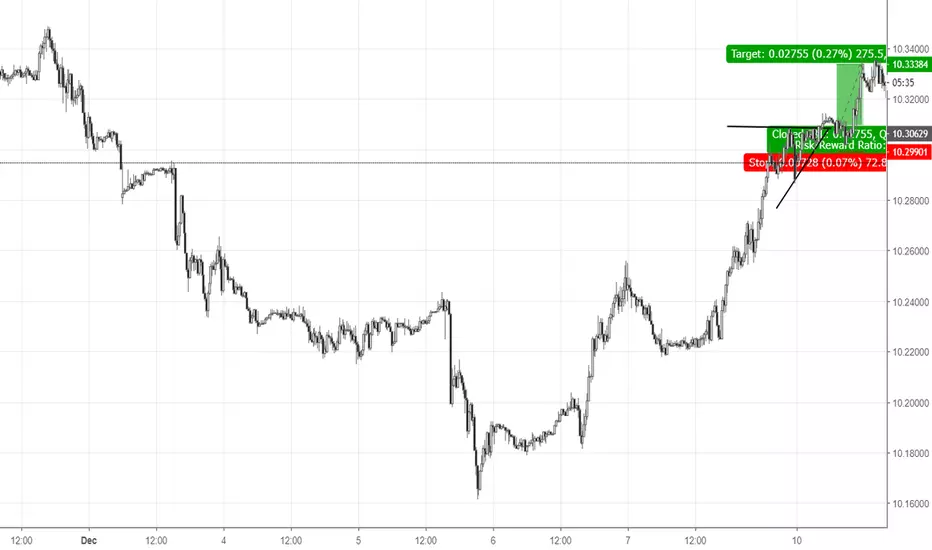
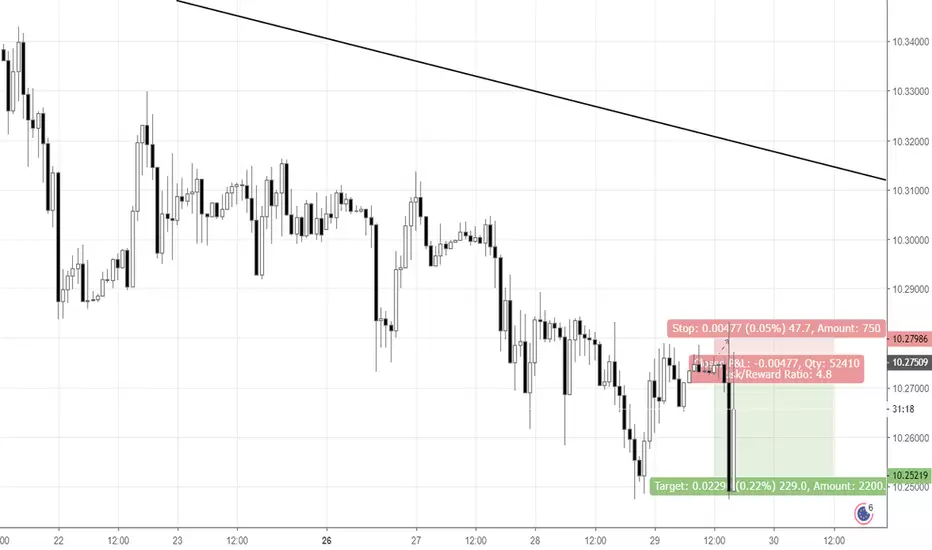
Ascending triangle intraday Got in after the breakout of the ascending triangle as the price was retesting the horizontal price level of the triangle. Stop loss was under one of the triangle's local lows. Profit target is around November 30th highs.
(Posted post factum)
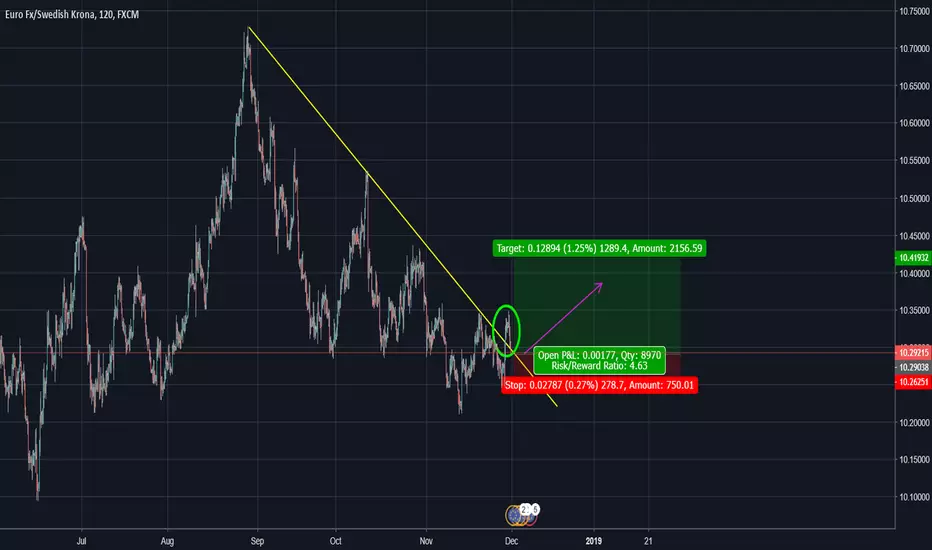
EURSEK OutlookFOREXCOM:EURSEK This is currently in a strong uptrend, however a reversal may occur after it reached the previous high (Peak to the left). It is best to allow this to run and put on a short position after the support level is broken. Will still need to watch and make sure there is no bounce on the lower trend line.
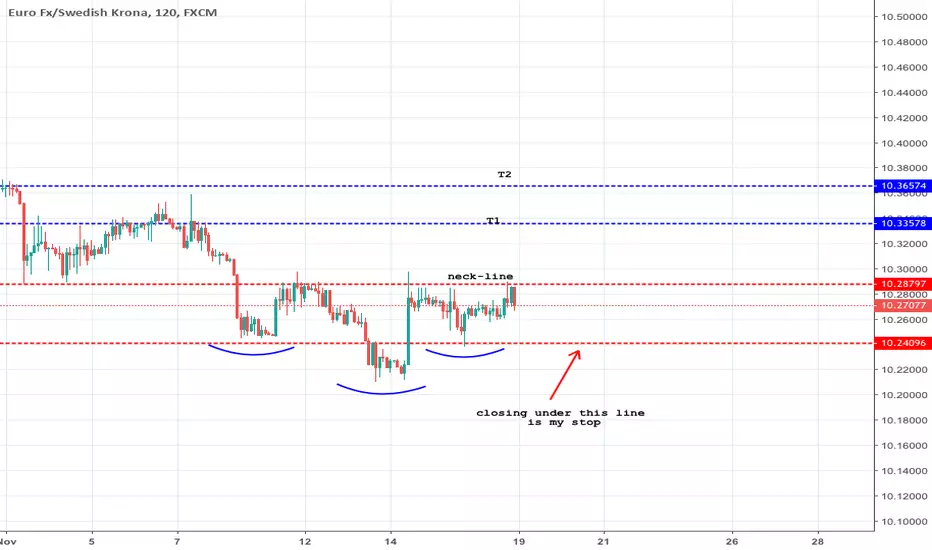
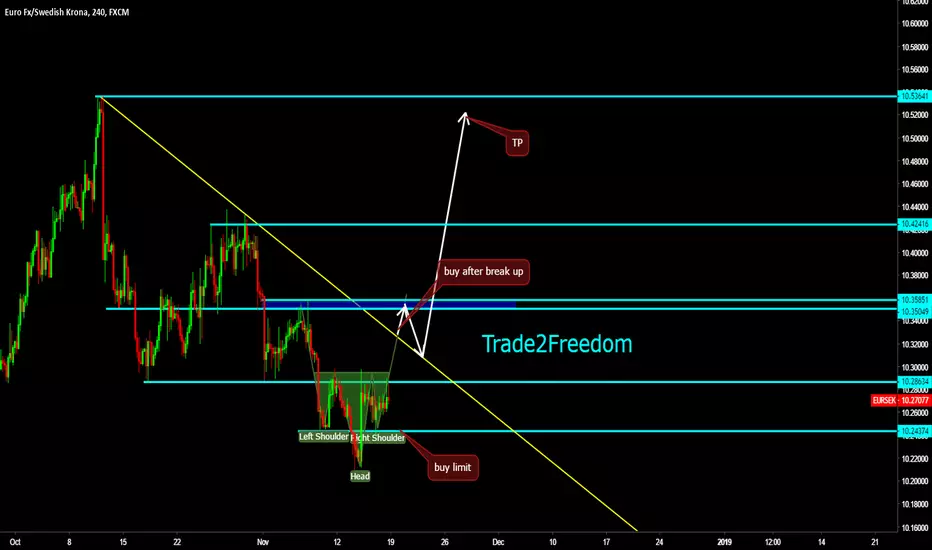
EURSEK Longthere is a possible head and shoulders. for confirmation, need to close a candle above the neck-line. until the closing above the neck-line I do not open a position
Christmas Gift--Sell--EURSEKAnother opportunity to short, don't be fooled. Every pull back a selling opportunity with first targets at 10.00, sell at 10.291, stops at 10.35
EUR/SEK 1H Chart: Two scenarios likelyThe EUR/SEK currency pair has been trading in the falling wedge since the middle of August. Also, the pair has reached the lower boundary of the long-term ascending channel.
Currently the rate is testing the lower channel line at 10.22. If given channel holds, a reversal north occurs in the nearest future and a breakout north from the wedge follows. Potential upside target is the Fibonacci 23.60% retracement at 10.45.
If given channel does not hold, the pair continues to trade within the wedge. A possible breakout north from given pattern might occur near the 10.15 mark.

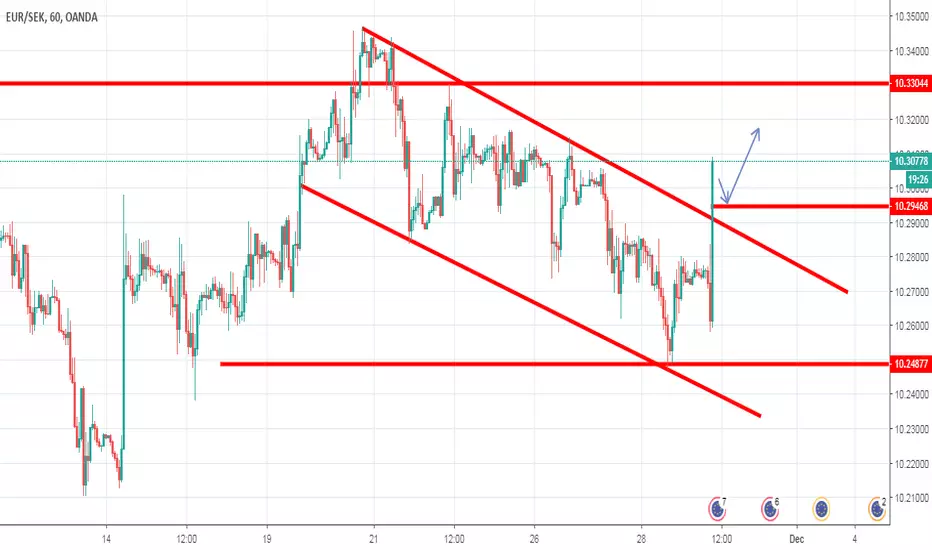
Long EURSEKTrading above the bearish channel so Buy at 10.30 SL 10.26 TP1 10.33 TP2 10.345. Follow me for trade updates. Please like and share if you agree on this idea.
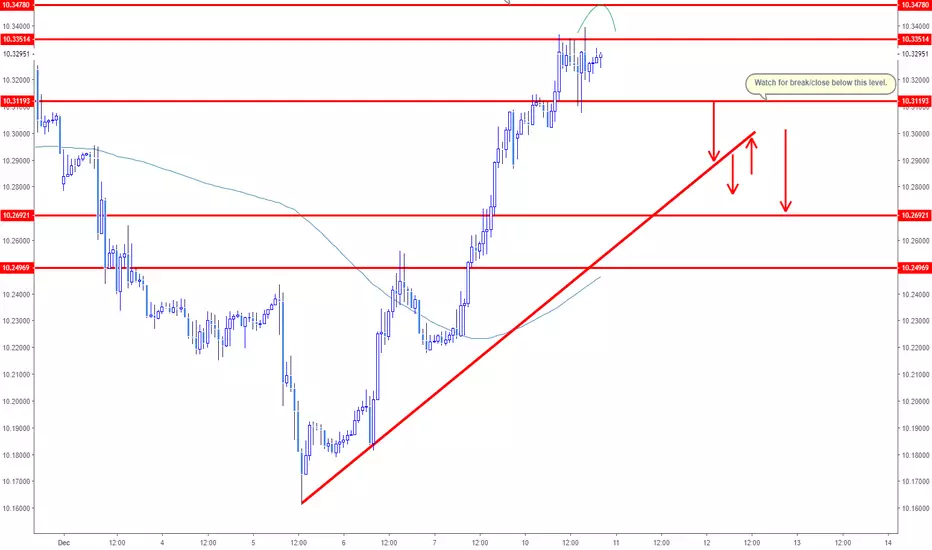
EURSEK - 240 - Finally, a break has happenedTrade Alert
Finally, the downside resistance line got broken. Now the big task for EURSEK is to overcome the 10.3500 barrier, which could clear the path towards higher levels. The next potential area of resistance could be seen near 10.435, marked near the high of the 26th of October.
Alternatively, a drop back down below the downside line and the 10.2880 level, would increase the chance for the pair to move lower. This is when we could start examining the previous lower levels, seen earlier this week.
Don't forget your SL.
CFDs are complex instruments and come with a high risk of losing money rapidly due to leverage. 68% of retail investor accounts lose money when trading CFDs with the Company.

Entry at rebound / pullbackI was trying to get in with my pending sell limit order with my Stop Loss above one of the highs of the current pullback. My profit target is at local low.
(Posted post factum after being stopped out)
EURSEK DECLINING WEDGEJust going for a simple 2:1 RR. We'll see, some areas of minor support, wouldn't be surprised if it doesn't hit my target.

EURSEK | TARGET PRICE 10.10935 | +4R | R-MULTIPLE | SHORTWaited for break and close of candle. Entered after retest of the line.
---- Trade Journal Notes.


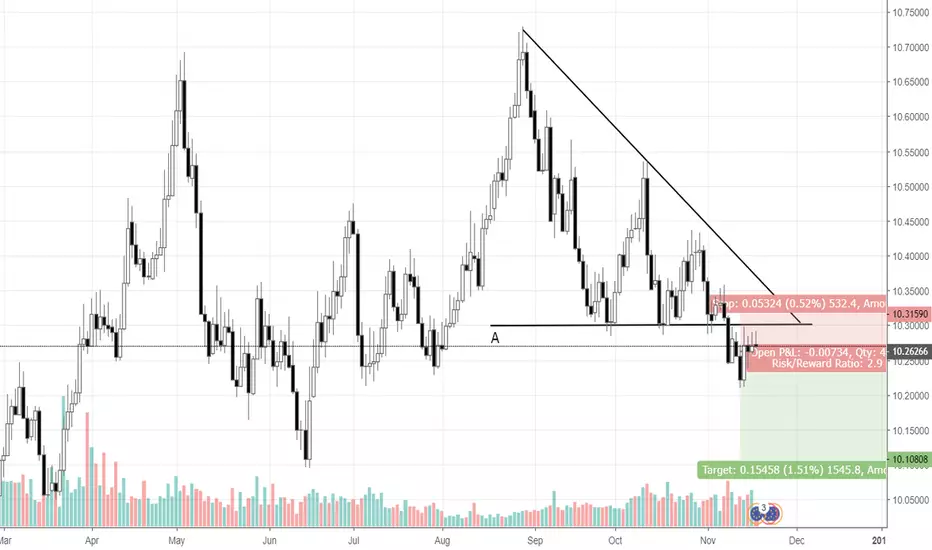
Trying again, this time reboundI already tried to get in the breakout of "A" level and the following short-term flag in my previous EURSEK idea. As it's not going without retests, I'm going short now as a rebound from the strong "A" level. Stop loss above "A" level. Profit target around June lows.
38.2% & POSSIBLE 61.8% Retracement LONG GWAVE.38.2% & POSSIBLE 61.8% Retracement LONG GWAVE.
FIB Retracement Percentage is calculated in a Higher Cartesian and or Euclidean Dimension.
PLEASE ALWAYS WAIT FOR STOCHASTIC CONFIRMATION!!! THANKS