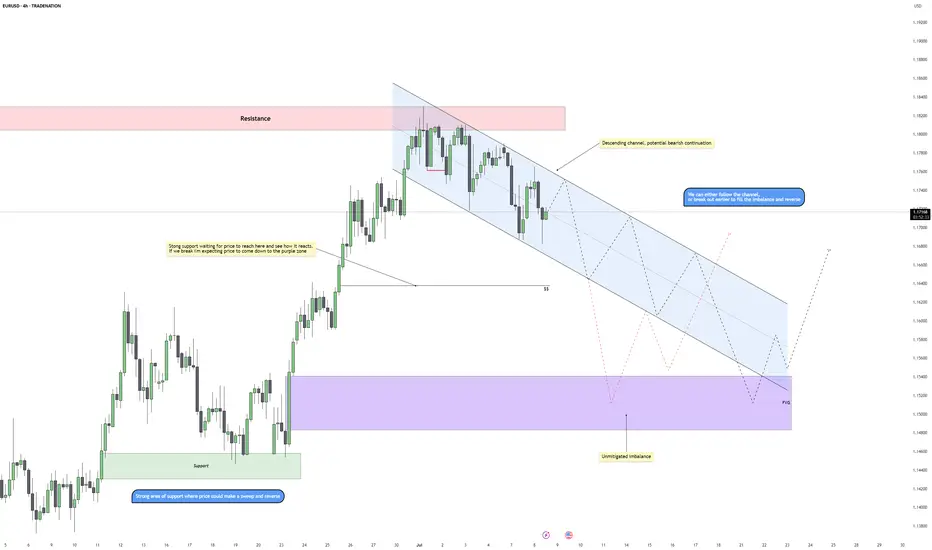
EURUSD - Compression Before Expansion? Key Reversal ZoneEURUSD is currently trading within a clear descending channel after rejecting a key resistance area. This move signals a shift in short-term sentiment, with bearish momentum guiding price action lower. The channel structure is intact, and as long as price respects this slope, lower levels remain in play.
Rejection From Resistance
After tapping into the major resistance zone, price failed to break higher and began forming lower highs and lower lows, confirming seller control. The rejection was clean and initiated the current bearish structure, which now serves as a roadmap for potential continuation lower.
Imbalance and Downside Targets
Below current price, there’s a visible imbalance that remains unfilled within the highlighted purple zone. This area acts as a magnet for price, especially if the bearish structure continues. A drop into this zone would align with a textbook move to fill inefficiency before a potential reversal can occur.
Support Structure and Liquidity Zone
There’s a strong support level marked just above the imbalance, which may offer a temporary reaction or even serve as a springboard for a reversal. This is also a likely liquidity pool, and a sweep of these lows could generate the fuel needed for a bullish move back toward mid-channel or even higher.
Projection and Scenarios
Price may either continue respecting the channel boundaries with stair-step retracements down into the imbalance, or break structure early with a more aggressive reversal once the inefficiency is filled. A deeper move into the purple zone followed by a reaction would suggest a potential shift in momentum.
Conclusion
The pair remains in a bearish corrective phase for now, with room to dip further into the unmitigated imbalance. Watch for how price reacts at support and whether a clean sweep and reversal setup presents itself. Until then, the channel remains the dominant structure guiding this move.
Disclosure: I am part of Trade Nation's Influencer program and receive a monthly fee for using their TradingView charts in my analysis.
___________________________________
Thanks for your support!
If you found this idea helpful or learned something new, drop a like 👍 and leave a comment, I’d love to hear your thoughts! 🚀
EURUSD trade ideas
EURO - Price will continue to grow inside rising channelHi guys, this is my overview for EURUSD, feel free to check it and write your feedback in comments👊
Recently, price entered to rising channel, where it soon reached the support level, which coincided with the support area.
After this movement, the price broke this level, but soon turned around and corrected the support line of the channel.
Next, EUR went back to $1.1365 level and broke it again, after which it made a retest and continued to move up.
In a short time, EUR rose to the resistance line of the channel, made a correction, and then grew to $1.1700 support level.
Price broke this level too and reached the resistance line of the channel, but not long ago corrected.
At the moment, I expect that the Euro can correct to the support line of the channel and then rise to $1.1900
If this post is useful to you, you can support me with like/boost and advice in comments❤️
Disclaimer: As part of ThinkMarkets’ Influencer Program, I am sponsored to share and publish their charts in my analysis.
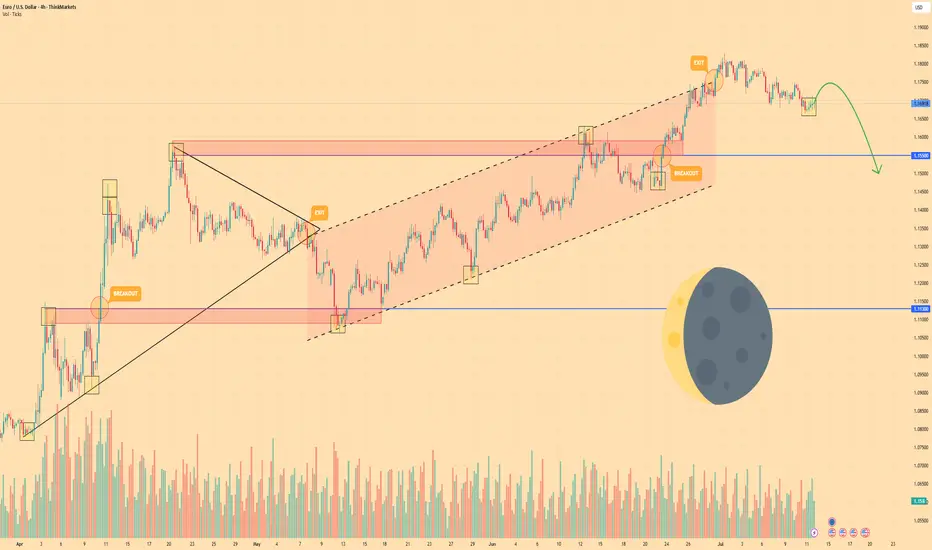
EURO - Price will rise a little and then drop to $1.1500 pointsHi guys, this is my overview for EURUSD, feel free to check it and write your feedback in comments👊
Price earlier carved out a pennant pattern after a strong rally, with price oscillating between converging trendlines and indecision mounting near $1.1550 resistance.
After several weeks in consolidation, sellers finally broke down below the pennant base, sending price back toward the support area and trapping late buyers.
Buyers regrouped and launched a new advance, driving EUR into a well-defined rising channel.
During this channel run, two notable breakouts above interim highs were quickly followed by exits at the upper trendline.
Price now sits in a tight consolidation just under the rising channel’s ceiling near $1.1700, forming small corrective swings on lighter volume.
I expect one more shallow rally toward $1.1750 before sellers overwhelm buyers again, pushing Euro down through $1.1550 and toward the $1.1500 points.
If this post is useful to you, you can support me with like/boost and advice in comments❤️
Disclaimer: As part of ThinkMarkets’ Influencer Program, I am sponsored to share and publish their charts in my analysis.
EURUSD is Approaching an Important Support!!Hey Traders, in today's trading session we are monitoring EURUSD for a buying opportunity around 1.16400 zone, EURUSD is trading in an uptrend and currently is in a correction phase in which it is approaching the trend at 1.16400 support and resistance area.
Trade safe, Joe.
EUR/USD Bearish Setup H4 Chart AnalysisMarket Structure:
Current Price: 1.17057
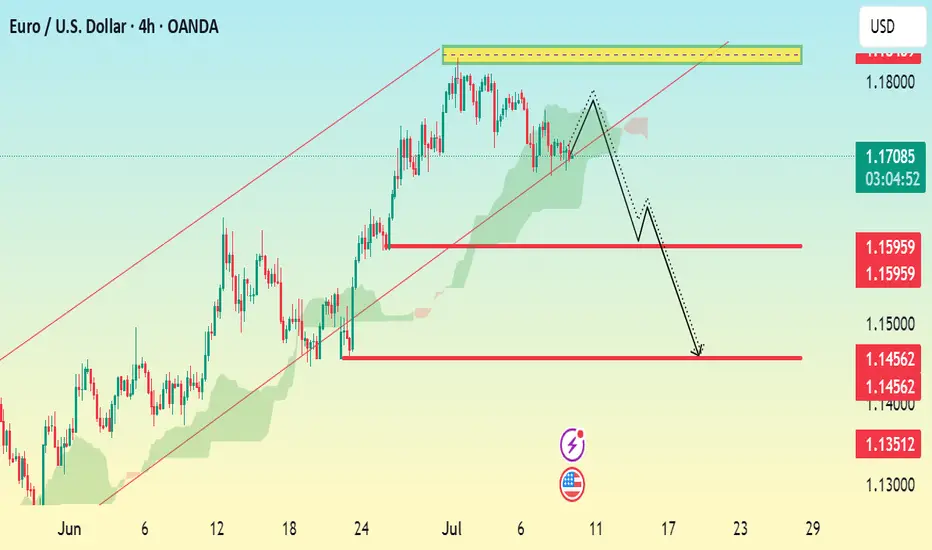
The market has rejected a key resistance zone around 1.17600–1.17800 (highlighted in yellow).
Price formed a lower high, suggesting bearish momentum is taking control after an uptrend.
The pair is trading around a key trendline and Ichimoku cloud, with a likely break below.
Bearish Signals:
1. Double Top / Lower High Formation near 1.17600 indicates potential reversal.
2. Bearish Projection Drawn: Expecting a drop after the neckline break.
3. Support Zones Marked:
First Support/TP1: 1.1650 – 1.1595
Second Support/TP2: 1.1456
Final Target/TP3: 1.1351
EURUSDHello Traders! 👋
What are your thoughts on EURUSD?
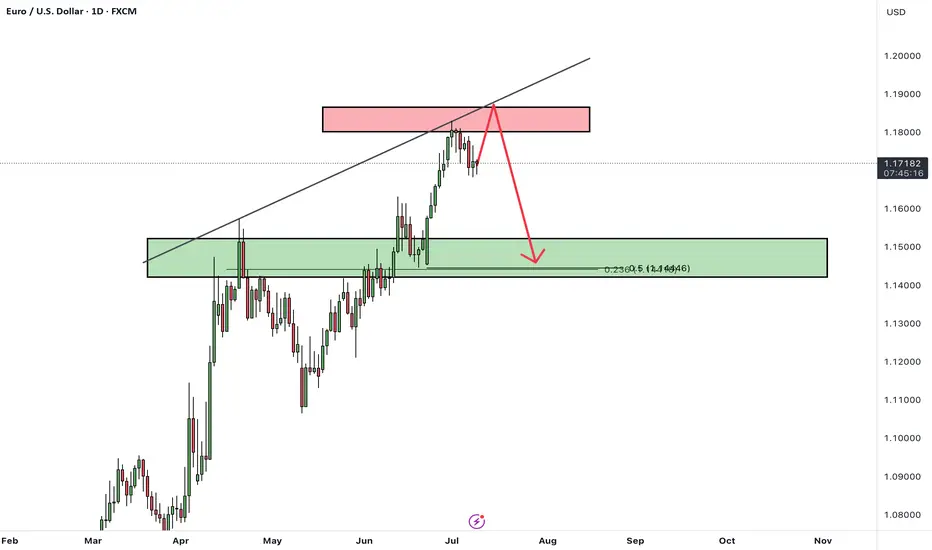
Following its recent rally, EURUSD has reached a key resistance zone, which also aligns with a trendline. The pair failed to break above this area and has been rejected.
Given the weak momentum and bearish reaction, we do not expect a breakout at this stage.
Instead, we anticipate some consolidation around the resistance, followed by a downward move toward the specified support level.
Don’t forget to like and share your thoughts in the comments! ❤️
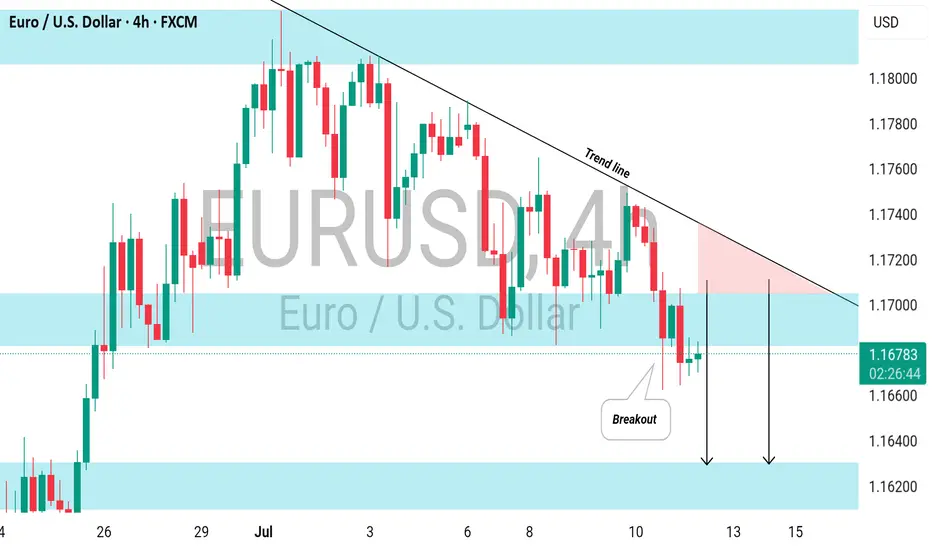
EURUSD: Bearish Continuation Ahead EURUSD is expected to maintain a bearish trend following a confirmed breakout below a significant horizontal support level.
The broken structure, along with a descending trend line, creates a contracting supply zone, indicating a strong likelihood of further downward movement.
The next target is 1.1620 support
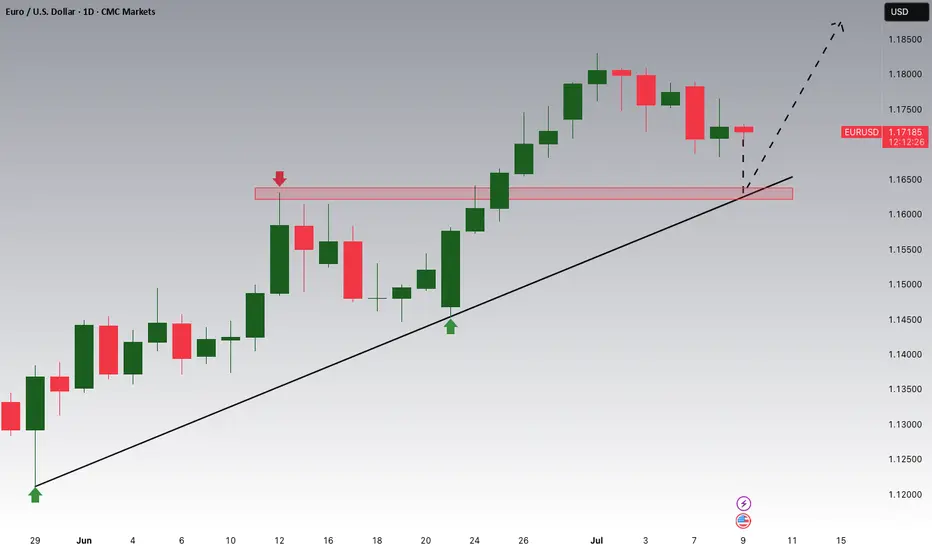
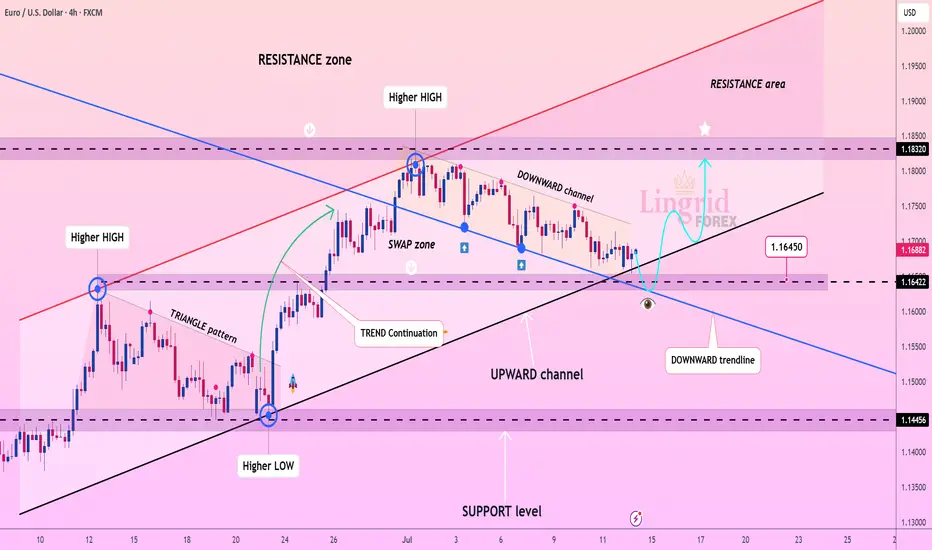
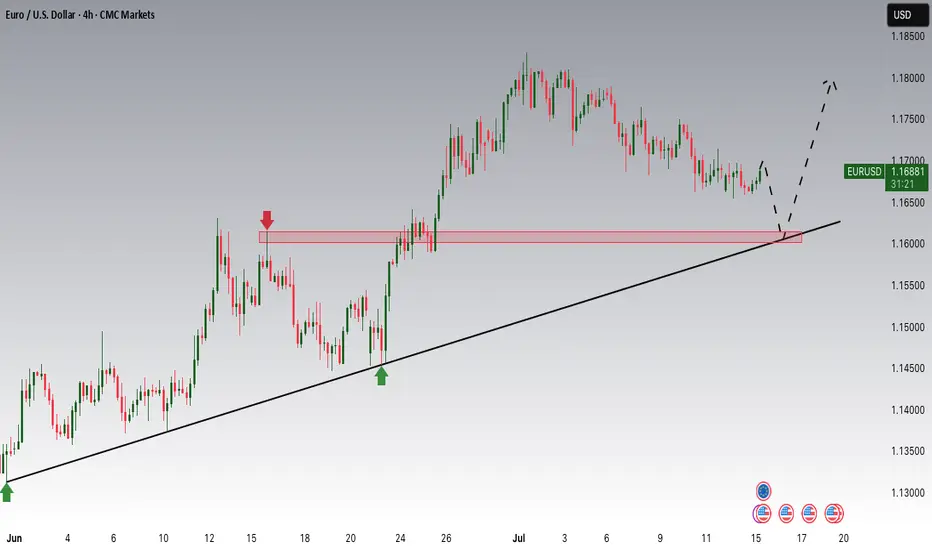
Lingrid | EURUSD Pulled Back to Key Support levelFX:EURUSD is approaching a major confluence zone at 1.16422 where the downward channel meets the upward trendline and horizontal support. The structure remains bullish with a sequence of higher highs and higher lows, and the current pullback fits within a healthy correction phase. A strong bounce from this triple-support region could trigger a reversal toward 1.18320, validating the continuation of the broader uptrend. All eyes are now on the 1.16450 reaction point for early momentum signs.
📉 Key Levels
Buy trigger: bullish reaction from 1.16422 support zone
Buy zone: 1.16200–1.16500 (channel base + trendline + demand)
Target: 1.18320
Invalidation: confirmed 4H close below 1.1600 breaks upward structure
💡 Risks
Deeper push below the trendline may trap early buyers
Low liquidity during the bounce can cause fakeouts
Unexpected USD strength could stall recovery momentum
If this idea resonates with you or you have your own opinion, traders, hit the comments. I’m excited to read your thoughts!
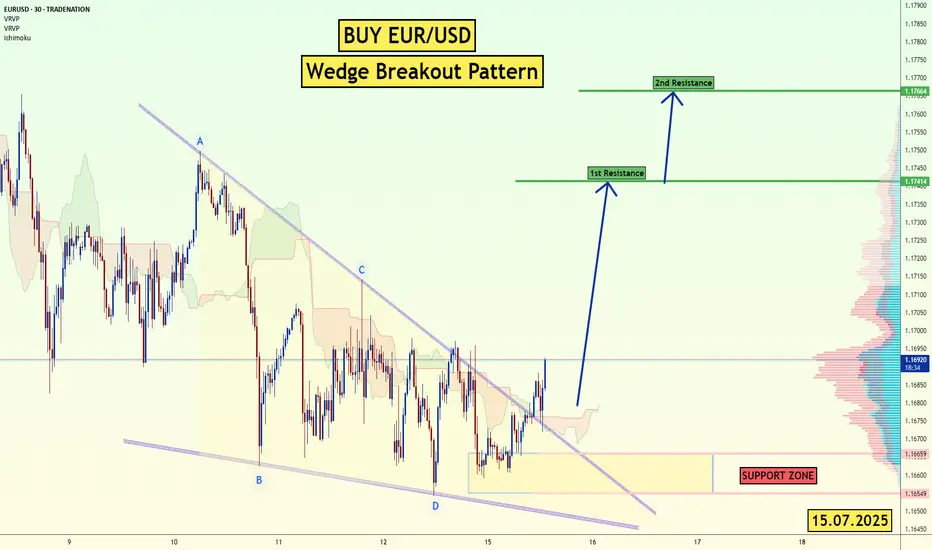
EUR/USD - Wedge Breakout (CPI- Today) 15.07.2025 The EUR/USD pair on the M30 timeframe presents a Potential Buying Opportunity due to a recent Formation of a Wedge Breakout Pattern. This suggests a shift in momentum towards the upside and a higher likelihood of further advances in the coming hours.
Possible Long Trade:
Entry: Consider Entering A Long Position around Trendline Of The Pattern.
Target Levels:
1st Resistance – 1.1741
2nd Resistance – 1.1766
🎁 Please hit the like button and
🎁 Leave a comment to support for My Post !
Your likes and comments are incredibly motivating and will encourage me to share more analysis with you.
Best Regards, KABHI_TA_TRADING
Thank you.
Disclosure: I am part of Trade Nation's Influencer program and receive a monthly fee for using their TradingView charts in my analysis.
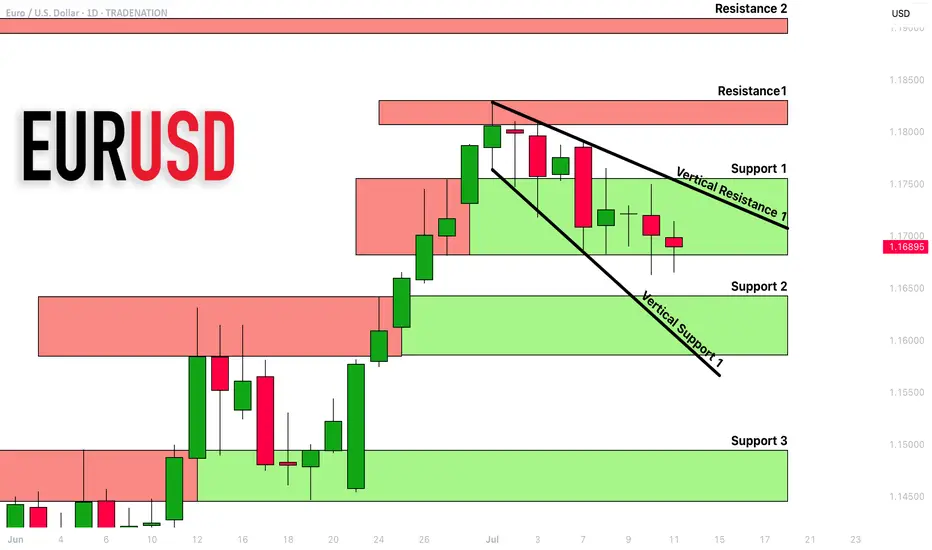
EURUSD: Detailed Support & Resistance Analysis 🇪🇺🇺🇸
Here is my latest structure analysis and important
supports and resistances for EURUSD for next week.
Consider these structures for pullback/breakout trading.
❤️Please, support my work with like, thank you!❤️
I am part of Trade Nation's Influencer program and receive a monthly fee for using their TradingView charts in my analysis.
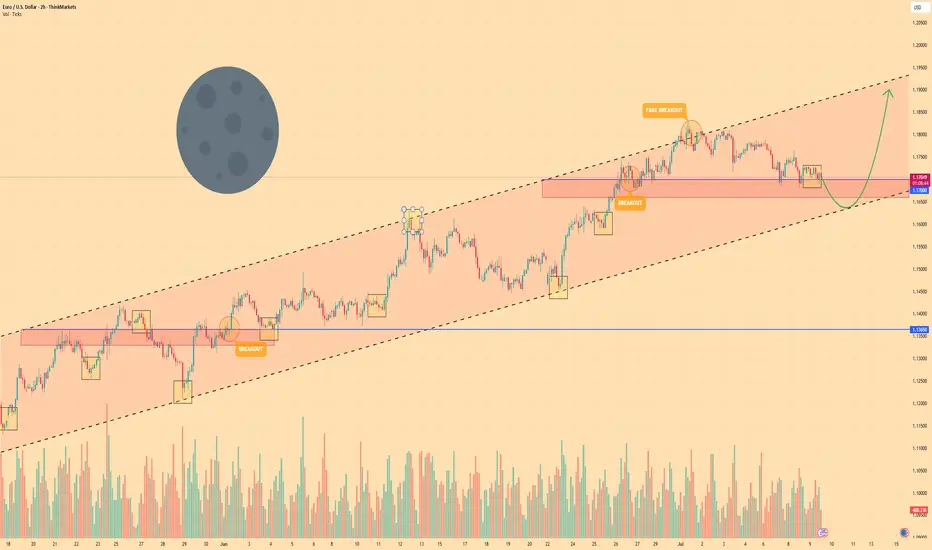
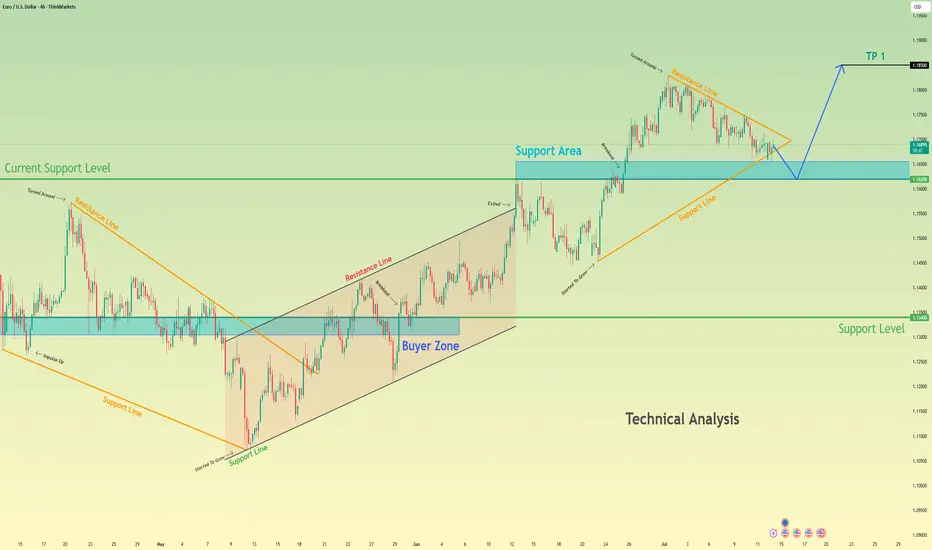
Euro may fall to support area and then start to growHello traders, I want share with you my opinion about Euro. The price previously moved inside a wedge formation, where it tested the buyer zone and showed a strong reaction from this area. After that, the pair broke out upward and started to trade inside an upward channel, building momentum and forming a clear bullish structure. Later, the price created a pennant pattern, often considered a continuation signal. But before continuing the upward trend, I expect the Euro to first exit from the pennant and decline toward the support area. This zone was previously resistantce, and now it may turn into a strong support. Now the price is trading near the pennant resistance, but I don’t expect a breakout right away. The market needs to correct before it resumes the uptrend. Once the price reaches the current support level or slightly lower, it may find demand again and bounce. That’s why I expect the Euro to retest the support zone and then grow further toward TP 1 - 1.1850 points. This target aligns with the upper border of the upward channel and would complete the continuation move after the pennant breakout. Given the previous structure, bullish momentum, and patterns on the chart, I remain bullish after the correction and expect the price to rise from the support zone. Please share this idea with your friends and click Boost 🚀
Disclaimer: As part of ThinkMarkets’ Influencer Program, I am sponsored to share and publish their charts in my analysis.
EURUSD: Consolidation Phase Nearing the Main Trend!!Hey Traders, in today's trading session we are monitoring EURUSD for a buying opportunity around 1.16100 zone, EURUSD is trading in an uptrend and currently is in a correction phase in which it is approaching the trend at 1.16100 support and resistance area.
Trade safe, Joe.
#EURUSD: Last Bullish Price Extension! Get Ready! EURUSD is approaching our buying zone, a key level, which suggests a smooth bullish reversal. As this is a swing trade, we advise keeping stop losses larger. There are two targets to keep an eye on. Remember, this is not a guaranteed move, and this is just our overview. Good luck and trade safely.
Team Setupsfx_
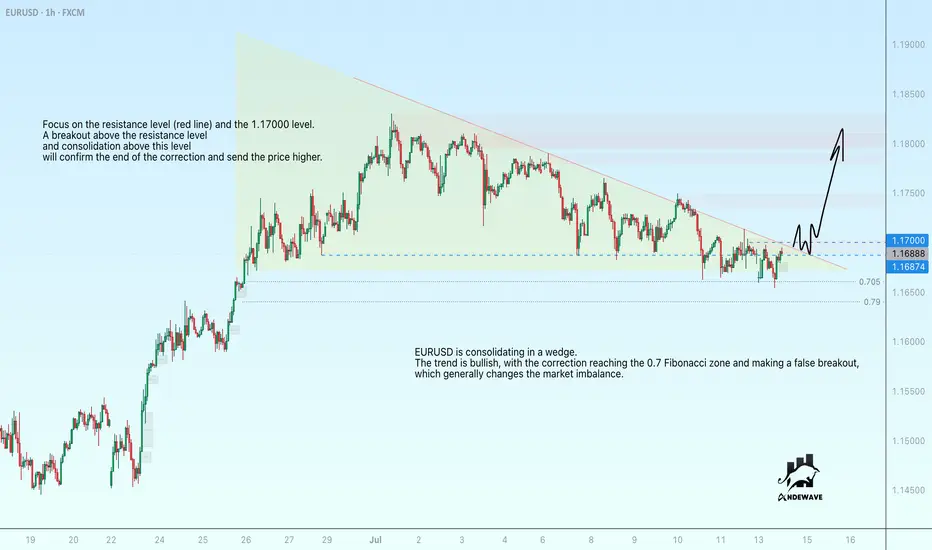
EURUSD is close to the end of its correctionEURUSD is consolidating in a wedge. The trend is bullish, with the correction reaching the 0.7 Fibonacci zone and making a false breakout, which generally changes the market imbalance.
All attention is on the wedge resistance (red line) and the 1.17000 level. A breakout of the resistance and consolidation of the price above this level will confirm the end of the correction and send the price higher.
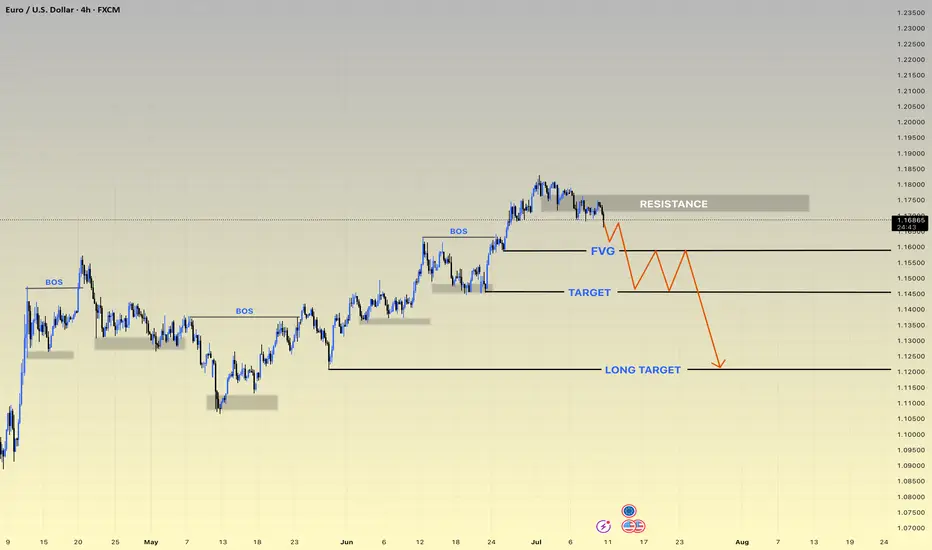
EURUSD h4 update ⚠️ Current Outlook: Reversal Zone Hit
• Price tapped into the strong RESISTANCE zone (~1.1800), failing to break higher.
• Market structure BOS (Break of Structure) confirms bearish intent.
• FVG (Fair Value Gap) likely to act as a short-term liquidity trap.
📍 Disrupted Bearish Flow:
1. Price rejects resistance aggressively ✅
2. Pullback into FVG may trigger a liquidity hunt 🧲
3. Fake bounce → Smart Money re-entry expected 👀
4. Target levels:
• 🥅 TARGET: 1.1550 zone (first major support)
• 🎯 LONG TARGET: 1.1200 zone (high probability zone for HTF buyers)
🔁 Bear Trap Setup Possibility:
• After hitting the LONG TARGET, price could reverse sharply.
• Watch for accumulation signs and deviation below key levels.
⸻
🔥 Key Zones to Watch:
• 🔳 Resistance: 1.1790–1.1820
• 🟦 FVG Retest Zone: 1.1630–1.1660
• 📉 Target Zone: 1.1500–1.1550
• 🚨 Long-Term Demand Zone: 1.1180–1.123
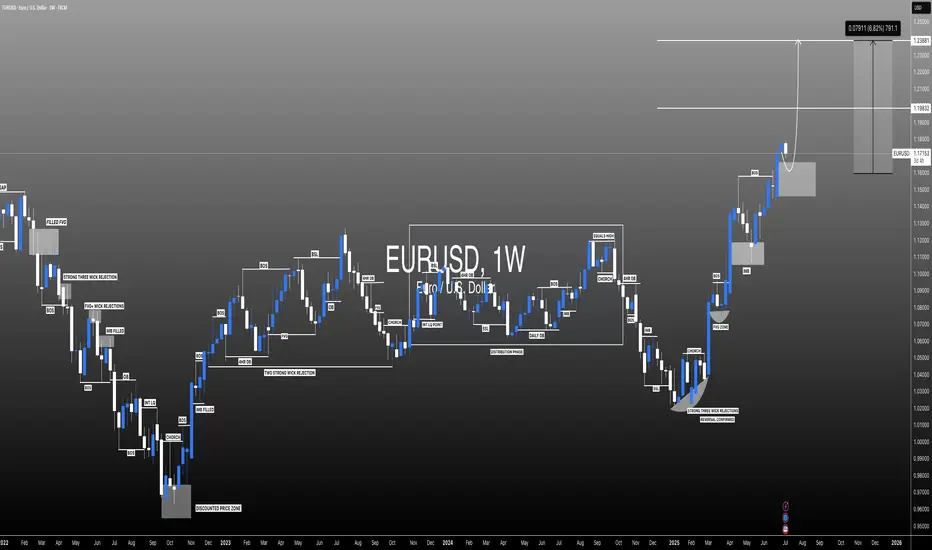
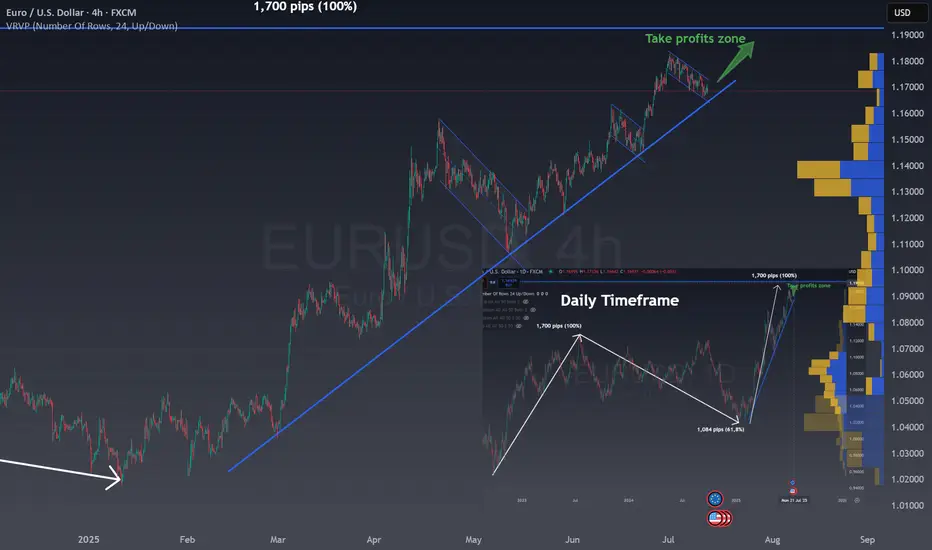
One last rally in EUR/USDIn the right bottom you can see the Daily chart for EUR/USD:
The chart shows the EUR/USD on a daily timeframe.
There was an initial strong rise of 1,700 pips, marked as a 100% move.
After this, the price corrected downward by 1,084 pips, which is 61.8% of the previous rise.
The 61.8% retracement is a common Fibonacci level, often signaling a reversal or pause.
Now, the price is moving up again, following a similar path as the first rise.
The chart suggests a possible new upward move of another 1,700 pips (100%).
A "take profits zone" is marked at the top, indicating a target area for traders.
This pattern reflects how markets often move in waves: trend, correction, and trend continuation.
Fibonacci levels help traders identify potential reversal points.
The chart is used to project future moves based on past price behavior.
The MAIN CHART shows a clear uptrend for EURUSD and the current correction with a flag.
The combination of both patterns give us a clear BUY zone in the channel and using the trend as support or once the channel break upwards.
This is a very good risk reward ratio trade situation where all traders should be!
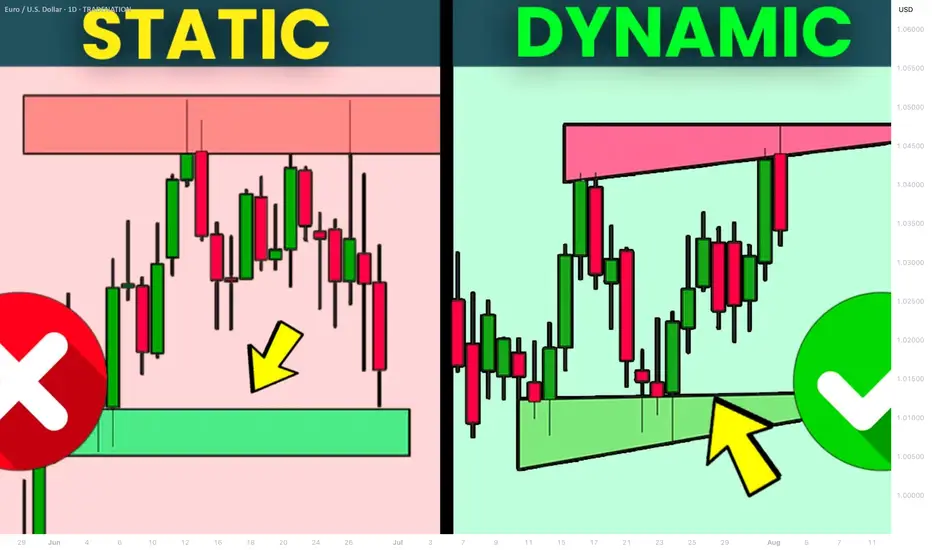
What is Dynamic Support and Resistance Levels & Zones in Forex
Dynamic supports and resistances play a crucial role in technical analysis.
Unlike classic supports and resistances, these zones change and adapt to a market price action in real time.
Learn what is dynamic support and resistance in Forex, Gold trading and how to find it easily.
Discover its main types and real market examples.
Let's start with the basics.
There are 2 major types of supports and resistances in technical analysis.
The first type is called static .
Such supports and resistances are fixed and don't change with time.
It should be strictly horizontal key levels or the zones.
Market price action and momentum beyond them do not affect these supports and resistances.
In the example above, you can find static supports and resistances on Gold. The market may return to one of those levels or the zones today, tomorrow or in a month, but it will not move.
In comparison to static supports and resistances, the dynamic ones shift with time. They constantly change and adjust as the time flies.
One of the obvious types of dynamic supports and resistances is a trend line.
Above is the example of a dynamic rising support based on trend line.
As the time goes, a support shifts and becomes higher and higher.
I found a great example of a dynamic resistance on Dollar Index.
Depending on the moment when the price tests that, the resistance will be on different levels.
The later the price tests the trend line, the lower is the resistance.
When newbie traders learn dynamic supports and resistances, they usually stop on trend lines.
But it is just a beginning.
Really significant dynamic supports are resistances will be the zones .
The areas based on static horizontal supports and resistances and trend lines.
Examine a price action on GBPCHF forex pair.
We have a static horizontal support area and a dynamic rising trend line.
Two supports intersect, composing a contracting dynamic support zone.
With time, it will become narrower, accumulating buy orders within.
On NZDCAD forex pair, I underlined a contracting dynamic resistance zone that is based on an intersection of a static horizontal resistance area and a falling trend line.
Selling orders will be distributed within.
The 2 dynamic support and resistance zones that we discussed are narrowing , but that is not always the case.
A dynamic support zone that I found on GBPNZD is expanding and broaden with time.
It is based on a dynamic falling trend line and a static horizontal support.
With time its boundaries will be wider and a bullish reaction may initiate from any level within that.
A dynamic resistance area that I spotted on EURCAD forex pair is a great example of an expanding resistance.
It is based on a static horizontal resistance and a rising trend line.
We can easily recognize how it grows with time.
Of course, another types of dynamic supports and resistances exist. But they are more nuanced and rare.
As soon as you learn to recognize the clusters that we discussed in this article, you will be able to recognize the less obvious ones as well.
Next time, when you execute a support and resistance analysis, try to find a dynamic zone. You can find it on any time frame, and forex pair and gold, and it will completely change your perspective on the market.
❤️Please, support my work with like, thank you!❤️
I am part of Trade Nation's Influencer program and receive a monthly fee for using their TradingView charts in my analysis.
Navigating the Complexities of Forex Swap RatesNavigating the Complexities of Forex Swap Rates
Forex swap rates, pivotal in currency trading, reflect the cost of holding a position overnight. This article unpacks swaps, offering clarity on their calculation and impact. Even seasoned traders may be confused with the complexity of swaps. It’s vital to learn about how these costs relate to effective strategy and fee management. Dive into the complexities of forex swaps and learn how they can influence decisions and overall performance in the ever-evolving trading world.
Understanding Forex Swap Rates
For traders, understanding forex market swap rates is crucial. A swap is essentially the interest differential paid or charged to a trader when they hold a position overnight. The concept hinges on the idea that when you trade currencies, you are effectively borrowing one currency to buy another. Hence, these rates come into play, reflecting the cost of the process.
The swap rate definition boils down to the interest rate difference between the two currencies involved in a trade. For instance, if you are going long in a pair like EUR/USD, the swap rate would be determined by the difference in interest rates set by the European Central Bank and the Federal Reserve. If the borrowing cost of the euro is lower than that of the dollar, holding the EUR/USD pair overnight would typically result in a charge. Conversely, if the euro has a higher borrowing cost, you might see your balance credited.
Calculating swaps involves a straightforward formula:
Swap rate = (Contract size × Interest differential) ÷ 365
This calculation takes into account the size of your position and the interest rate difference, providing a daily cost or gain for holding the position. Understanding these costs is vital when it comes to managing trading expenses and strategy in the forex market.
Key Elements Influencing Swap Rates
Several factors play pivotal roles in determining overnight swap rates in the forex market.
1. Interest Rate Differentials: The primary driver of overnight rates, interest differentials stem from the varying monetary policies of central banks. For example, if the Bank of England has a higher lending rate than the Federal Reserve, a buy trade in GBP/USD could mean earning for maintaining the position overnight.
2. Market Conditions: Economic stability, political events, and financial market volatility can significantly impact overnight charges. During periods of high volatility or geopolitical uncertainty, rates may fluctuate more dramatically, reflecting the increased market risk.
3. Liquidity: The level of liquidity in the market often influences overnight costs. In less liquid markets and less commonly traded pairs, higher swaps might be charged due to the increased cost of facilitating these trades.
4. Broker Policies: Different forex brokers might have varying policies and calculations for their own swaps. These differences usually arise from the brokers' own pricing structures, risk management strategies, and competitive positioning in the market. As such, traders should be aware that overnight charges vary from broker to broker.
Types of Forex Swaps
There are primarily two types of swaps that traders may encounter, each serving distinct purposes and offering unique implications for trading strategies.
1. Interest Swaps: These involve the exchange of interest payments between parties. In forex, it typically manifests as the fee a trader pays or receives for holding a position overnight. They directly impact the cost of maintaining open positions in different pairs.
2. Currency Swaps (Cross-Currency Swaps): Also known as a currency rate swap, this involves exchanging principal and interest payments in two different currencies. While less common in everyday retail forex activities, they are important in managing currency exposure and risk, particularly in hedging strategies. Currency swaps are used to secure a predetermined exchange rate for a specified currency amount while incorporating a benchmarked or fixed interest rate. This type is usually used by corporations or brokers.
Regarding fixed swap rates, they are less common in the forex market compared to the more prevalent floating swap rates. They’re often used in less volatile financial environments and typically find their application in long-term financial instruments or corporate finance rather than in the day-to-day trading of currencies.
Strategies for Managing Swap Rates
Management of swaps in forex involves several key strategies:
- Short-term Trading: By closing positions before the end of the trading day, traders can avoid incurring overnight fees altogether. It’s a so-called day trading since positions are typically closed by the end of the day.
- Hedging: Implementing hedging strategies may mitigate overnight fees. This involves opening opposite positions in correlated pairs, thus potentially balancing the amounts paid and received.
- Economic Calendar Awareness: Staying informed about major economic announcements and central bank decisions often helps traders anticipate changes in borrowing costs.
- Broker Selection: Choosing the right broker is critical. Selecting a broker with favourable rates might significantly reduce trading fees, especially for those holding long-term positions.
Practical Implications for Traders
Understanding and managing these charges has direct implications for traders' strategies and overall performance. Key considerations include:
- Carry Trading: A carry trade strategy entails borrowing in a currency with a lower interest rate and investing in another with a higher yield. Traders take advantage of the interest differential but must be mindful of potential fees.
- Rollover Costs: Traders holding positions overnight need to account for rollover costs, which can either erode or enhance returns, depending on the direction of the trade and the prevailing swap rates.
- Currency Exposure Management: Swap rates affect the overall cost of maintaining a position. Traders need to balance the potential advantages of holding a position against the charges incurred.
The Bottom Line
Mastering swap rates is a cornerstone of trade management. A thorough understanding may empower traders to navigate these costs and potentially improve their strategies. By carefully considering factors like interest differentials and broker policies, traders may manage their trades and overall performance more effectively.
This article represents the opinion of the Companies operating under the FXOpen brand only. It is not to be construed as an offer, solicitation, or recommendation with respect to products and services provided by the Companies operating under the FXOpen brand, nor is it to be considered financial advice.
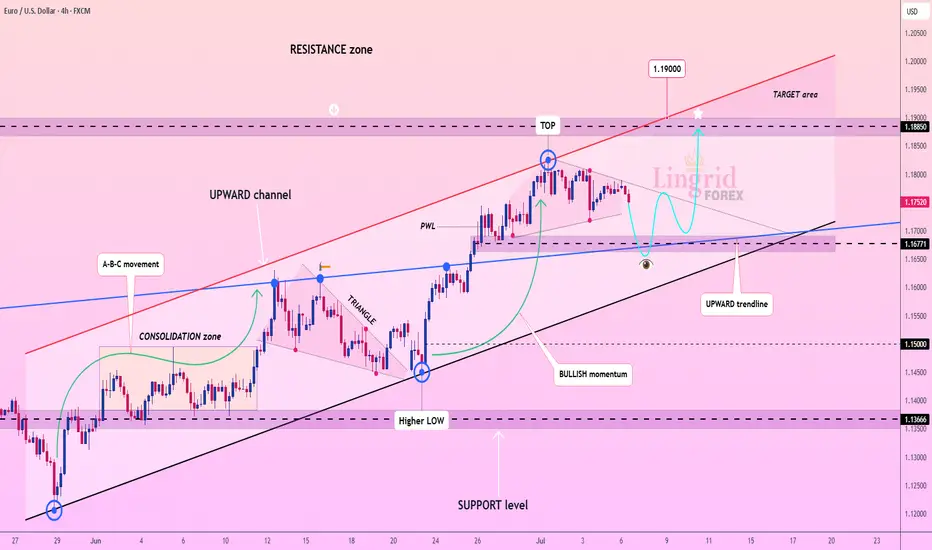
Lingrid | EURUSD Bullish Trend ContinuesFX:EURUSD is holding a bullish structure inside an upward channel after bouncing from the 1.1670 demand zone. The current retracement appears corrective, and buyers may step in again near the confluence of the trendline and horizontal support. If confirmed, the price is expected to push toward the 1.1885 resistance and the upper channel target at 1.1900.
📈 Key Levels
Buy zone: 1.1650–1.1680 (trendline + key support)
Sell trigger: break below 1.1600
Target: 1.1885 – 1.1900 zone
Buy trigger: bullish reversal candle near 1.1700
💡 Risks
Failure to hold trendline support could lead to deeper retracement
1.1885 may cap upside if momentum fades
Bearish divergence could emerge if price surges too fast
If this idea resonates with you or you have your own opinion, traders, hit the comments. I’m excited to read your thoughts!
EURUSD Bearish Ahead as US Resilience Meets Eurozone FragilityEURUSD has shifted into bearish territory, pressured by growing divergence between a resilient US economy and a struggling Eurozone. The pair recently rejected the 1.1700 zone, forming multiple bearish structures on the 4H chart. With sticky US inflation, Trump’s renewed tariff agenda, and a dovish ECB, EUR/USD appears poised for a deeper move toward 1.1527 and possibly 1.1445 in the coming sessions. This setup is both technically and fundamentally aligned, but key event risk remains.
🔸 Technical Structure (4H)
Clear rejection from the 1.1700–1.1710 zone.
Bearish pennants and wedge patterns confirm continuation lower.
Downside targets:
🔹 First: 1.1637
🔹 Second: 1.1527
🔹 Final: 1.1445
Risk zone: Above 1.1785 (invalidates short bias if broken cleanly).
🧭 Key Fundamentals
🇺🇸 Dollar Strength: Sticky inflation, stable labor market, and geopolitical risk all favor USD demand.
🇪🇺 Euro Weakness: ECB dovish tone persists amid weak data, soft PMIs, and stagnating growth.
Yield Spread: US-Euro real yield spread supports further EUR/USD downside.
Tariff Pressure: Trump’s 50% tariff plan and tensions with the EU weigh on EUR.
⚠️ Risks to Watch
A surprise dovish pivot from the Fed.
Weak US CPI or disappointing retail sales.
Major risk-on flows that trigger broad USD weakness.
New EU fiscal stimulus or Germany/France recovery surprises.
📆 Key Events Ahead
🇺🇸 US Core CPI – A hot print supports USD strength.
🇺🇸 Retail Sales & Powell testimony – Watch tone on rate cuts.
🇪🇺 German ZEW Sentiment, Eurozone HICP inflation – Weak readings would further drag EUR.
🔄 Leader or Lagger?
EUR/USD is a lagger to GBP/USD, often following UK-driven USD moves.
Acts as a leader for EUR/JPY, EUR/AUD, EUR/CHF – weakness here cascades across EUR crosses.
Tracks broad USD sentiment – dovish Fed pricing boosts EURUSD, while rate hike fears drag it.
✅ Summary: Bias and Watchpoints
EUR/USD is bearish below 1.1700 as economic divergence, sticky US inflation, and rising geopolitical tensions favor the dollar. ECB policy remains soft, offering little support to the euro. Key risk lies in a dovish Fed pivot or softer US data. Watch US CPI and Powell for clues. This pair is likely to lag GBP/USD moves, but will lead EUR crosses lower if the downside momentum continues.

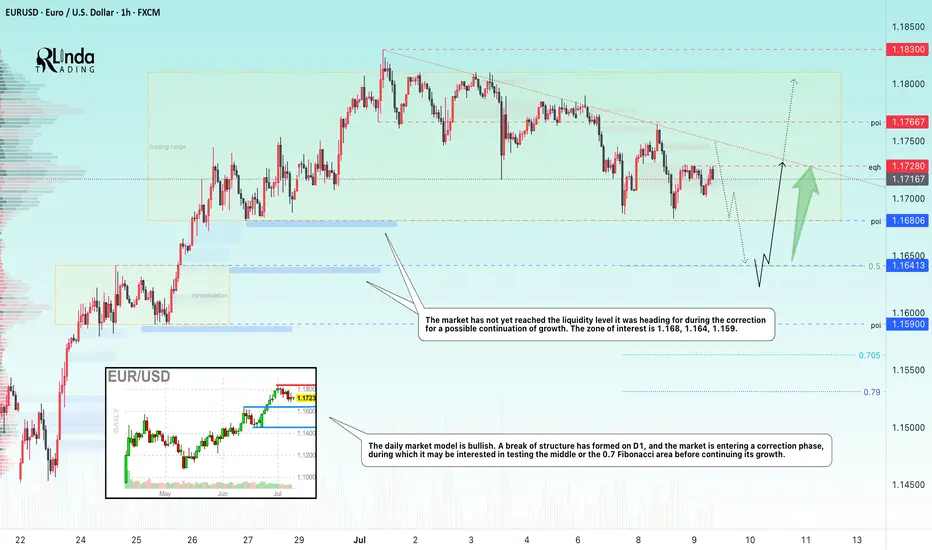
EURUSD → Bullish daily structure. Correction before growthFX:EURUSD , after significant growth and a break of structure, has entered a local correction, the target of which may be a phase of accumulation of potential for updating intermediate highs (1.183).
The daily market model is bullish. A break of the structure has formed on D1, and the market is entering a correction phase, during which it may be interested in testing 0.5 or the 0.7 Fibonacci area before continuing its growth. I would also like to draw attention to the previously broken resistance level of 1.164 - 1.163, which, within the current correction, may act as a support level for buyers...
In addition, the market has not yet reached the liquidity level it was heading for during the correction for a possible continuation of growth. Zone of interest: 1.168, 1.164, 1.159
Resistance levels: 1.1728, 1.1766
Support levels: 1.168, 1.164, 1.159
A false breakdown of the specified support zone could change the market imbalance and attract buyer interest, which could generally support the bullish trend.
Best regards, R. Linda!
EURUSD Weakened By New Tariff Tensions With US This is the Weekly FOREX Forecast for the week of July 14 - 18th.
In this video, we will analyze the following FX market: EURSUD
The latest headlines tell the story. The tariffs are triggering a slow run to the USD safe haven. The previous week showed the USD Index closed pretty strong. There's a good chance we'll see more of the same this coming week.
Look for the strength in USD to continue to be supported by fundamental news, and outperform the other major currencies, including the EURO.
Buy USD/xxx
Sell xxx/USD
Enjoy!
May profits be upon you.
Leave any questions or comments in the comment section.
I appreciate any feedback from my viewers!
Like and/or subscribe if you want more accurate analysis.
Thank you so much!
Disclaimer:
I do not provide personal investment advice and I am not a qualified licensed investment advisor.
All information found here, including any ideas, opinions, views, predictions, forecasts, commentaries, suggestions, expressed or implied herein, are for informational, entertainment or educational purposes only and should not be construed as personal investment advice. While the information provided is believed to be accurate, it may include errors or inaccuracies.
I will not and cannot be held liable for any actions you take as a result of anything you read here.
Conduct your own due diligence, or consult a licensed financial advisor or broker before making any and all investment decisions. Any investments, trades, speculations, or decisions made on the basis of any information found on this channel, expressed or implied herein, are committed at your own risk, financial or otherwise.

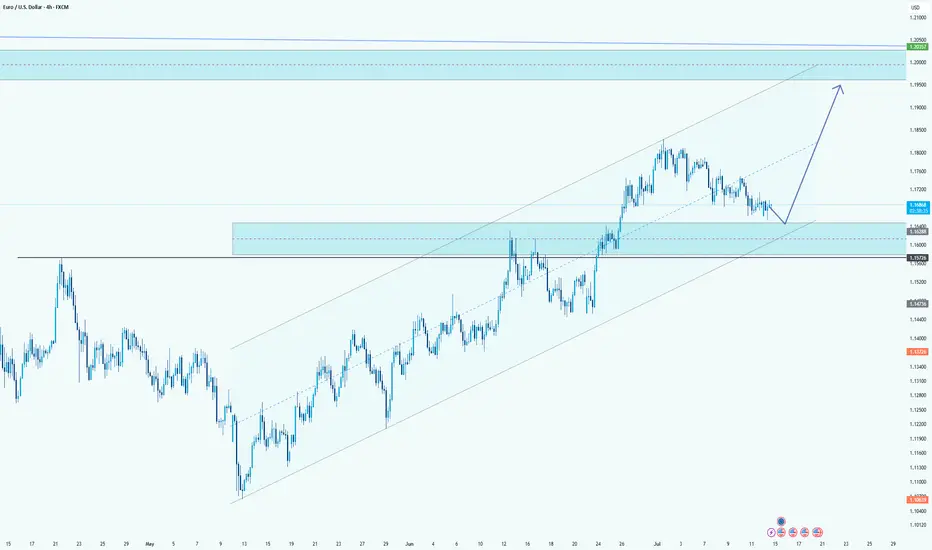
EUR/USD Retracement Into Demand ZoneHello guys!
EUR/USD is currently undergoing a healthy retracement after an extended bullish trend within the ascending channel. The price is now approaching a key demand zone, which aligns perfectly with the mid-line of the channel structure.
This zone previously acted as a strong resistance area and is now expected to serve as support, confirming a classic flip in market structure. The reaction around the 1.16288 - 1.15774 area will be crucial.
If buyers step in here, the bullish momentum is likely to resume with the next major target being the upper resistance zone near 1.20000 , as projected by the upward arrow. The overall structure remains bullish as long as the price holds above the channel support and doesn't close below the last demand zone.