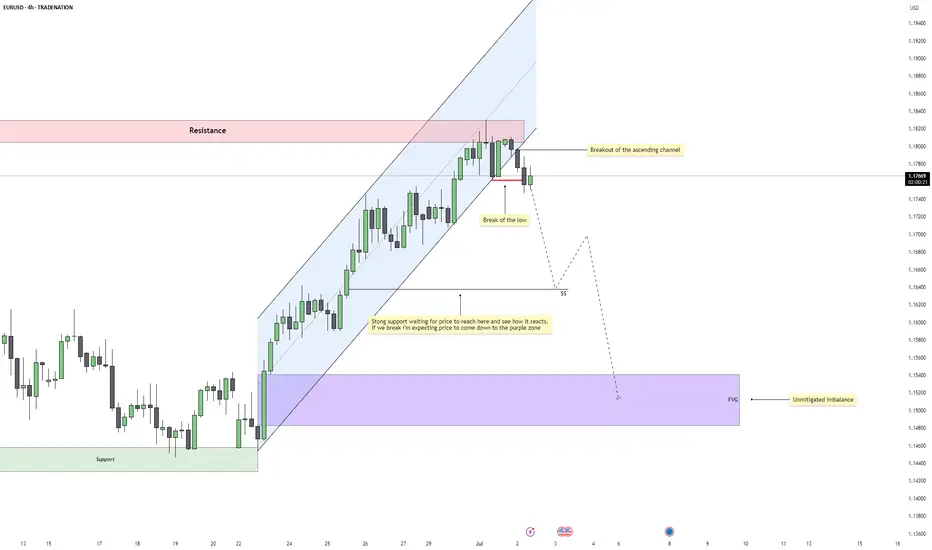
EURUSD – Bearish Reversal Confirmed After Structural BreakEURUSD has shifted out of its bullish environment after a sustained rally inside a clean ascending channel. Price recently rejected a resistance zone that capped previous buying pressure and has now started to rotate downward. This marks the first serious challenge to the trend and sets the tone for a potential bearish phase.
Channel Breakdown and Price Behavior
The ascending channel had been respected for several sessions, guiding price upward with consistent higher highs and higher lows. The recent breakdown from this structure is significant, as it shows the market is no longer willing to support higher prices within that controlled environment. This type of breakout often signals a loss of momentum and increased volatility in the opposite direction.
Break of the Low and Shift in Structure
After breaking the channel, price also took out a major internal low, which had previously held during retracements. This is a key signal of a structural shift, confirming that the uptrend has been interrupted. When price breaks a low that buyers had been defending, it shows sellers have stepped in with conviction and are likely aiming lower targets.
Short-Term Target and Reaction Zone
The first area of interest sits just below current price where a support shelf and price inefficiencies line up. This zone, marked with the dollar sign symbol on the chart, may attract a short-term reaction. If buyers are still present, this is where they would likely try to step in. However, the rejection from resistance and the structural break suggest this level could eventually give way.
Imbalance Zone Below and Liquidity Target
If that support fails, the next high-probability draw is the large untested imbalance sitting further below. This zone has remained untouched since the rally began and represents unfinished business for the market. Price often seeks out these inefficiencies, especially after trend shifts, making it a natural target for sellers if momentum continues.
Conclusion
EURUSD is showing clear signs of bearish pressure after rejecting resistance, breaking structure, and leaving behind unmitigated downside targets. As long as we remain below the broken low, the path of least resistance points lower. The imbalance zone below remains the key destination unless the market shows signs of reversal higher.
Disclosure: I am part of Trade Nation's Influencer program and receive a monthly fee for using their TradingView charts in my analysis.
___________________________________
Thanks for your support!
If you found this idea helpful or learned something new, drop a like 👍 and leave a comment, I’d love to hear your thoughts! 🚀
EURUSD trade ideas
EURO - Price can continue to grow inside rising channelHi guys, this is my overview for EURUSD, feel free to check it and write your feedback in comments👊
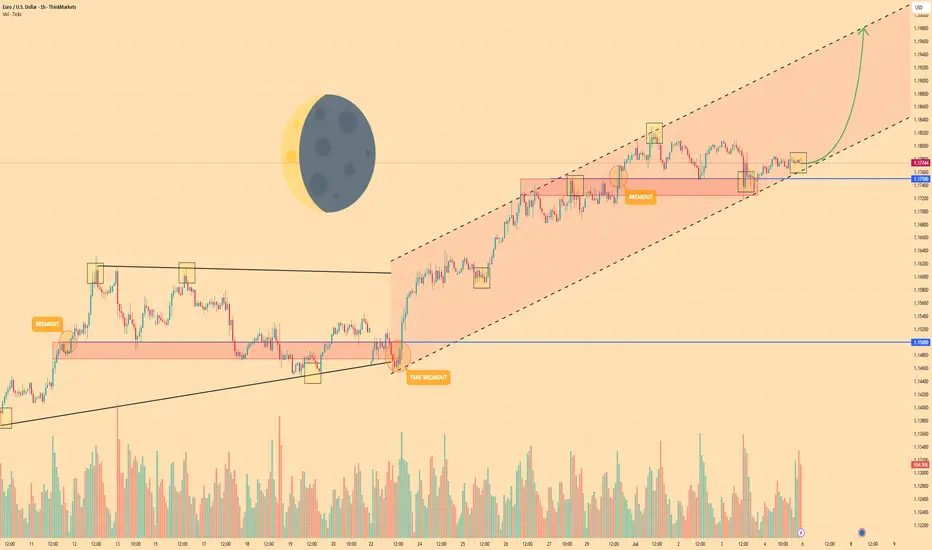
The price traded in a flat range between $1.1500 and $1.1750 for an extended period, testing both extremes multiple times with low volatility and indecision.
A breakout above $1.1750 initially looked promising but turned into a fakeout when sellers quickly pushed the price back below $1.1725, trapping aggressive longs.
After that shakeout, buyers regained control and propelled EUR into a rising channel, marked by higher highs and higher lows since the end of June.
Price has since respected the lower boundary of this rising channel near $1.1725–$1.1750, using it as reliable support for continued gains.
With two confirmed breakouts and the channel structure intact, bullish momentum suggests the pair can extend its move higher within the channel.
I expect Euro to continue climbing toward the next key resistance at $1.1980, where the upper channel line and structural supply zone converge.
If this post is useful to you, you can support me with like/boost and advice in comments❤️
Disclaimer: As part of ThinkMarkets’ Influencer Program, I am sponsored to share and publish their charts in my analysis.
EURUSD I Monday CLS I Model 1Hey, Market Warriors, here is another outlook on this instrument
If you’ve been following me, you already know every setup you see is built around a CLS Footprint, a Key Level, Liquidity and a specific execution model.
If you haven't followed me yet, start now.
My trading system is completely mechanical — designed to remove emotions, opinions, and impulsive decisions. No messy diagonal lines. No random drawings. Just clarity, structure, and execution.
🧩 What is CLS?
CLS is real smart money — the combined power of major investment banks and central banks moving over 6.5 trillion dollars a day. Understanding their operations is key to markets.
✅ Understanding the behavior of CLS allows you to position yourself with the giants during the market manipulations — leading to buying lows and selling highs - cleaner entries, clearer exits, and consistent profits.
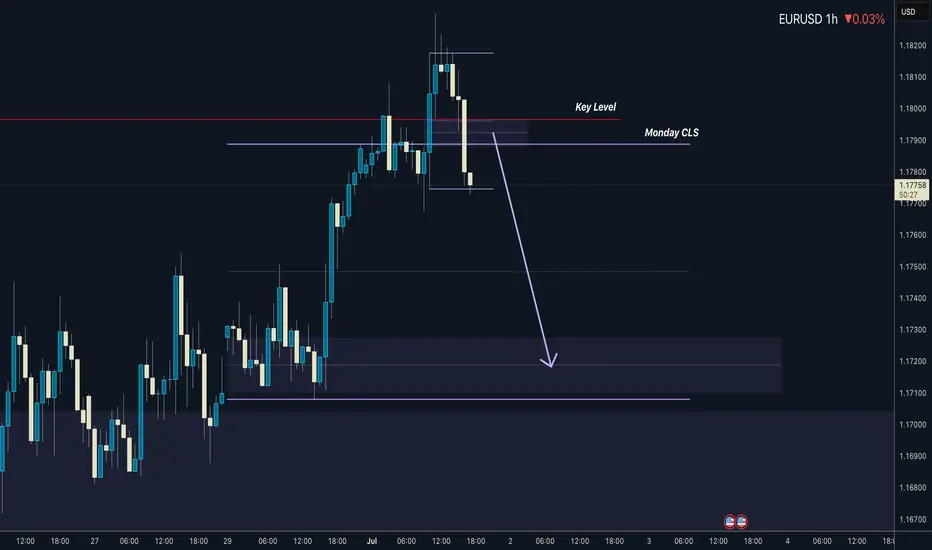
📍 Model 1
is right after the manipulation of the CLS candle when CIOD occurs, and we are targeting 50% of the CLS range. H4 CLS ranges supported by HTF go straight to the opposing range.
"Adapt what is useful, reject what is useless, and add what is specifically your own."
— David Perk aka Dave FX Hunter ⚔️
👍 Hit like if you find this analysis helpful, and don't hesitate to comment with your opinions, charts or any questions.
How to Trade Liquidity Sweep in Forex Market (SMC Trading)
I will show you a real example of trading liquidity sweep with Smart Money Concepts.
You will learn the essential SMC liquidity basics, a simple and profitable strategy to identify and trade liquidity sweep.
I will share with you an accurate entry confirmation signal that works perfectly on any Forex pair.
Liquidity Basics
In order to trade liquidity sweeps profitably, you should learn to identify significant liquidity zones.
To spot them, analyze a historic price action and find clusters of important historic key levels.
Examine a price action on EURUSD on an hourly time frame.
I underlined multiple horizontal key levels.
The price respected each level, found support on them, and rebounded.
What is so specific about these levels is that they are lying close to each other, composing a liquidity cluster.
That fact that EURUSD strongly bounced from these levels suggests that buying interest and high buying volumes were concentrated around them.
We can unite these levels and treat them as a single demand zone that has just been broken and turned into a supply zone.
After we found a valid liquidity zone, we can look for a liquidity sweep.
First, we should let the price approach that area and look for a specific price behavior then.
That is a perfect example of a liquidity sweep.
You can see that the price formed a wide range candle with a long tail.
Its high went way beyond the underlined area, but its body closed within.
In order to understand, why a liquidity sweep occurred, let's zoom in our chart and try to understand a behavior of the market participants.
Our supply zone concentrated selling orders , we assume that sellers were placing their orders across its entire length.
Their stop losses were presumably lying above that area.
Smart Money know that and with a liquidity sweep they manipulate the market, making sellers close their positions in a loss (buying back their positions from the market) and providing a liquidity for big players.
After a formation of a such a candlestick, a reliable confirmation of a saturation of the Smart Money is a formation of a strong bearish candle - a clear sign of strength of the sellers.
A bearish engulfing candle above confirmed a completion of a liquidity sweep and indicates a highly probable bearish continuation.
Your perfect sell entry is immediately after a close of such a candlestick.
Stop loss should strictly lie above the high of a liquidity sweep.
Take profit is based on a local low.
Look, how quickly the price reached the goal.
Your strategy of trading liquidity sweeps of demand zones is absolutely the same.
Let the price test a demand zone, wait for a formation of wide range bearish candle with a tail going below its lows.
Wait for a bullish imbalance candle and buy immediately then.
Stop loss will be below the low of a liquidity sweep, take profit - a local high.
This SMC strategy works on any time frame and can be applied for trading any Forex pair, Gold, Silver, Crypto and commodities.
Try it by your own and let me know your results.
❤️Please, support my work with like, thank you!❤️
I am part of Trade Nation's Influencer program and receive a monthly fee for using their TradingView charts in my analysis.
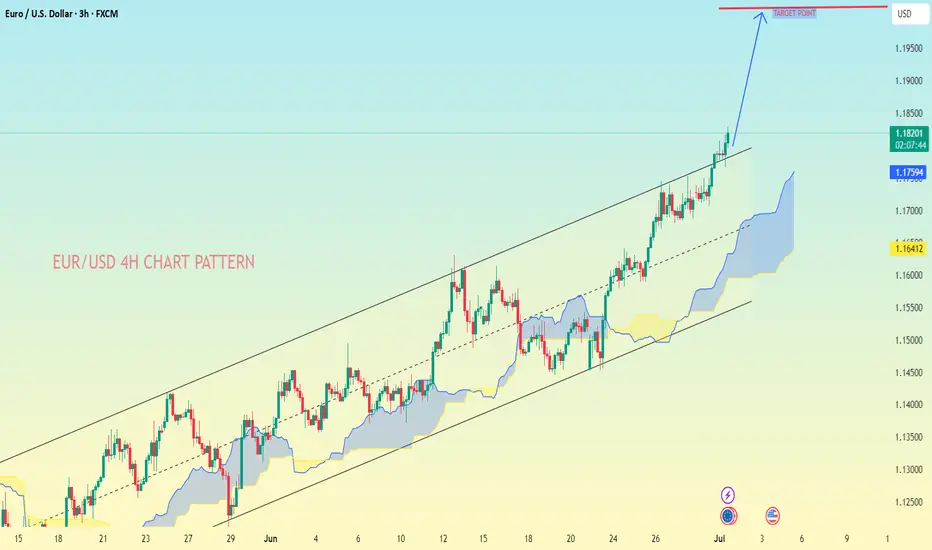
EUR/USD 4H Chart Pattern, here's the analysis..Looking at My EUR/USD 4H Chart Pattern, here's the analysis:
Current Price:
Around 1.1819
Observations:
Price is moving inside an ascending channel
Breakout from the upper channel line is happening
Ichimoku Cloud shows bullish momentum as price is well above the cloud
---
Target Levels:
✅ First Target Zone: 1.1900 - 1.1950
✅ Final Target Zone: 1.2000 - 1.2020 (as marked on your chart)
---
Notes:
Watch for strong breakout confirmation above 1.1850
If momentum continues, price can reach 1.2000
Use stop-loss below 1.1750 to manage risk
---
If you want, I can help suggest stop-loss, entry, and risk management in detail. Let me know!
EURUSD Potential UpsidesHey Traders, in today's trading session we are monitoring EURUSD for a buying opportunity around 1.17600 zone, EURUSD is trading in an uptrend and currently is in a correction phase in which it is approaching the trend at 1.17600 support and resistance area.
Trade safe, Joe.
EURO - After movement up, price will drop to support lineHi guys, this is my overview for EURUSD, feel free to check it and write your feedback in comments👊
Recently price started to grow inside a rising channel, where it some time traded below the support area and soon bounced up.
Price broke $1.1455 level and rose to the resistance line of the channel, after which it turned around and made correction movement.
Next, price some time traded near $1.1455 level and then bounced and continued to move up inside the channel.
In a short time Euro rose to $1.1700 level, which coincided with a support area, and some time trades between this level.
Then the price broke this level and continued to move up, until it almost reached the resistance line of the channel and started to fall.
Now, I think the Euro can rise a little and then continue to fall to $1.1610 support line of the channel, breaking $1.1700 level.
If this post is useful to you, you can support me with like/boost and advice in comments❤️
Disclaimer: As part of ThinkMarkets’ Influencer Program, I am sponsored to share and publish their charts in my analysis.
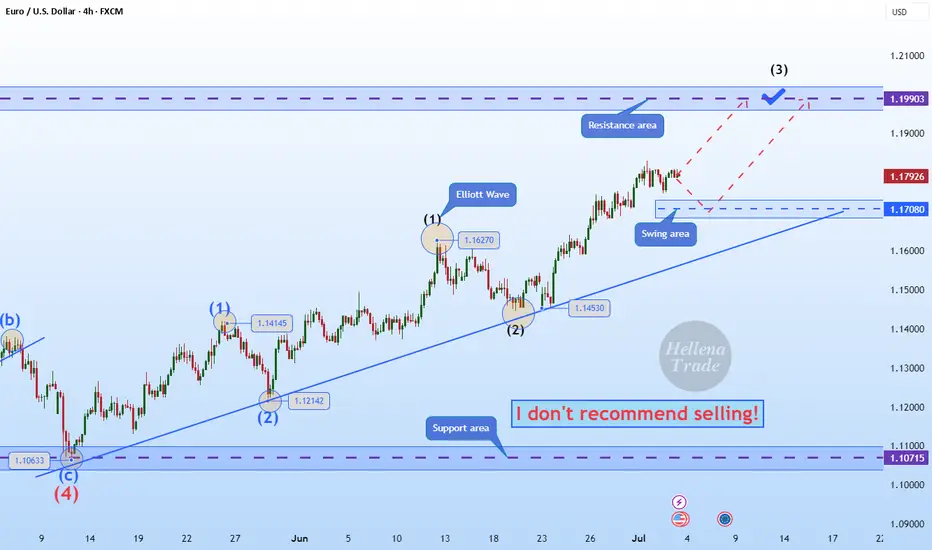
Hellena | EUR/USD (4H): LONG to the resistance area 1.20000.Colleagues, I believe that the upward impulse is not over yet. Wave “3” of the higher order and wave “3” of the lower order are just completing their movement, and I think that at the moment it is worth looking at the resistance area of 1.20000.
This is a very attractive psychological level where wave “3” could complete its upward movement.
Manage your capital correctly and competently! Only enter trades based on reliable patterns!
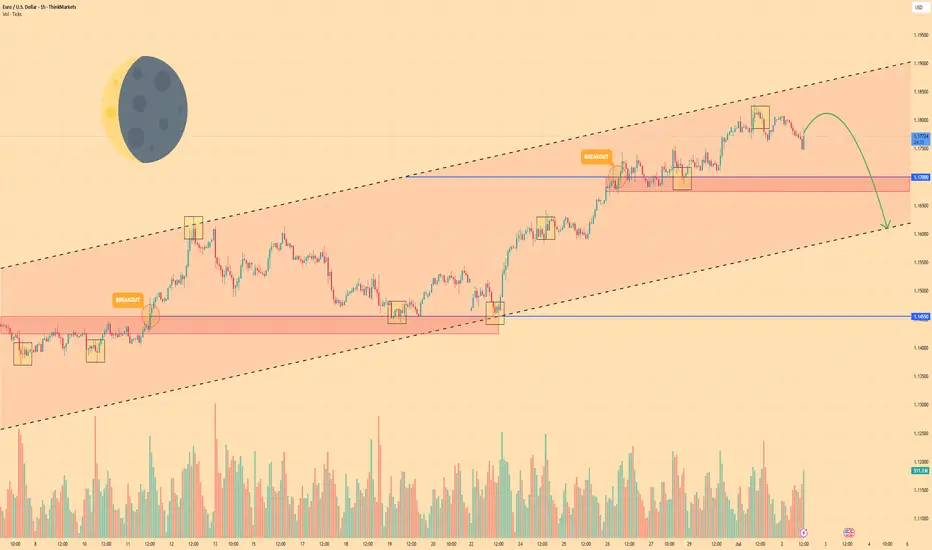
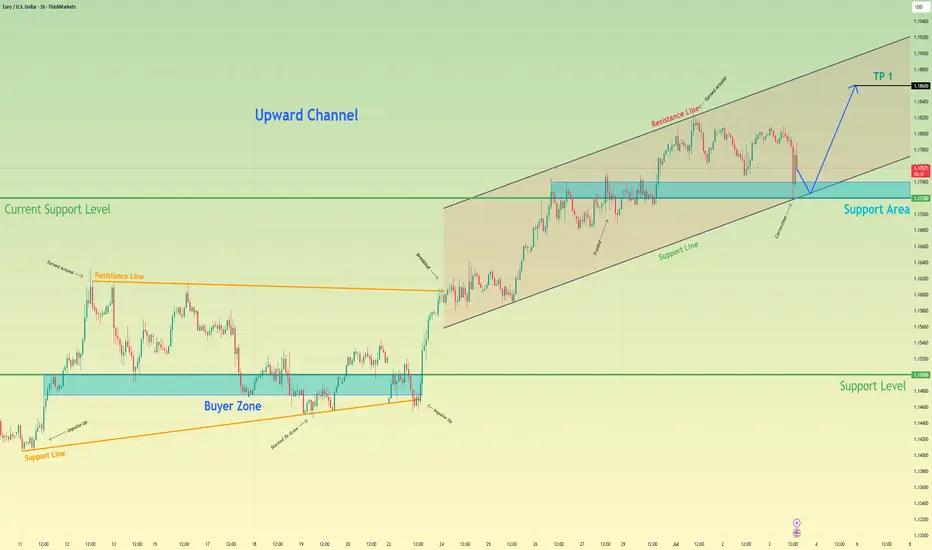
Euro can rebound up from support area to 1.1860 pointsHello traders, I want share with you my opinion about Euro. In this chart, we can see how the price has been moving confidently inside an upward channel after breaking out of a wedge formation. Previously, price consolidated within a narrowing wedge pattern above the buyer zone and broke upward, showing strong bullish momentum. That breakout initiated the current uptrend and led to the formation of a new support area. Now, price is pulling back from the resistance line of the channel and approaching this support area, which also coincides with the support line of the channel. This confluence increases the probability of a bullish reaction in this region. The structure suggests that buyers may step in around this level, preventing a deeper retracement. If the pair bounces off the support zone, I expect a continuation of the uptrend toward the upper boundary of the channel. For that reason, I set my TP at 1.1860 points, almost aligning with the resistance line of the channel. Given the current price action, the bullish structure, and strong reaction levels, I remain bullish and anticipate a rebound followed by further growth toward my target. Please share this idea with your friends and click Boost 🚀
Disclaimer: As part of ThinkMarkets’ Influencer Program, I am sponsored to share and publish their charts in my analysis.
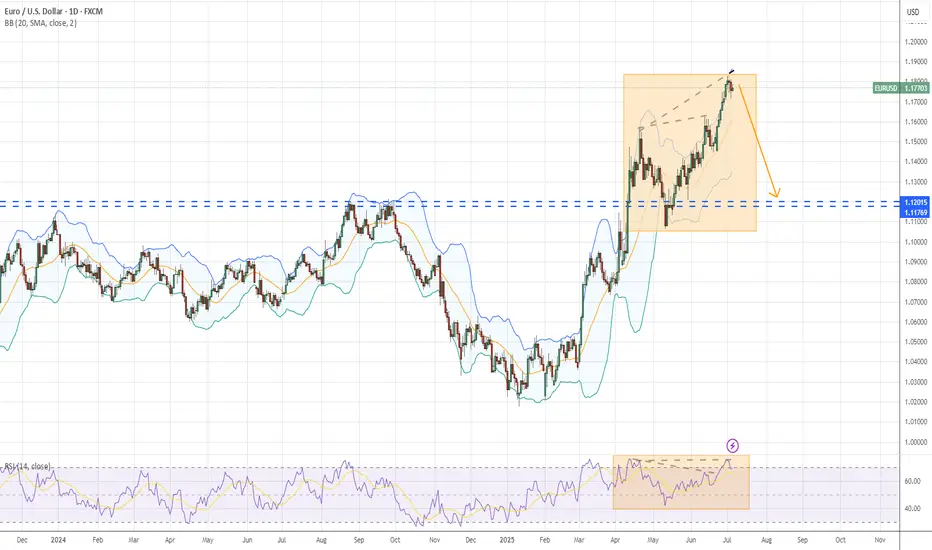
EURUSD ObservationCurrent status of EURUSD:
From the daily chart, it has diverged twice
It is no longer suitable to continue buying
Switch to a smaller period, like 4 hours, or 1 hour.
In fact, the hour head structure has appeared.
If it meets your entry criteria, you can try shorting
EURUSDEUR/USD Exchange Rate
EUR/USD: 1.17735
The euro has strengthened against the US dollar, trading near its highest level since early 2024, supported by a softer DXY and stable Eurozone outlook.
10-Year Government Bond Yields
Region 10-Year Yield Date
Eurozone 2.560% July 5, 2025
United States 4.348% July 5, 2025
The US 10-year Treasury yield remains above the Eurozone’s, but the gap has narrowed in recent months.
Central Bank Policy Rates
Central Bank Policy Rate Last Change/Status
ECB 2.00% (Deposit Rate) Cut by 25 bps in June 2025
Federal Reserve 4.25%–4.50% Unchanged since Dec 2024
The ECB recently cut its deposit rate to 2.00% RFR 2.15% MLF 2.4%, its lowest in over two years, as inflation nears target and growth remains subdued.
The Fed has held its target range steady at 4.25%–4.50% since December 2024, with markets expecting possible cuts later in 2025 on cautious wait and see approach by feds
Rate and Yield Differentials
Metric US Eurozone Differential (US - Eurozone)
Policy Rate 4.25–4.50% 2.00% 2.25–2.50%
10-Year Bond Yield 4.35% 2.560% 1.79%
Yield Differential: The US 10-year yield exceeds the Eurozone’s by 1.79 percentage points, a key driver for capital flows and EUR/USD direction ,but strong euro zone economic outlook offset the yield and bond advantage giving the euro buy advantage .
Policy Rate Differential: The Fed’s policy rate is 2.25–2.50 percentage points higher than the ECB’s, though the gap is expected to narrow if the Fed cuts rates later this year.
Market Implications
EUR/USD: The narrowing yield and rate differentials have supported euro strength in recent weeks.
Bond Markets: US yields remain higher, but the Eurozone’s 10-year yield is at a multi-year high, reflecting persistent inflation and reduced ECB accommodation.
Central Bank Outlook: Both the Fed and ECB are expected to remain data-dependent, with further easing possible if economic conditions warrant.
The euro is currently strong against the dollar, with narrowing rate and yield differentials reflecting shifting monetary policy expectations and global economic condition.
#eurusd

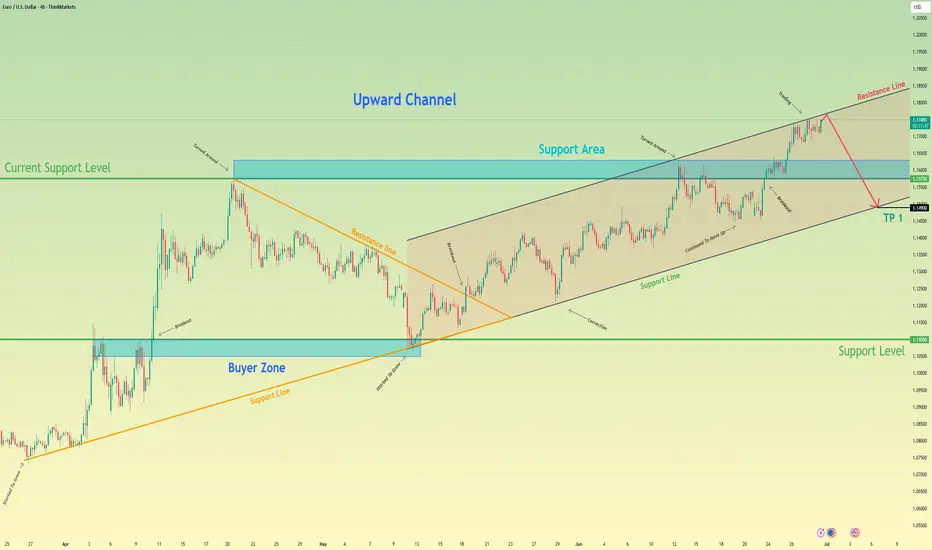
Euro will make correction to support line of channelHello traders, I want share with you my opinion about Euro. In this chart, we can see how the price entered to triangle, where it at once bounced from the support line and rose to the 1.1100 support level, which coincided with the buyer zone. Soon, price broke this level, after a small correction, and continued to move up to the 1.1575 current support level, which coincided with the support area. This area also coincided with the resistance line of the triangle, and the Euro rebounded from this line and started to decline. In a short time, it declined to the buyer zone, where it turned around and started to move up. Soon, Euro exited from triangle and continued to rise inside an upward channel, where it made a correction first and then continued to grow. Later, EUR rose to 1.1575 current support level, one more time and even almost broke it, but failed and corrected. But soon, it finally broke this level and rose to the resistance line of the channel, where at the moment it continues to trade near. In my mind, Euro will rebound from this line and go to the correction until to support line of the channel, breaking the support level. For this case, my TP is located near this line - at the 1.1490 points. Please share this idea with your friends and click Boost 🚀
Disclaimer: As part of ThinkMarkets’ Influencer Program, I am sponsored to share and publish their charts in my analysis.
Trading Recommendations and Analysis for EUR/USDOn the weekly chart, the price is approaching the upper boundary of the price channel, around the 1.1822 mark, from which a reversal of the entire trend may occur.
A divergence with the Marlin oscillator is ready for immediate formation. If the price breaks above the channel line, it will most likely be a false false breakout, invalidating the channel. Only a weekly candle close above the specified level, accompanied by the oscillator rising above the previous peak, would significantly complicate the technical picture for a trend reversal.
On the daily chart, a possible target in the event of a breakout above 1.1822 is the 1.1905 level - the resistance from 1.1822 is the 1.1905 level - the resistance from July - August 2021. On the four - hour chart, the Marlin oscillator does not support the price's bullish momentum.
For now, the trend remains upward, but we are preparing for a possible shift. The Nonfarm Payrolls, Independence Day, and "Liberation Day" (new tariffs) are just around the corner. Donald Trump may have a surprise in store.
EURUSD Sell analysis/ideaThis analysis is based on the 4-hour timeframe and executed using reversal trading and trend formation. complete explanation in the video!

EURO - Price can start to decline from resistance line of wedgeHi guys, this is my overview for EURUSD, feel free to check it and write your feedback in comments👊
Some days ago price grew to $1.1500 level and even broke it, after which started to decline in wedge.
Price declined to support line, breaking two levels, after which it turned around and started to move up.
Soon, EUR broke $1.1215 level and then rose more, after which made a correction to support line.
Then price in a short time rose to $1.1500 level, broke it one more time, and tried to grow more, but failed.
But recently it turned around and quickly rose to resistance line of wedge and now trades near.
In my mind, Euro can bounce from resistance line and fall to $1.1520 support line of wedge pattern.
If this post is useful to you, you can support me with like/boost and advice in comments❤️
Disclaimer: As part of ThinkMarkets’ Influencer Program, I am sponsored to share and publish their charts in my analysis.

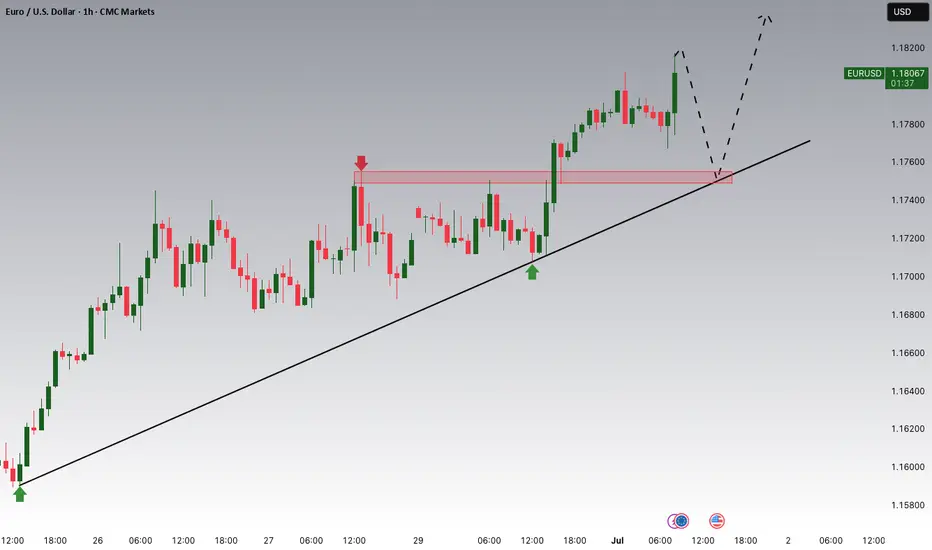
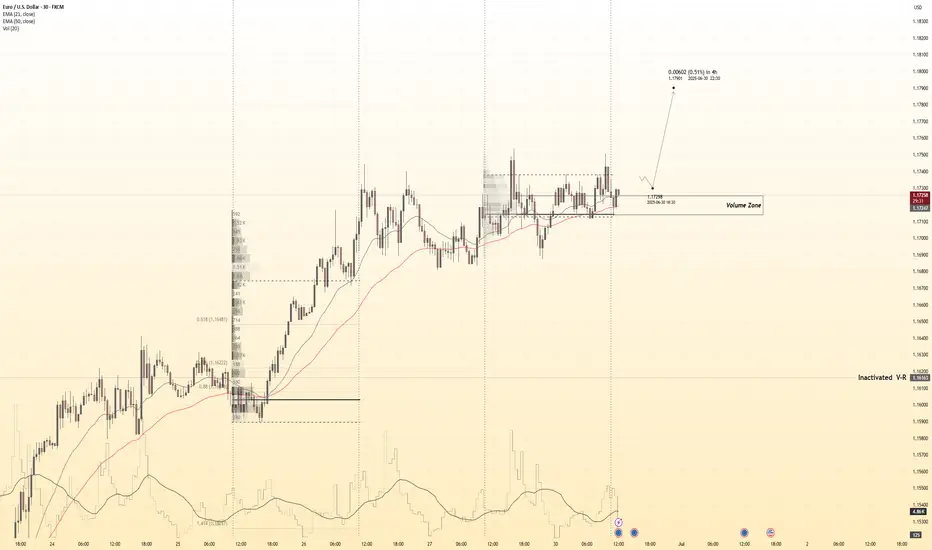
EURUSD 30M Engaged ( Bullish Entry's Detected )————-
➕ Objective: Precision Volume Execution
Time Frame: 30-Minute Warfare
Entry Protocol: Only after volume-verified breakout
🩸 Bullish Wave Coming From : 1.17250
➗ Hanzo Protocol: Volume-Tiered Entry Authority
➕ Zone Activated: Dynamic market pressure detected.
The level isn’t just price — it’s a memory of where they moved size.
Volume is rising beneath the surface — not noise, but preparation.
🔥 Tactical Note:
We wait for the energy signature — when volume betrays intention.
The trap gets set. The weak follow. We execute.
EURUSD 30M Engaged ( Bullish Entry's Detected )
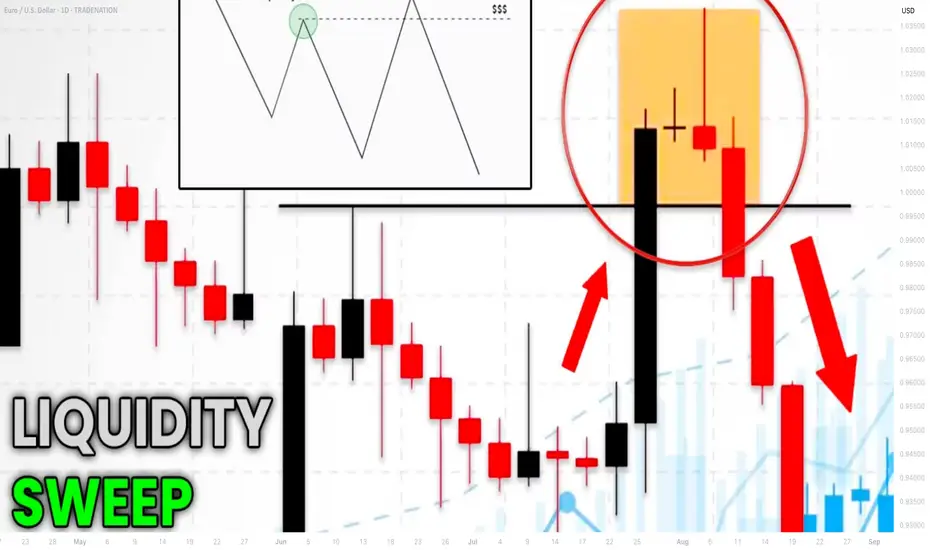
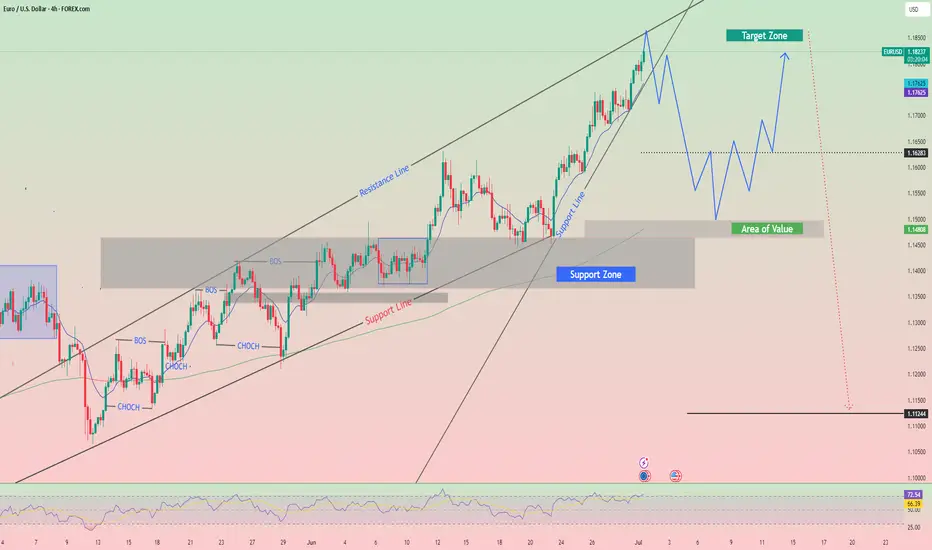
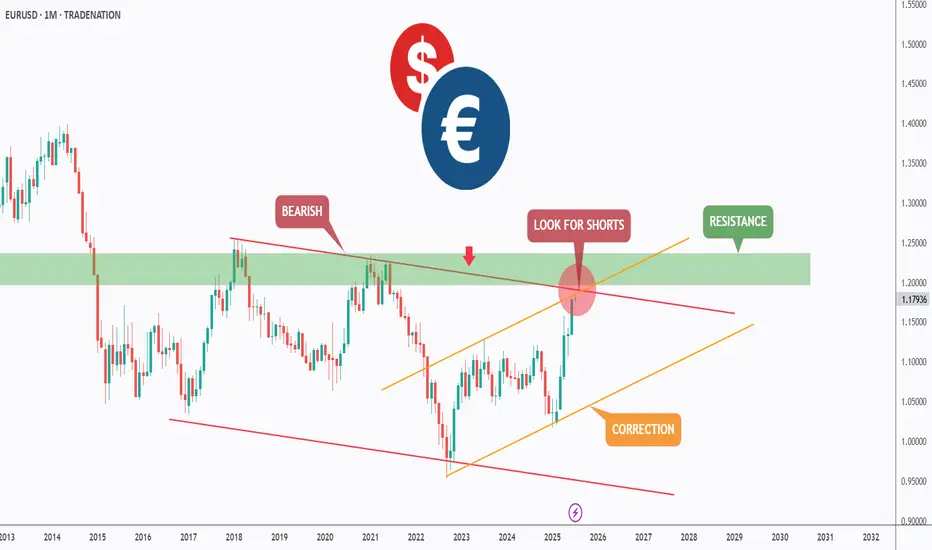
EURUSD - Macro Trend Shift Soon?Hello TradingView Family / Fellow Traders. This is Richard, also known as theSignalyst.
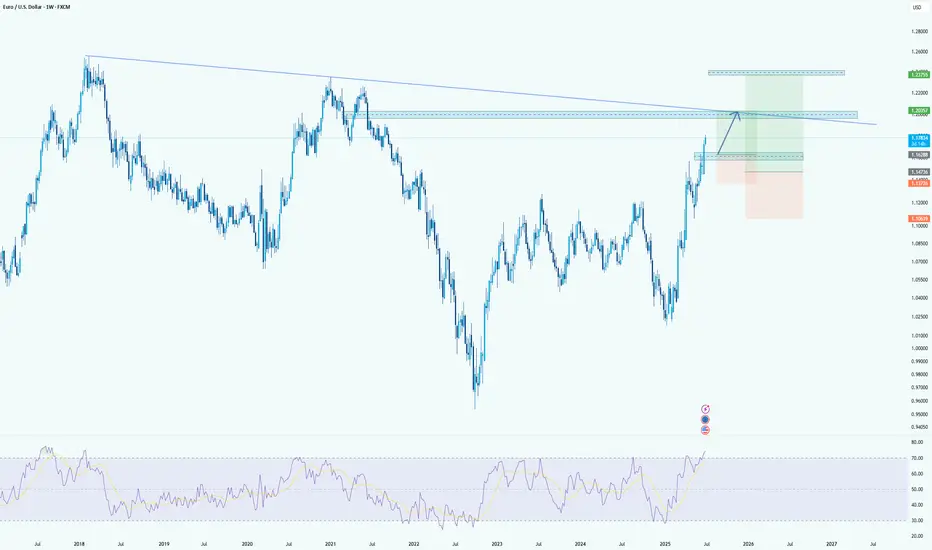
📈From a macro perspective, EURUSD has been bearish trading within the falling red channel.
Medium-term, EURUSD has been in a correction phase trading within the rising channel in orange.
Moreover, the green zone is a massive monthly resistance.
🏹 Thus, the highlighted red circle is a strong area to look for sell setups as it is the intersection of the upper red and orange trendlines and resistance.
📚 As per my trading style:
As #EURUSD is around the red circle zone, I will be looking for bearish reversal setups (like a double top pattern, trendline break , and so on...)
📚 Always follow your trading plan regarding entry, risk management, and trade management.
Good luck!
All Strategies Are Good; If Managed Properly!
~Rich
Disclosure: I am part of Trade Nation's Influencer program and receive a monthly fee for using their TradingView charts in my analysis.
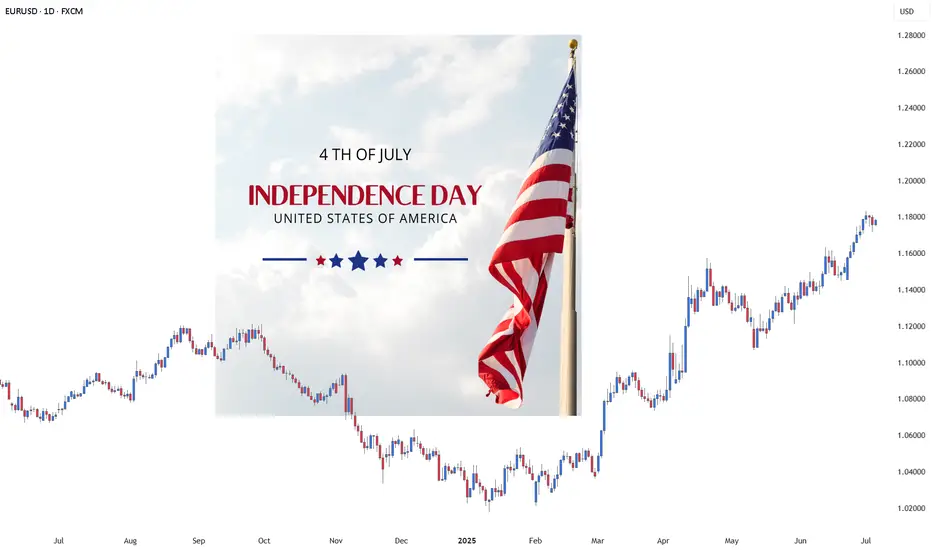
How to Trade the Forex Market on Memorial & Independence days?Trading the foreign exchange (Forex) market on major U.S. holidays like Memorial Day (May 29th) and Independence Day (July 4th) presents a unique set of challenges and requires a strategic shift from typical trading days. While the global Forex market remains technically open 24/5, the closure of U.S. banks and financial institutions leads to significantly reduced liquidity and trading volume, altering the market landscape.
Here’s a comprehensive guide on how to approach Forex trading on these holidays:
Understanding the Market Conditions: The "Quiet" Danger
The primary characteristic of Forex trading on U.S. holidays is a sharp drop in liquidity, especially in currency pairs involving the U.S. dollar (USD). With American traders and institutions away from their desks, the volume of transactions plummets. This "quiet" market environment can be deceptive and carries specific risks:
Wider Spreads: With fewer market participants, the difference between the bid and ask prices for currency pairs tends to increase. This makes it more expensive to enter and exit trades, eating into potential profits.
Increased Volatility and Spikes: Don't mistake low volume for a flat market. With a thin order book, even moderately sized orders can cause sharp, sudden price movements or "spikes." These moves can be unpredictable and may not follow typical technical patterns.
Price Gaps and Slippage: The reduced liquidity can lead to price gaps, where the market jumps from one price to another without trading at the levels in between. This increases the risk of slippage, where your order is executed at a less favorable price than intended.
Ineffectiveness of Some Strategies: Strategies that rely on high volume and momentum, such as breakout trading, are more likely to fail. A perceived breakout may lack the follow-through to become a sustained trend.
Strategic Approaches for Trading on Memorial Day and July 4th
Given the unique market conditions, traders should adopt a cautious and well-considered approach. Here are several strategies to consider:
1. The Prudent Approach: Step Aside
For many traders, particularly novices, the most sensible strategy is to avoid trading altogether on these holidays. The increased risks and unpredictable market behavior can easily lead to unnecessary losses. Consider these days as an opportunity to study the markets, refine your overall trading plan, or simply take a break.
2. Trade with Reduced Size and Realistic Expectations
If you do choose to trade, it is crucial to adjust your risk management:
Lower Your Position Sizes: This is the most critical adjustment. Trading with smaller lots will mitigate the potential impact of sudden price spikes and wider spreads.
Adjust Profit Targets and Stop-Losses: Be realistic about potential gains. The market may not have the momentum for large moves. Consider setting smaller profit targets. At the same time, be mindful that tighter stop-losses can be easily triggered by short-term volatility.
3. Focus on Non-USD Currency Pairs
Since the holidays are U.S.-based, currency pairs that do not involve the U.S. dollar may be less affected, although a general decrease in global liquidity is still expected. Cross-currency pairs such as EUR/JPY, GBP/JPY, or AUD/NZD might exhibit more "normal" behavior than majors like EUR/USD or USD/JPY. However, remain vigilant for lower-than-usual volume across the board.
4. Employ Range-Bound Strategies
In low-liquidity environments, currencies often trade within a defined range. Strategies that capitalize on this behavior can be more effective than trend-following approaches. Look for well-established support and resistance levels and consider trading the bounces off these levels.
5. Be Wary of News from Other Regions
While the U.S. market is quiet, significant economic data or geopolitical news from other regions (Europe, Asia) can still impact the market. With low liquidity, the reaction to such news can be exaggerated. Stay informed about the global economic calendar.
A Day-by-Day Look
Memorial Day (Last Monday of May): This is a major U.S. holiday, and its impact will be felt throughout the 24-hour trading period. Expect very thin liquidity during the Asian and European sessions, which will worsen significantly during what would typically be the busy New York session.
Independence Day (July 4th): The impact of July 4th can sometimes extend beyond the day itself. Often, the trading day before (July 3rd) will also see reduced volume as traders close positions ahead of the holiday. On July 4th, expect market conditions similar to Memorial Day, with a significant drop in activity and the associated risks.
In conclusion, while the allure of a 24-hour market is a key feature of Forex, wisdom lies in recognizing when not to trade with your usual strategy and size. Approaching U.S. holidays like Memorial Day and Independence Day with caution, a revised strategy, and a keen awareness of the risks is paramount for preserving your trading capital. For most, these are days best spent on the sidelines.
Navid Jafarian
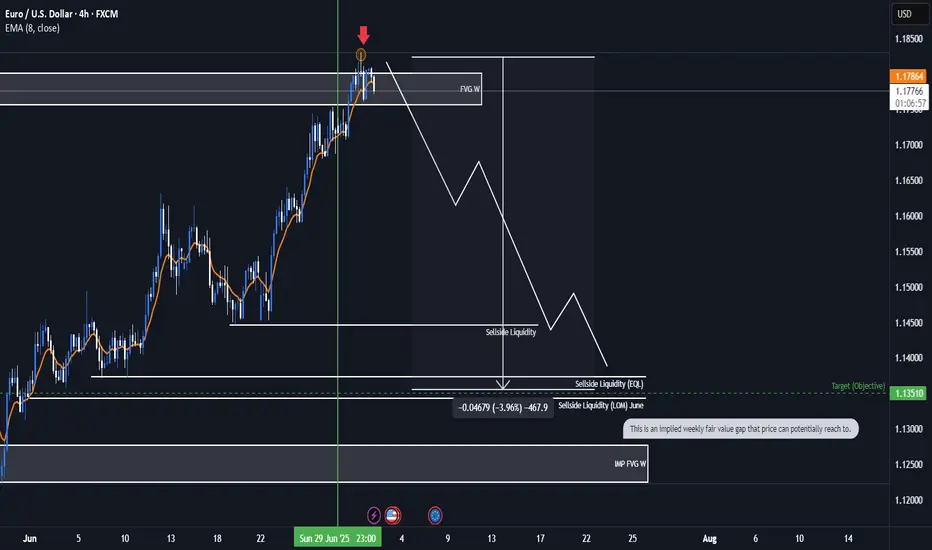
EURUSD Bearish ideaWe are in a weekly fair value gap that we have balance and potentially collected orders to prepare for a potential drop in price. We are anticipating a quarterly shift for the month of July were we could be targeting downside liquidity that is in open float.
* Fundamentals:
-Interest rate differentials shows us that USD interest rate of 4.5 is higher than the interest rate EUR 2.15 which lead to the longer fundamental frame work of price correcting to the higher dollar rate to the euro.
-The COT report also indicates to us that there is huge buying of Dollar by the commercials and a huge amount of selling of the EUR by commercials which can lead us to assume potential weaker dollar.
*Targeting:
-We are looking for the low of last month (June) to be taken out as well as even potentially reaching to the implied weekly fair value gap.
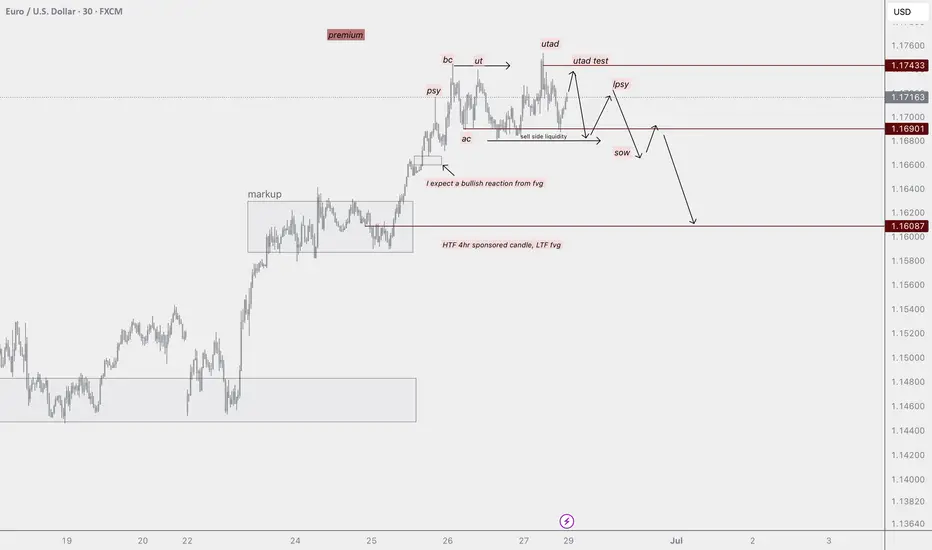
eurusd outlook Eurusd overall bullish HTF, however I do identify alignments within wyckoff distribution. Keeping an eye on the 4hr sponsored candle, ltf fvg at 1.62 area for my next possible bullish swing into the weekly high. Until then let's see if the market can support short term bearish reversal into the area of interest.
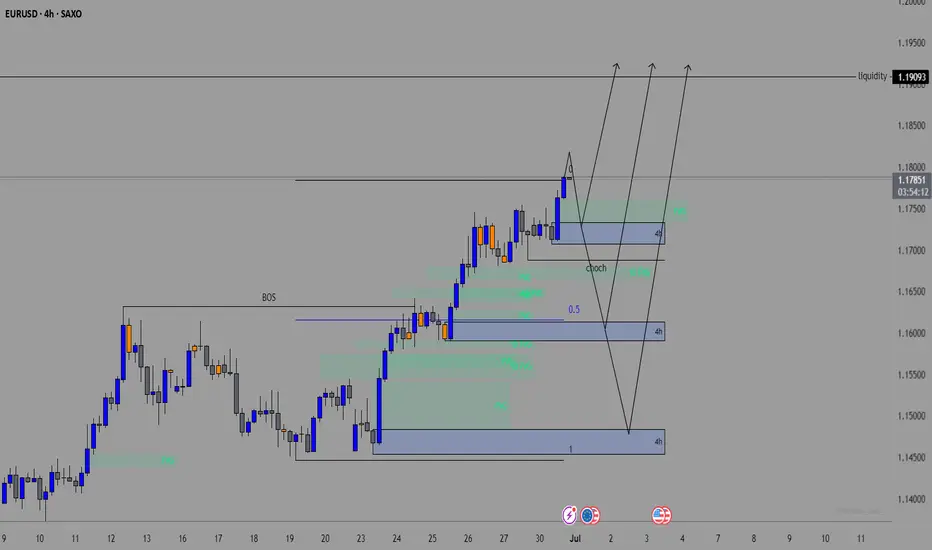
EURUSD OUTLOOK 1 - 4 JulyStill Bullish on EU. No Fundamental or technical reasons to be short.
We could have a short term pullback within the daily range to then continue long..
If we get that 4H pullback I will only long after getting a 4H technical confirmation.
EUR/USD – Smart Money Trap at 1.18? Massive Rejection Ahead 1. Technical Context
The pair has been moving inside a well-defined bullish channel since May, forming higher highs and higher lows. Price is currently hovering around 1.1718, approaching the upper boundary of the channel and a key weekly supply zone (1.1750–1.1850).
➡️ Potential scenario:
A short bullish extension toward 1.1780–1.1820 to trigger stop hunts, followed by a bearish rejection toward 1.1500, and potentially 1.1380.
The daily RSI is overbought (>70), suggesting a likely short-term correction.
2. Retail Sentiment
80% of retail traders are short, with an average entry around 1.1318.
This signals a liquidity cluster above current highs, increasing the likelihood of a fake bullish breakout followed by a sell-off.
➡️ Contrarian insight: Retail heavily short → market may push higher first to wipe them out before reversing lower.
3. COT Report – USD Index (DXY)
Non-commercials (speculators) increased their short exposure on USD (+3,134).
Commercials cut their short positions (-1,994), indicating a potential bottoming on the dollar.
➡️ Conclusion: USD strength could return soon → bearish pressure for EUR/USD.
4. COT Report – EUR FX
Non-commercials increased longs on EUR (+2,980) and sharply reduced shorts (-6,602) → market is now heavily net long.
Commercials remain net short (581,664 vs 417,363 longs).
➡️ Over-leveraged spec longs → vulnerable to downside squeeze if macro sentiment shifts.
5. Seasonality
June tends to be mildly bullish for EUR/USD.
July historically shows even stronger upward performance over the last 5–10 years.
➡️ Shorts are high risk in the very short term, but a bearish setup is likely in the second half of July, especially if price action confirms.
6. Trading Outlook
📍 Short-Term Bias: Neutral to bullish toward 1.1780–1.1820
📍 Mid-Term Bias: Bearish on rejection from supply area and break of channel
🎯 Key Levels:
1.1780–1.1850: critical decision zone (liquidity + weekly supply)
1.1500: first key support
1.1380: next downside target (demand zone + previous POC)
📌 Final Conclusion
The most likely play is a short setup from 1.1780–1.1850 on strong rejection, supported by:
Extreme retail positioning (80% short),
COT pointing to USD recovery,
Extended technical structure,
Overbought RSI on the daily chart.

EUR/USD Weekly – Two Long Setups Hello guys!
It is my perspective on eurusd!
Before we even reach the major resistance zone around 1.2050–1.2100, I’ve highlighted two long-term opportunities that may unfold as the price continues to climb.
✔ First Long Position:
It looks like a more conservative entry. The price is already above it. You can set a pending position!
It was likely aiming to catch the momentum as the price broke above the previous structure.
TP is near the descending trendline, around 1.2050–1.2100. a smart place to exit before major resistance hits.
✔ Second Long Position:
Positioned slightly lower. probably in case of a pullback or retest into the broken zone.
This one offers better risk-reward, but requires patience and a cleaner retracement.
Both longs are short-to mid-term swing ideas, aiming to ride the bullish leg into the bigger trendline rejection zone, where I’d personally be more cautious or even look for reversal setups.