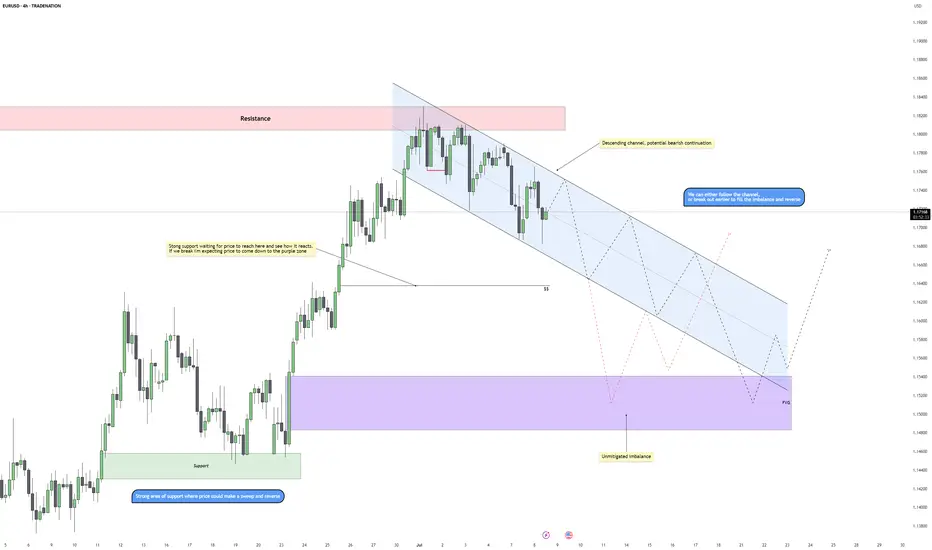
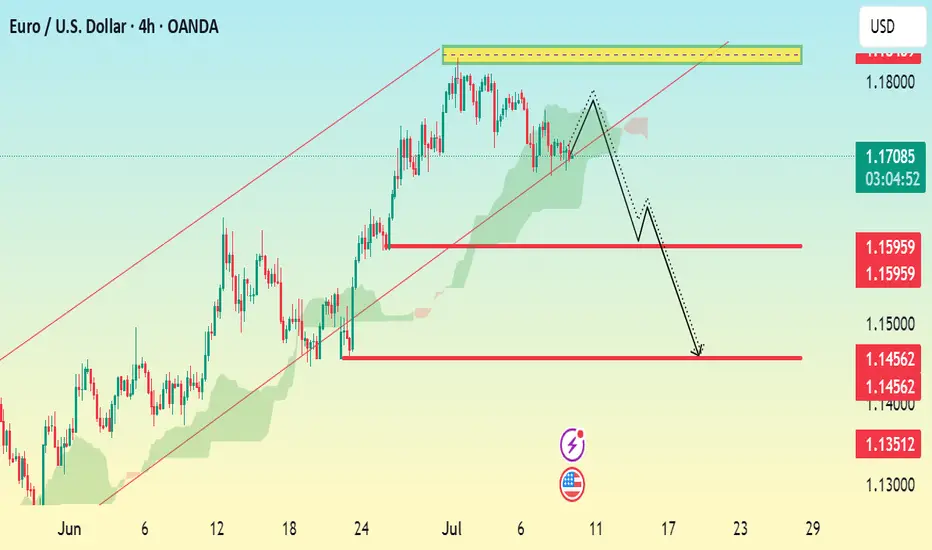
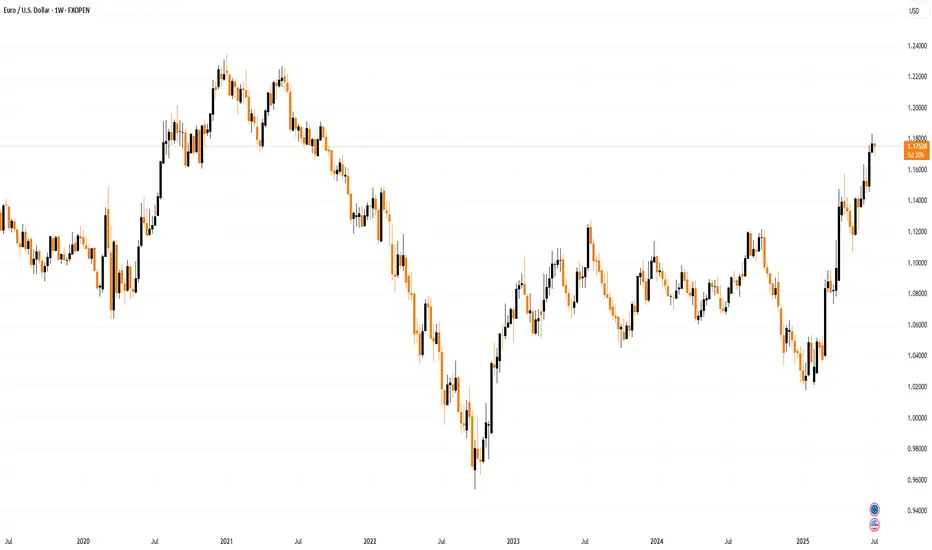
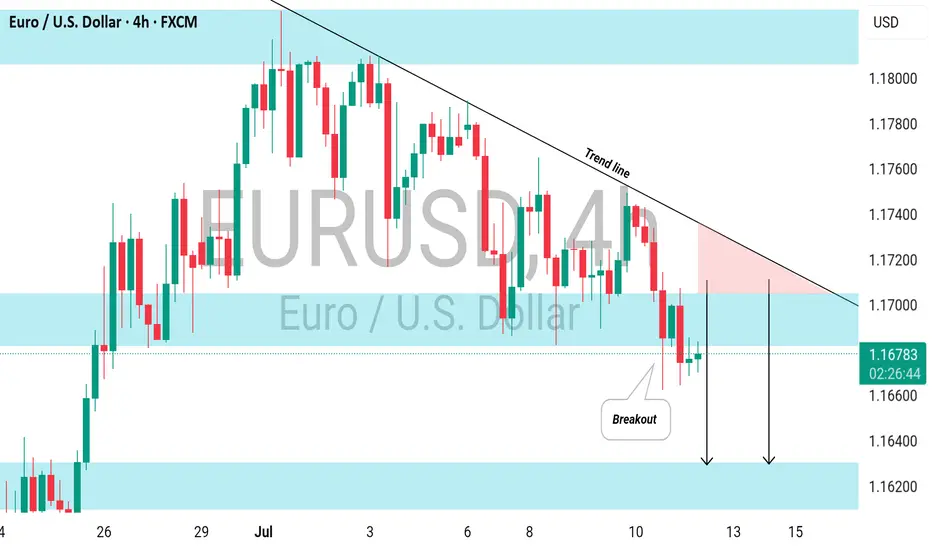
EURUSD - Compression Before Expansion? Key Reversal ZoneEURUSD is currently trading within a clear descending channel after rejecting a key resistance area. This move signals a shift in short-term sentiment, with bearish momentum guiding price action lower. The channel structure is intact, and as long as price respects this slope, lower levels remain in play.
Rejection From Resistance
After tapping into the major resistance zone, price failed to break higher and began forming lower highs and lower lows, confirming seller control. The rejection was clean and initiated the current bearish structure, which now serves as a roadmap for potential continuation lower.
Imbalance and Downside Targets
Below current price, there’s a visible imbalance that remains unfilled within the highlighted purple zone. This area acts as a magnet for price, especially if the bearish structure continues. A drop into this zone would align with a textbook move to fill inefficiency before a potential reversal can occur.
Support Structure and Liquidity Zone
There’s a strong support level marked just above the imbalance, which may offer a temporary reaction or even serve as a springboard for a reversal. This is also a likely liquidity pool, and a sweep of these lows could generate the fuel needed for a bullish move back toward mid-channel or even higher.
Projection and Scenarios
Price may either continue respecting the channel boundaries with stair-step retracements down into the imbalance, or break structure early with a more aggressive reversal once the inefficiency is filled. A deeper move into the purple zone followed by a reaction would suggest a potential shift in momentum.
Conclusion
The pair remains in a bearish corrective phase for now, with room to dip further into the unmitigated imbalance. Watch for how price reacts at support and whether a clean sweep and reversal setup presents itself. Until then, the channel remains the dominant structure guiding this move.
Disclosure: I am part of Trade Nation's Influencer program and receive a monthly fee for using their TradingView charts in my analysis.
___________________________________
Thanks for your support!
If you found this idea helpful or learned something new, drop a like 👍 and leave a comment, I’d love to hear your thoughts! 🚀
EURUSD trade ideas
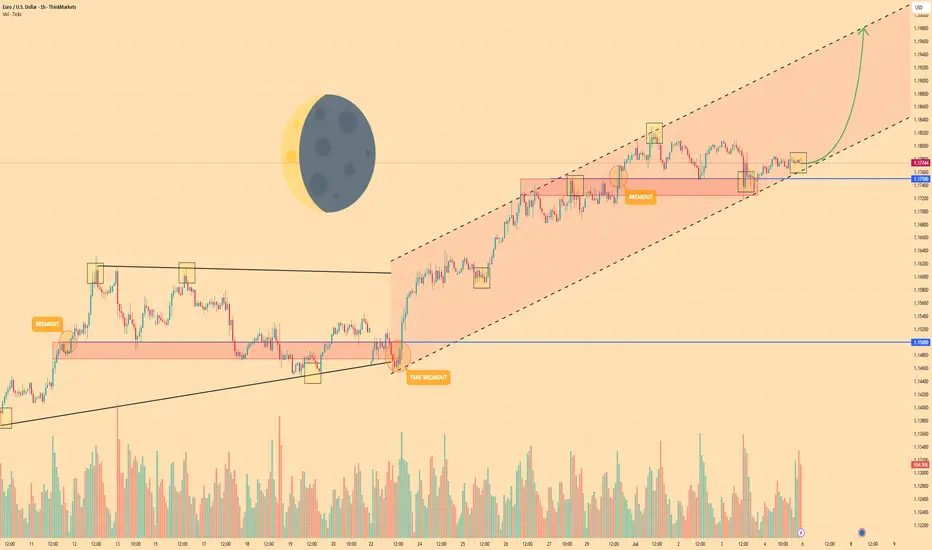
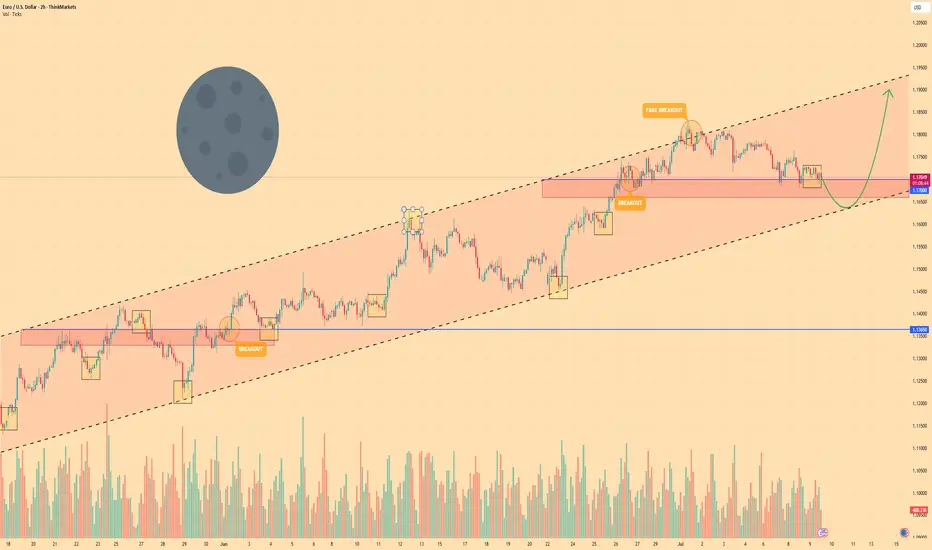
EURO - Price can continue to grow inside rising channelHi guys, this is my overview for EURUSD, feel free to check it and write your feedback in comments👊
The price traded in a flat range between $1.1500 and $1.1750 for an extended period, testing both extremes multiple times with low volatility and indecision.
A breakout above $1.1750 initially looked promising but turned into a fakeout when sellers quickly pushed the price back below $1.1725, trapping aggressive longs.
After that shakeout, buyers regained control and propelled EUR into a rising channel, marked by higher highs and higher lows since the end of June.
Price has since respected the lower boundary of this rising channel near $1.1725–$1.1750, using it as reliable support for continued gains.
With two confirmed breakouts and the channel structure intact, bullish momentum suggests the pair can extend its move higher within the channel.
I expect Euro to continue climbing toward the next key resistance at $1.1980, where the upper channel line and structural supply zone converge.
If this post is useful to you, you can support me with like/boost and advice in comments❤️
Disclaimer: As part of ThinkMarkets’ Influencer Program, I am sponsored to share and publish their charts in my analysis.
EURUSD is Approaching an Important Support!!Hey Traders, in today's trading session we are monitoring EURUSD for a buying opportunity around 1.16400 zone, EURUSD is trading in an uptrend and currently is in a correction phase in which it is approaching the trend at 1.16400 support and resistance area.
Trade safe, Joe.
EUR/USD Bearish Setup H4 Chart AnalysisMarket Structure:
Current Price: 1.17057
The market has rejected a key resistance zone around 1.17600–1.17800 (highlighted in yellow).
Price formed a lower high, suggesting bearish momentum is taking control after an uptrend.
The pair is trading around a key trendline and Ichimoku cloud, with a likely break below.
Bearish Signals:
1. Double Top / Lower High Formation near 1.17600 indicates potential reversal.
2. Bearish Projection Drawn: Expecting a drop after the neckline break.
3. Support Zones Marked:
First Support/TP1: 1.1650 – 1.1595
Second Support/TP2: 1.1456
Final Target/TP3: 1.1351
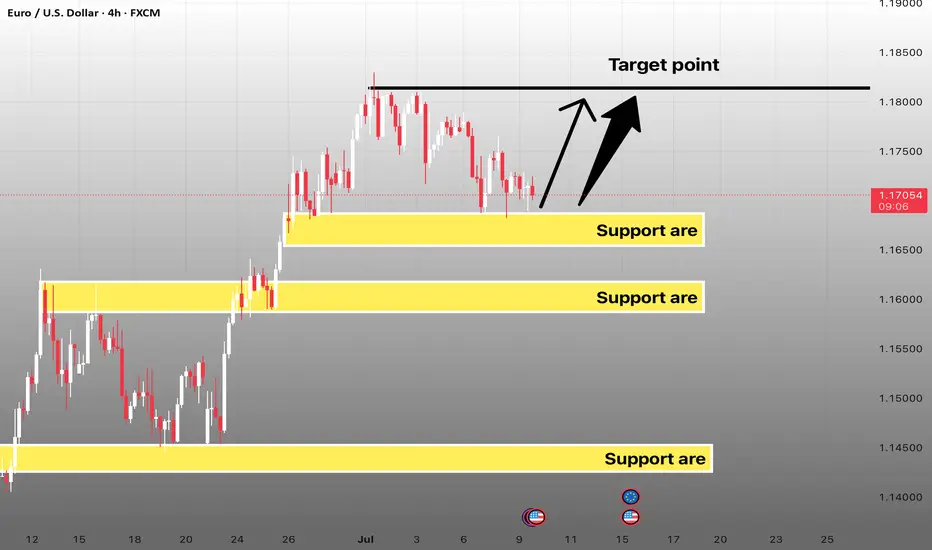
EURO - Price will continue to grow inside rising channelHi guys, this is my overview for EURUSD, feel free to check it and write your feedback in comments👊
Recently, price entered to rising channel, where it soon reached the support level, which coincided with the support area.
After this movement, the price broke this level, but soon turned around and corrected the support line of the channel.
Next, EUR went back to $1.1365 level and broke it again, after which it made a retest and continued to move up.
In a short time, EUR rose to the resistance line of the channel, made a correction, and then grew to $1.1700 support level.
Price broke this level too and reached the resistance line of the channel, but not long ago corrected.
At the moment, I expect that the Euro can correct to the support line of the channel and then rise to $1.1900
If this post is useful to you, you can support me with like/boost and advice in comments❤️
Disclaimer: As part of ThinkMarkets’ Influencer Program, I am sponsored to share and publish their charts in my analysis.
EURUSDHello Traders! 👋
What are your thoughts on EURUSD?
Following its recent rally, EURUSD has reached a key resistance zone, which also aligns with a trendline. The pair failed to break above this area and has been rejected.
Given the weak momentum and bearish reaction, we do not expect a breakout at this stage.
Instead, we anticipate some consolidation around the resistance, followed by a downward move toward the specified support level.
Don’t forget to like and share your thoughts in the comments! ❤️
#EURUSD: Last Bullish Price Extension! Get Ready! EURUSD is approaching our buying zone, a key level, which suggests a smooth bullish reversal. As this is a swing trade, we advise keeping stop losses larger. There are two targets to keep an eye on. Remember, this is not a guaranteed move, and this is just our overview. Good luck and trade safely.
Team Setupsfx_
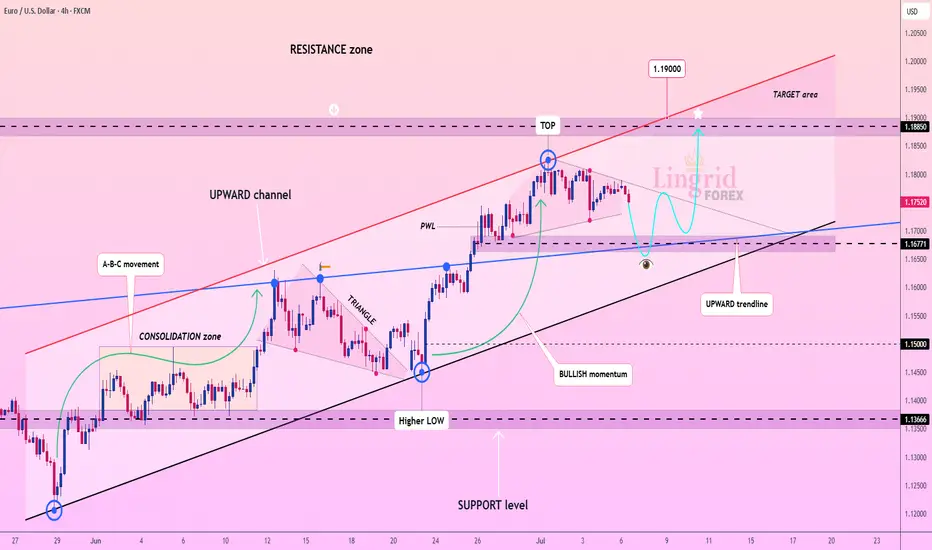
Lingrid | EURUSD Bullish Trend ContinuesFX:EURUSD is holding a bullish structure inside an upward channel after bouncing from the 1.1670 demand zone. The current retracement appears corrective, and buyers may step in again near the confluence of the trendline and horizontal support. If confirmed, the price is expected to push toward the 1.1885 resistance and the upper channel target at 1.1900.
📈 Key Levels
Buy zone: 1.1650–1.1680 (trendline + key support)
Sell trigger: break below 1.1600
Target: 1.1885 – 1.1900 zone
Buy trigger: bullish reversal candle near 1.1700
💡 Risks
Failure to hold trendline support could lead to deeper retracement
1.1885 may cap upside if momentum fades
Bearish divergence could emerge if price surges too fast
If this idea resonates with you or you have your own opinion, traders, hit the comments. I’m excited to read your thoughts!
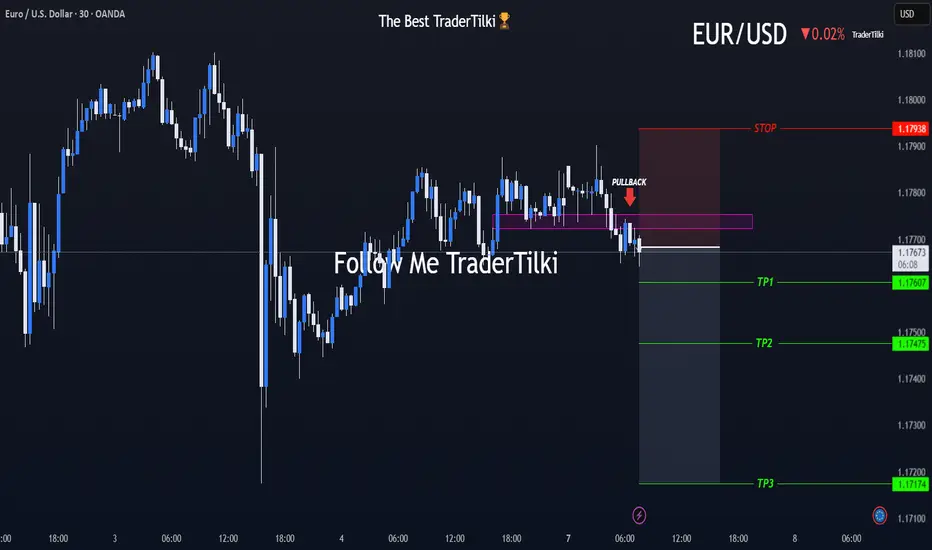
What’s EURUSD Telling Us on the 30-Minute Chart?🌅 Good morning, my friends,
EURUSD just made a pullback within the last 30 minutes, so I entered a sell position based on that move.
🎯 Targets:
- TP1: 1.17607
- TP2: 1.17475
- TP3: 1.17174
🛑 Stop Loss: 1.17938
📊 Risk/Reward Ratio: 2.00
Your likes and support are what keep me motivated to share these analyses consistently.
Huge thanks to everyone who shows love and appreciation! 🙏
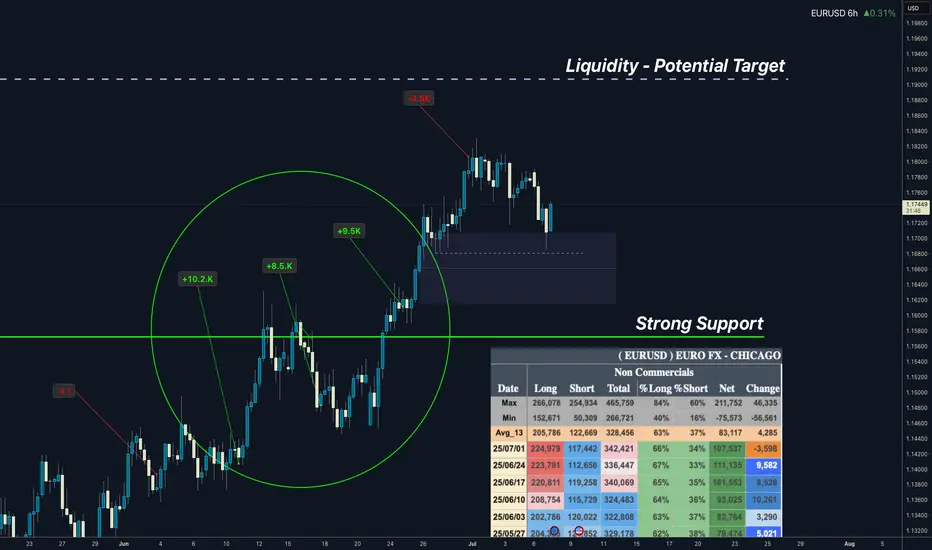
EURUSD COT and Liquidity AnalysisHey what up traders welcome to the COT data and Liquidity report. It's always good to go with those who move the market here is what I see in their cards. I share my COT - order flow views every weekend.
🎯 Non Commercials added significant longs which creates a strong support, we will most likely see higher prices over time.
📍Please be aware that institutions report data to the SEC on Tuesdays and data are reported on Fridays - so again we as retail traders have disadvantage, but there is possibility to read between the lines. Remember in the report is what they want you to see, that's why mostly price reverse on Wednesday after the report so their cards are hidden as long as possible. However if the trend is running you can read it and use for your advantage.
💊 Tip
if the level has confluence with the high volume on COT it can be strong support / Resistance.
👍 Hit like if you find this analysis helpful, and don't hesitate to comment with your opinions, charts or any questions.
Analysis done on the Tradenation Charts
Disclosure: I am part of Trade Nation's Influencer program and receive a monthly fee for using their TradingView charts in my analysis.
"Adapt what is useful, reject what is useless, and add what is specifically your own."
— David Perk aka Dave FX Hunter ⚔️
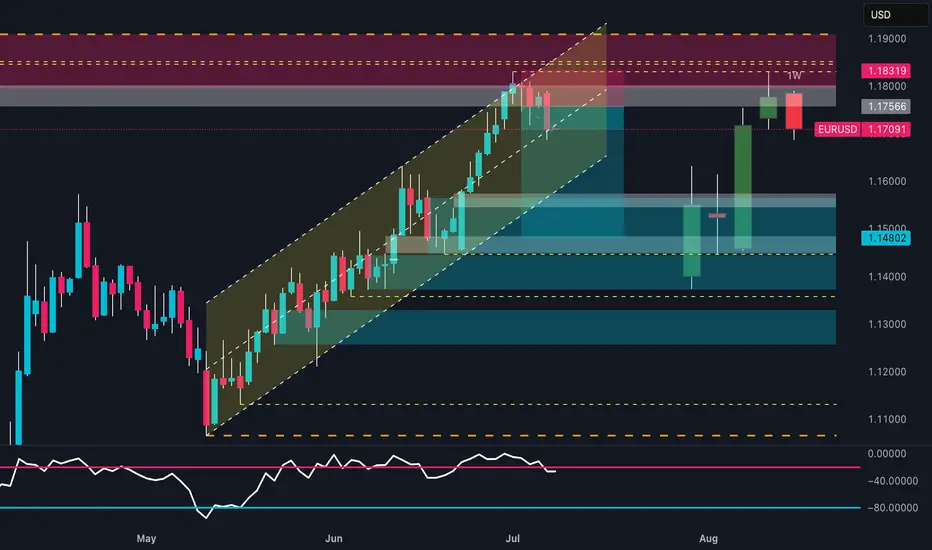
EUR/USD Reversal Ahead? COT + DXY Strength Signal Price has broken below the ascending channel that started in mid-May.
The current candle is rejecting the weekly supply zone (1.17566–1.18319), leaving a significant upper wick.
Daily RSI is losing strength but has not yet reached extreme levels.
A key daily Fair Value Gap (FVG) lies between 1.1600 and 1.1480, with the first potential downside target at 1.14802, which aligns with support and the FVG zone.
A deeper bearish continuation could push price towards 1.1350, but only if the FVG lows are clearly broken.
📊 COT Data (CME - Euro FX & USD Index)
Euro FX
Net long: +15,334
Commercials increased both longs (+13,550) and shorts (+9,913) → mild divergence.
Non-Commercials (speculators) increased shorts (+4,786) more than longs (+1,188) → speculative bias tilting bearish.
USD Index
Strong net long accumulation across all trader types: +4,597 net.
Non-Commercials added +3,590 longs, with only a minor increase in shorts.
→ USD strength continues, reinforcing potential weakness in EUR/USD.
🧠 Retail Sentiment
67% of retail traders are short EUR/USD → typically a contrarian bullish signal.
However, the price is already showing distribution, not accumulation, so we may see price push lower first to trap remaining retail longs, invalidating the contrarian signal in the short term.
📅 Seasonality
July is historically bullish, especially on the 2Y (+0.0142) and 10Y (+0.0106) averages.
However, the 15Y and 20Y averages show a much more moderate performance (+0.007 / +0.0025).
Based on current price action, the seasonal rally may have already played out with the run-up to 1.1830. A correction now seems likely, even if the broader macro remains supportive mid-term.
🧩 Conclusion
Despite historically bullish seasonality for July, both price action and COT data indicate distribution with early signs of reversal.
Retail sentiment is too skewed short for a major breakdown just yet, but the technicals support a short-term pullback toward more balanced levels.
USD strength from COT and DXY structure reinforces a corrective short bias for now.
Navigating the Complexities of Forex Swap RatesNavigating the Complexities of Forex Swap Rates
Forex swap rates, pivotal in currency trading, reflect the cost of holding a position overnight. This article unpacks swaps, offering clarity on their calculation and impact. Even seasoned traders may be confused with the complexity of swaps. It’s vital to learn about how these costs relate to effective strategy and fee management. Dive into the complexities of forex swaps and learn how they can influence decisions and overall performance in the ever-evolving trading world.
Understanding Forex Swap Rates
For traders, understanding forex market swap rates is crucial. A swap is essentially the interest differential paid or charged to a trader when they hold a position overnight. The concept hinges on the idea that when you trade currencies, you are effectively borrowing one currency to buy another. Hence, these rates come into play, reflecting the cost of the process.
The swap rate definition boils down to the interest rate difference between the two currencies involved in a trade. For instance, if you are going long in a pair like EUR/USD, the swap rate would be determined by the difference in interest rates set by the European Central Bank and the Federal Reserve. If the borrowing cost of the euro is lower than that of the dollar, holding the EUR/USD pair overnight would typically result in a charge. Conversely, if the euro has a higher borrowing cost, you might see your balance credited.
Calculating swaps involves a straightforward formula:
Swap rate = (Contract size × Interest differential) ÷ 365
This calculation takes into account the size of your position and the interest rate difference, providing a daily cost or gain for holding the position. Understanding these costs is vital when it comes to managing trading expenses and strategy in the forex market.
Key Elements Influencing Swap Rates
Several factors play pivotal roles in determining overnight swap rates in the forex market.
1. Interest Rate Differentials: The primary driver of overnight rates, interest differentials stem from the varying monetary policies of central banks. For example, if the Bank of England has a higher lending rate than the Federal Reserve, a buy trade in GBP/USD could mean earning for maintaining the position overnight.
2. Market Conditions: Economic stability, political events, and financial market volatility can significantly impact overnight charges. During periods of high volatility or geopolitical uncertainty, rates may fluctuate more dramatically, reflecting the increased market risk.
3. Liquidity: The level of liquidity in the market often influences overnight costs. In less liquid markets and less commonly traded pairs, higher swaps might be charged due to the increased cost of facilitating these trades.
4. Broker Policies: Different forex brokers might have varying policies and calculations for their own swaps. These differences usually arise from the brokers' own pricing structures, risk management strategies, and competitive positioning in the market. As such, traders should be aware that overnight charges vary from broker to broker.
Types of Forex Swaps
There are primarily two types of swaps that traders may encounter, each serving distinct purposes and offering unique implications for trading strategies.
1. Interest Swaps: These involve the exchange of interest payments between parties. In forex, it typically manifests as the fee a trader pays or receives for holding a position overnight. They directly impact the cost of maintaining open positions in different pairs.
2. Currency Swaps (Cross-Currency Swaps): Also known as a currency rate swap, this involves exchanging principal and interest payments in two different currencies. While less common in everyday retail forex activities, they are important in managing currency exposure and risk, particularly in hedging strategies. Currency swaps are used to secure a predetermined exchange rate for a specified currency amount while incorporating a benchmarked or fixed interest rate. This type is usually used by corporations or brokers.
Regarding fixed swap rates, they are less common in the forex market compared to the more prevalent floating swap rates. They’re often used in less volatile financial environments and typically find their application in long-term financial instruments or corporate finance rather than in the day-to-day trading of currencies.
Strategies for Managing Swap Rates
Management of swaps in forex involves several key strategies:
- Short-term Trading: By closing positions before the end of the trading day, traders can avoid incurring overnight fees altogether. It’s a so-called day trading since positions are typically closed by the end of the day.
- Hedging: Implementing hedging strategies may mitigate overnight fees. This involves opening opposite positions in correlated pairs, thus potentially balancing the amounts paid and received.
- Economic Calendar Awareness: Staying informed about major economic announcements and central bank decisions often helps traders anticipate changes in borrowing costs.
- Broker Selection: Choosing the right broker is critical. Selecting a broker with favourable rates might significantly reduce trading fees, especially for those holding long-term positions.
Practical Implications for Traders
Understanding and managing these charges has direct implications for traders' strategies and overall performance. Key considerations include:
- Carry Trading: A carry trade strategy entails borrowing in a currency with a lower interest rate and investing in another with a higher yield. Traders take advantage of the interest differential but must be mindful of potential fees.
- Rollover Costs: Traders holding positions overnight need to account for rollover costs, which can either erode or enhance returns, depending on the direction of the trade and the prevailing swap rates.
- Currency Exposure Management: Swap rates affect the overall cost of maintaining a position. Traders need to balance the potential advantages of holding a position against the charges incurred.
The Bottom Line
Mastering swap rates is a cornerstone of trade management. A thorough understanding may empower traders to navigate these costs and potentially improve their strategies. By carefully considering factors like interest differentials and broker policies, traders may manage their trades and overall performance more effectively.
This article represents the opinion of the Companies operating under the FXOpen brand only. It is not to be construed as an offer, solicitation, or recommendation with respect to products and services provided by the Companies operating under the FXOpen brand, nor is it to be considered financial advice.
EURUSD ObservationCurrent status of EURUSD:
From the daily chart, it has diverged twice
It is no longer suitable to continue buying
Switch to a smaller period, like 4 hours, or 1 hour.
In fact, the hour head structure has appeared.
If it meets your entry criteria, you can try shorting
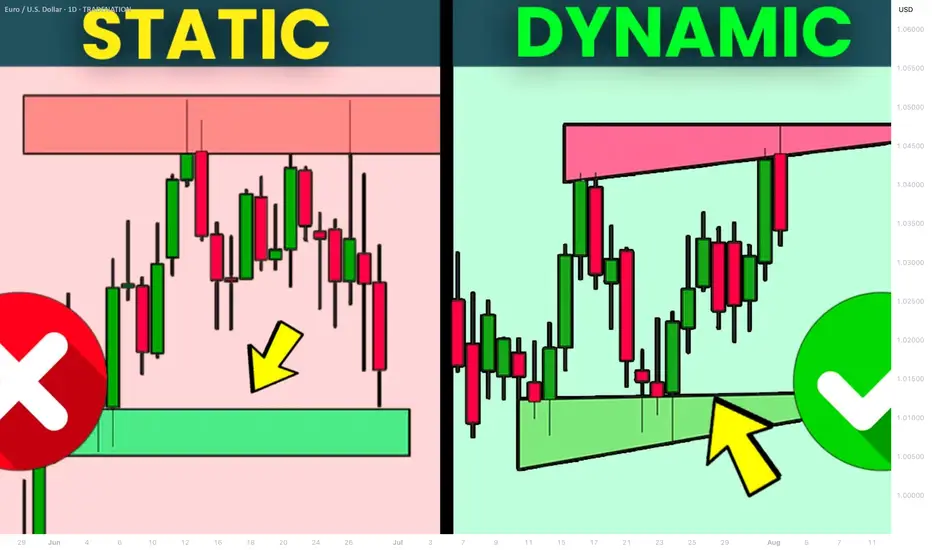
What is Dynamic Support and Resistance Levels & Zones in Forex
Dynamic supports and resistances play a crucial role in technical analysis.
Unlike classic supports and resistances, these zones change and adapt to a market price action in real time.
Learn what is dynamic support and resistance in Forex, Gold trading and how to find it easily.
Discover its main types and real market examples.
Let's start with the basics.
There are 2 major types of supports and resistances in technical analysis.
The first type is called static .
Such supports and resistances are fixed and don't change with time.
It should be strictly horizontal key levels or the zones.
Market price action and momentum beyond them do not affect these supports and resistances.
In the example above, you can find static supports and resistances on Gold. The market may return to one of those levels or the zones today, tomorrow or in a month, but it will not move.
In comparison to static supports and resistances, the dynamic ones shift with time. They constantly change and adjust as the time flies.
One of the obvious types of dynamic supports and resistances is a trend line.
Above is the example of a dynamic rising support based on trend line.
As the time goes, a support shifts and becomes higher and higher.
I found a great example of a dynamic resistance on Dollar Index.
Depending on the moment when the price tests that, the resistance will be on different levels.
The later the price tests the trend line, the lower is the resistance.
When newbie traders learn dynamic supports and resistances, they usually stop on trend lines.
But it is just a beginning.
Really significant dynamic supports are resistances will be the zones .
The areas based on static horizontal supports and resistances and trend lines.
Examine a price action on GBPCHF forex pair.
We have a static horizontal support area and a dynamic rising trend line.
Two supports intersect, composing a contracting dynamic support zone.
With time, it will become narrower, accumulating buy orders within.
On NZDCAD forex pair, I underlined a contracting dynamic resistance zone that is based on an intersection of a static horizontal resistance area and a falling trend line.
Selling orders will be distributed within.
The 2 dynamic support and resistance zones that we discussed are narrowing , but that is not always the case.
A dynamic support zone that I found on GBPNZD is expanding and broaden with time.
It is based on a dynamic falling trend line and a static horizontal support.
With time its boundaries will be wider and a bullish reaction may initiate from any level within that.
A dynamic resistance area that I spotted on EURCAD forex pair is a great example of an expanding resistance.
It is based on a static horizontal resistance and a rising trend line.
We can easily recognize how it grows with time.
Of course, another types of dynamic supports and resistances exist. But they are more nuanced and rare.
As soon as you learn to recognize the clusters that we discussed in this article, you will be able to recognize the less obvious ones as well.
Next time, when you execute a support and resistance analysis, try to find a dynamic zone. You can find it on any time frame, and forex pair and gold, and it will completely change your perspective on the market.
❤️Please, support my work with like, thank you!❤️
I am part of Trade Nation's Influencer program and receive a monthly fee for using their TradingView charts in my analysis.
EURUSDEUR/USD Exchange Rate
EUR/USD: 1.17735
The euro has strengthened against the US dollar, trading near its highest level since early 2024, supported by a softer DXY and stable Eurozone outlook.
10-Year Government Bond Yields
Region 10-Year Yield Date
Eurozone 2.560% July 5, 2025
United States 4.348% July 5, 2025
The US 10-year Treasury yield remains above the Eurozone’s, but the gap has narrowed in recent months.
Central Bank Policy Rates
Central Bank Policy Rate Last Change/Status
ECB 2.00% (Deposit Rate) Cut by 25 bps in June 2025
Federal Reserve 4.25%–4.50% Unchanged since Dec 2024
The ECB recently cut its deposit rate to 2.00% RFR 2.15% MLF 2.4%, its lowest in over two years, as inflation nears target and growth remains subdued.
The Fed has held its target range steady at 4.25%–4.50% since December 2024, with markets expecting possible cuts later in 2025 on cautious wait and see approach by feds
Rate and Yield Differentials
Metric US Eurozone Differential (US - Eurozone)
Policy Rate 4.25–4.50% 2.00% 2.25–2.50%
10-Year Bond Yield 4.35% 2.560% 1.79%
Yield Differential: The US 10-year yield exceeds the Eurozone’s by 1.79 percentage points, a key driver for capital flows and EUR/USD direction ,but strong euro zone economic outlook offset the yield and bond advantage giving the euro buy advantage .
Policy Rate Differential: The Fed’s policy rate is 2.25–2.50 percentage points higher than the ECB’s, though the gap is expected to narrow if the Fed cuts rates later this year.
Market Implications
EUR/USD: The narrowing yield and rate differentials have supported euro strength in recent weeks.
Bond Markets: US yields remain higher, but the Eurozone’s 10-year yield is at a multi-year high, reflecting persistent inflation and reduced ECB accommodation.
Central Bank Outlook: Both the Fed and ECB are expected to remain data-dependent, with further easing possible if economic conditions warrant.
The euro is currently strong against the dollar, with narrowing rate and yield differentials reflecting shifting monetary policy expectations and global economic condition.
#eurusd

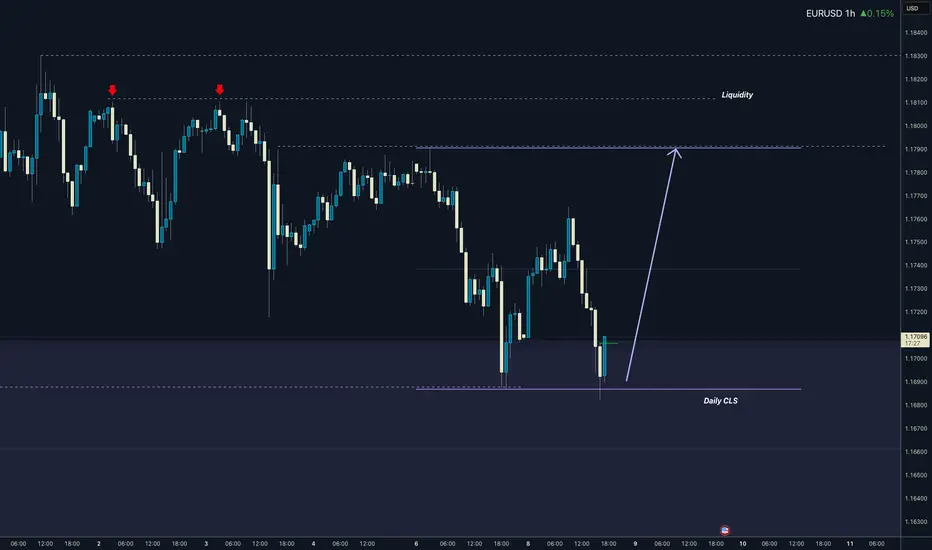
EURUSD I Daily CLS I KL FVG I Model 1Yo Market Warriors ⚔️
Fresh outlook drop — if you’ve been riding with me, you already know:
🎯My system is 100% mechanical. No emotions. No trend lines. No subjective guessing. Just precision, structure, and sniper entries.
🧠 What’s CLS?
It’s the real smart money. The invisible hand behind $7T/day — banks, algos, central players.
📍Model 1:
HTF bias based on the daily and weekly candles closes,
Wait for CLS candle to be created and manipulated. Switch to correct LTF and spot CIOD. Enter and target 50% of the CLS candle.
For high probability include Dealing Ranges, Weekly Profiles and CLS Timing.
Trading is like a sport. If you consistently practice you can learn it.
“Adapt what is useful. Reject whats useless and add whats is specifically yours.”
David Perk aka Dave FX Hunter
💬 Don't hesitate to ask any questions or share your opinions
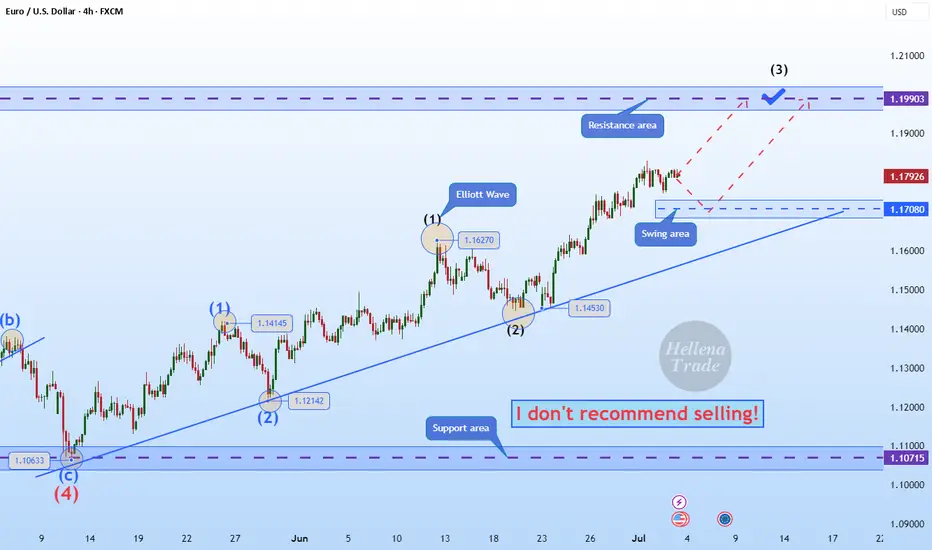
Hellena | EUR/USD (4H): LONG to the resistance area 1.20000.Colleagues, I believe that the upward impulse is not over yet. Wave “3” of the higher order and wave “3” of the lower order are just completing their movement, and I think that at the moment it is worth looking at the resistance area of 1.20000.
This is a very attractive psychological level where wave “3” could complete its upward movement.
Manage your capital correctly and competently! Only enter trades based on reliable patterns!
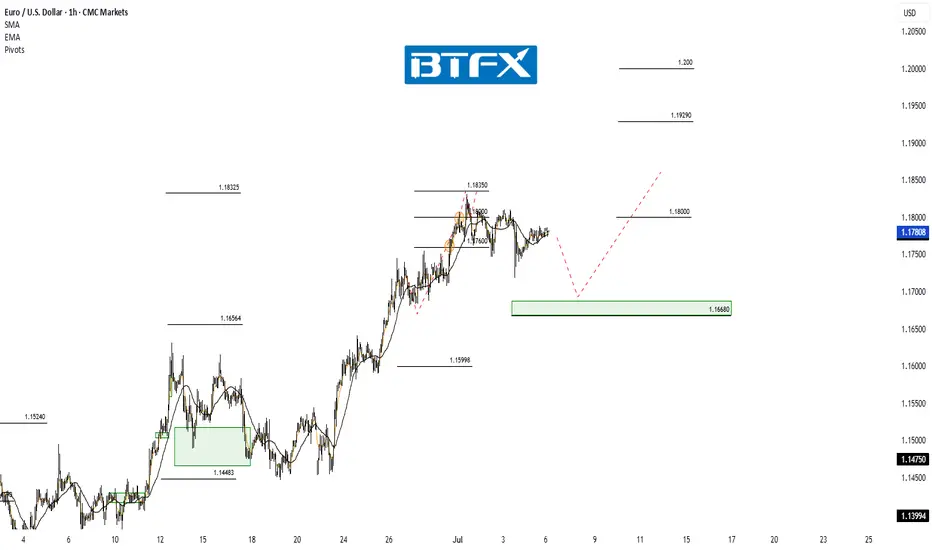
EUR/USD Rally Pauses Near 1.18000 – Higher Targets in SightHi Everyone,
Last week, price action delivered the 1.18000 level we had been calling for, and as expected, dynamic resistance around that area proved to be significant.
Looking ahead, we anticipate EUR/USD will continue to test the 1.18000 level this week while holding above the 1.16680 support zone. A strong break above last week’s high could attract further buyers, paving the way for a move towards the 1.19290 and ultimately the 1.20000 levels. We’ll share further updates on the projected path for EUR/USD if price breaks above this level.
The longer-term outlook remains bullish, with expectations for the rally to extend towards the 1.2000 level, provided the price holds above the key support at 1.10649.
We will continue to update you throughout the week with how we’re managing our active ideas and positions. Thanks again for all the likes/boosts, comments and follows — we appreciate the support!
All the best for a good end to the week. Trade safe.
BluetonaFX
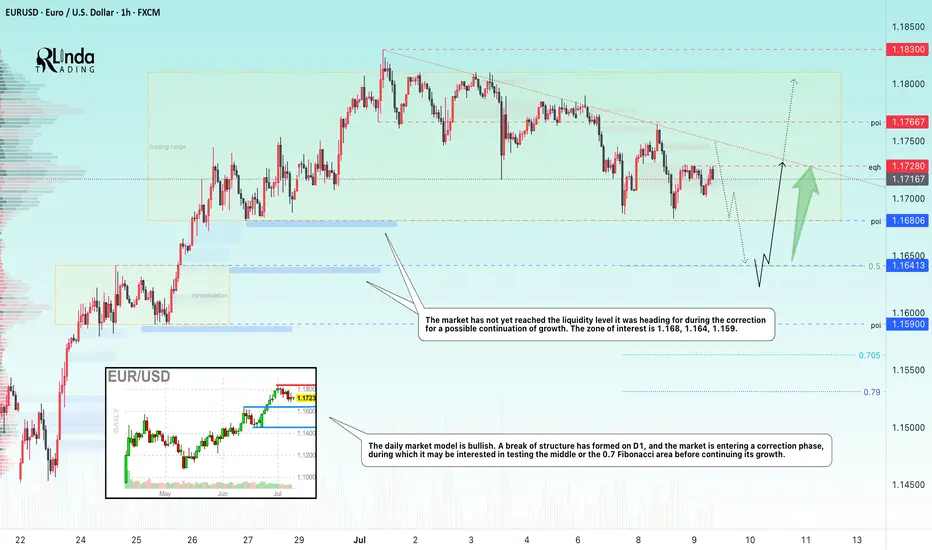
EURUSD → Bullish daily structure. Correction before growthFX:EURUSD , after significant growth and a break of structure, has entered a local correction, the target of which may be a phase of accumulation of potential for updating intermediate highs (1.183).
The daily market model is bullish. A break of the structure has formed on D1, and the market is entering a correction phase, during which it may be interested in testing 0.5 or the 0.7 Fibonacci area before continuing its growth. I would also like to draw attention to the previously broken resistance level of 1.164 - 1.163, which, within the current correction, may act as a support level for buyers...
In addition, the market has not yet reached the liquidity level it was heading for during the correction for a possible continuation of growth. Zone of interest: 1.168, 1.164, 1.159
Resistance levels: 1.1728, 1.1766
Support levels: 1.168, 1.164, 1.159
A false breakdown of the specified support zone could change the market imbalance and attract buyer interest, which could generally support the bullish trend.
Best regards, R. Linda!
How to Trade the Forex Market on Memorial & Independence days?Trading the foreign exchange (Forex) market on major U.S. holidays like Memorial Day (May 29th) and Independence Day (July 4th) presents a unique set of challenges and requires a strategic shift from typical trading days. While the global Forex market remains technically open 24/5, the closure of U.S. banks and financial institutions leads to significantly reduced liquidity and trading volume, altering the market landscape.
Here’s a comprehensive guide on how to approach Forex trading on these holidays:
Understanding the Market Conditions: The "Quiet" Danger
The primary characteristic of Forex trading on U.S. holidays is a sharp drop in liquidity, especially in currency pairs involving the U.S. dollar (USD). With American traders and institutions away from their desks, the volume of transactions plummets. This "quiet" market environment can be deceptive and carries specific risks:
Wider Spreads: With fewer market participants, the difference between the bid and ask prices for currency pairs tends to increase. This makes it more expensive to enter and exit trades, eating into potential profits.
Increased Volatility and Spikes: Don't mistake low volume for a flat market. With a thin order book, even moderately sized orders can cause sharp, sudden price movements or "spikes." These moves can be unpredictable and may not follow typical technical patterns.
Price Gaps and Slippage: The reduced liquidity can lead to price gaps, where the market jumps from one price to another without trading at the levels in between. This increases the risk of slippage, where your order is executed at a less favorable price than intended.
Ineffectiveness of Some Strategies: Strategies that rely on high volume and momentum, such as breakout trading, are more likely to fail. A perceived breakout may lack the follow-through to become a sustained trend.
Strategic Approaches for Trading on Memorial Day and July 4th
Given the unique market conditions, traders should adopt a cautious and well-considered approach. Here are several strategies to consider:
1. The Prudent Approach: Step Aside
For many traders, particularly novices, the most sensible strategy is to avoid trading altogether on these holidays. The increased risks and unpredictable market behavior can easily lead to unnecessary losses. Consider these days as an opportunity to study the markets, refine your overall trading plan, or simply take a break.
2. Trade with Reduced Size and Realistic Expectations
If you do choose to trade, it is crucial to adjust your risk management:
Lower Your Position Sizes: This is the most critical adjustment. Trading with smaller lots will mitigate the potential impact of sudden price spikes and wider spreads.
Adjust Profit Targets and Stop-Losses: Be realistic about potential gains. The market may not have the momentum for large moves. Consider setting smaller profit targets. At the same time, be mindful that tighter stop-losses can be easily triggered by short-term volatility.
3. Focus on Non-USD Currency Pairs
Since the holidays are U.S.-based, currency pairs that do not involve the U.S. dollar may be less affected, although a general decrease in global liquidity is still expected. Cross-currency pairs such as EUR/JPY, GBP/JPY, or AUD/NZD might exhibit more "normal" behavior than majors like EUR/USD or USD/JPY. However, remain vigilant for lower-than-usual volume across the board.
4. Employ Range-Bound Strategies
In low-liquidity environments, currencies often trade within a defined range. Strategies that capitalize on this behavior can be more effective than trend-following approaches. Look for well-established support and resistance levels and consider trading the bounces off these levels.
5. Be Wary of News from Other Regions
While the U.S. market is quiet, significant economic data or geopolitical news from other regions (Europe, Asia) can still impact the market. With low liquidity, the reaction to such news can be exaggerated. Stay informed about the global economic calendar.
A Day-by-Day Look
Memorial Day (Last Monday of May): This is a major U.S. holiday, and its impact will be felt throughout the 24-hour trading period. Expect very thin liquidity during the Asian and European sessions, which will worsen significantly during what would typically be the busy New York session.
Independence Day (July 4th): The impact of July 4th can sometimes extend beyond the day itself. Often, the trading day before (July 3rd) will also see reduced volume as traders close positions ahead of the holiday. On July 4th, expect market conditions similar to Memorial Day, with a significant drop in activity and the associated risks.
In conclusion, while the allure of a 24-hour market is a key feature of Forex, wisdom lies in recognizing when not to trade with your usual strategy and size. Approaching U.S. holidays like Memorial Day and Independence Day with caution, a revised strategy, and a keen awareness of the risks is paramount for preserving your trading capital. For most, these are days best spent on the sidelines.
Navid Jafarian
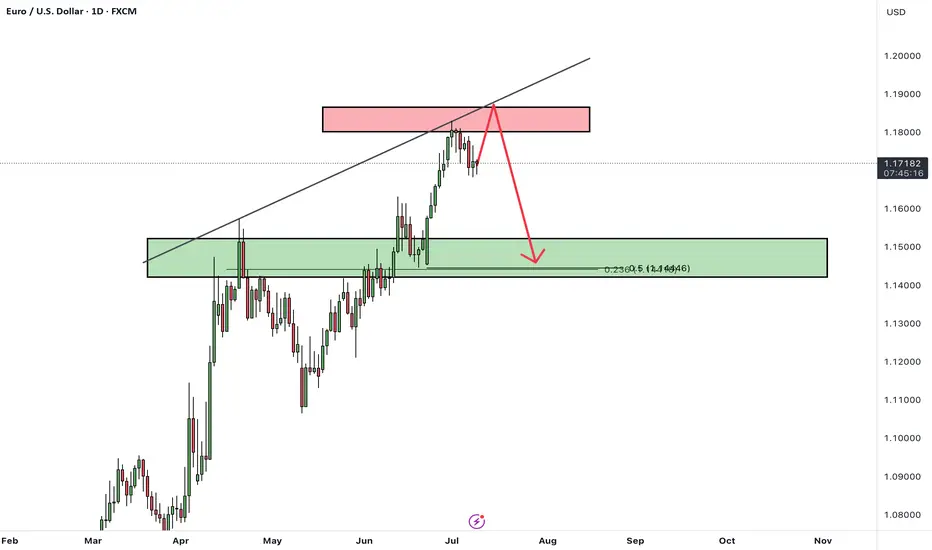
EURUSD: Bearish Continuation Ahead EURUSD is expected to maintain a bearish trend following a confirmed breakout below a significant horizontal support level.
The broken structure, along with a descending trend line, creates a contracting supply zone, indicating a strong likelihood of further downward movement.
The next target is 1.1620 support
EUR/USD Bullish Setup from Key Support📈 EUR/USD Bullish Setup – Targeting 1.18500
Timeframe: 4H
Pair: EUR/USD
💡 Analysis:
The market is currently showing strong bullish momentum with clear support zones holding price action. After a healthy retracement, price is reacting well around the recent support level near 1.16800. If this level holds, we can anticipate a bullish continuation toward the target resistance zone at 1.18500.
🔶 Support Levels:
1. 1st Support Area: ~1.16800 – Recent consolidation and strong reaction zone
2. 2nd Support Area: ~1.15800 – Previous breakout level
3. 3rd Support Area: ~1.14300 – Major structure support
🎯 Target Point:
• 1.18500 – Major resistance and previous swing high
📊 Trade Idea:
We are looking for a bullish move from the current price level (~1.1700) toward the resistance at 1.1850. If price respects the nearest support zone, long entries with proper risk management could be favorable.
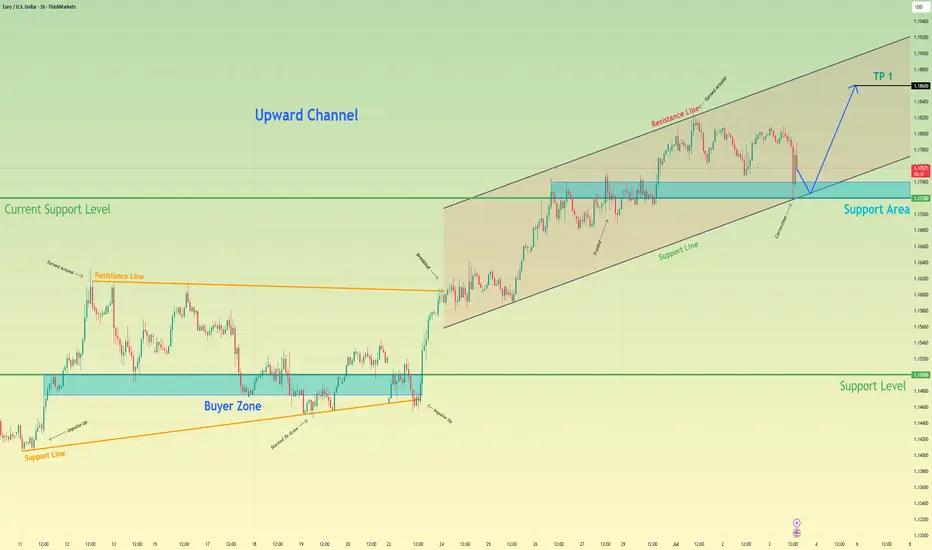
Euro can rebound up from support area to 1.1860 pointsHello traders, I want share with you my opinion about Euro. In this chart, we can see how the price has been moving confidently inside an upward channel after breaking out of a wedge formation. Previously, price consolidated within a narrowing wedge pattern above the buyer zone and broke upward, showing strong bullish momentum. That breakout initiated the current uptrend and led to the formation of a new support area. Now, price is pulling back from the resistance line of the channel and approaching this support area, which also coincides with the support line of the channel. This confluence increases the probability of a bullish reaction in this region. The structure suggests that buyers may step in around this level, preventing a deeper retracement. If the pair bounces off the support zone, I expect a continuation of the uptrend toward the upper boundary of the channel. For that reason, I set my TP at 1.1860 points, almost aligning with the resistance line of the channel. Given the current price action, the bullish structure, and strong reaction levels, I remain bullish and anticipate a rebound followed by further growth toward my target. Please share this idea with your friends and click Boost 🚀
Disclaimer: As part of ThinkMarkets’ Influencer Program, I am sponsored to share and publish their charts in my analysis.