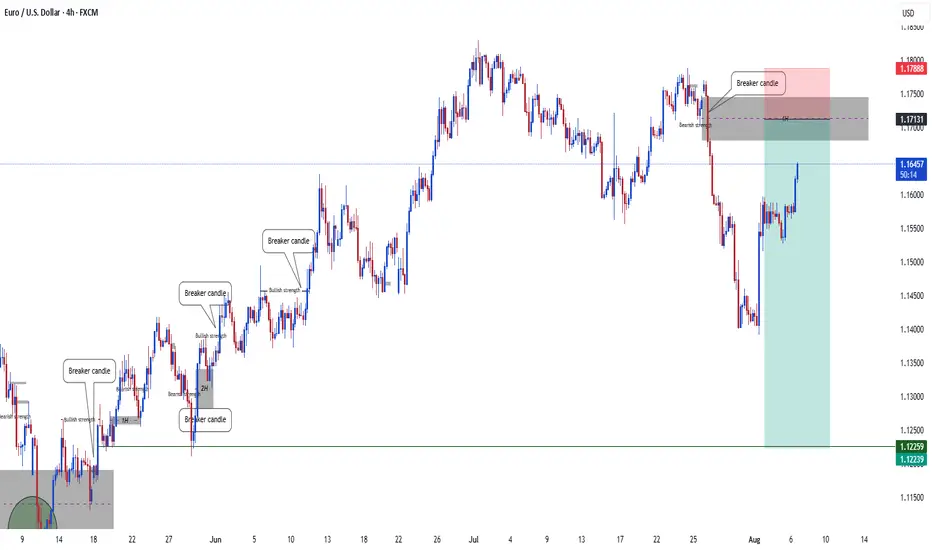
EURUSD. Daily AnalysisHi traders and investors!
This analysis is based on the Initiative Analysis concept (IA).
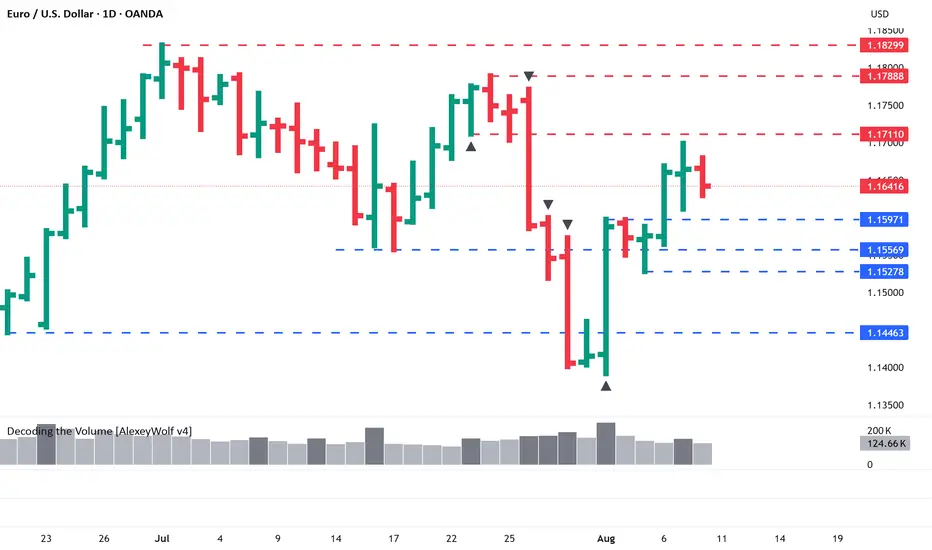
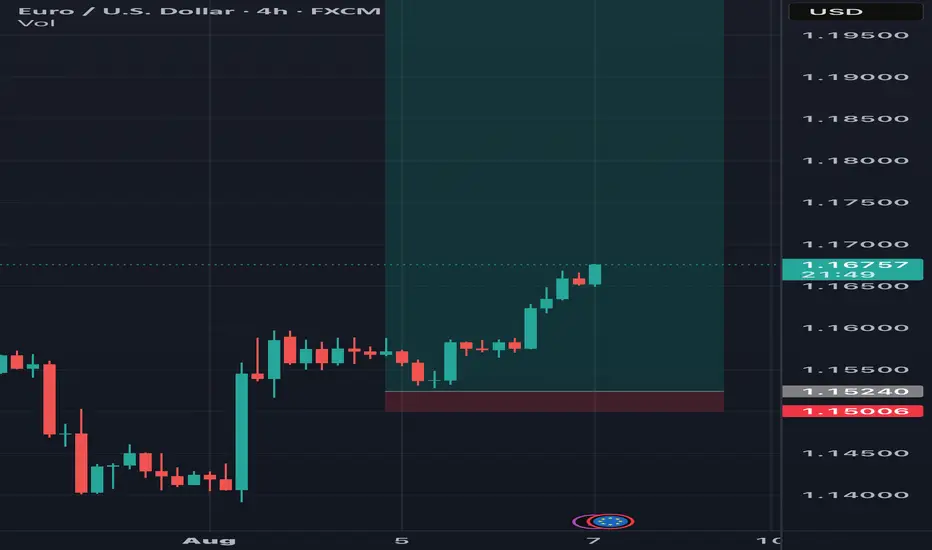
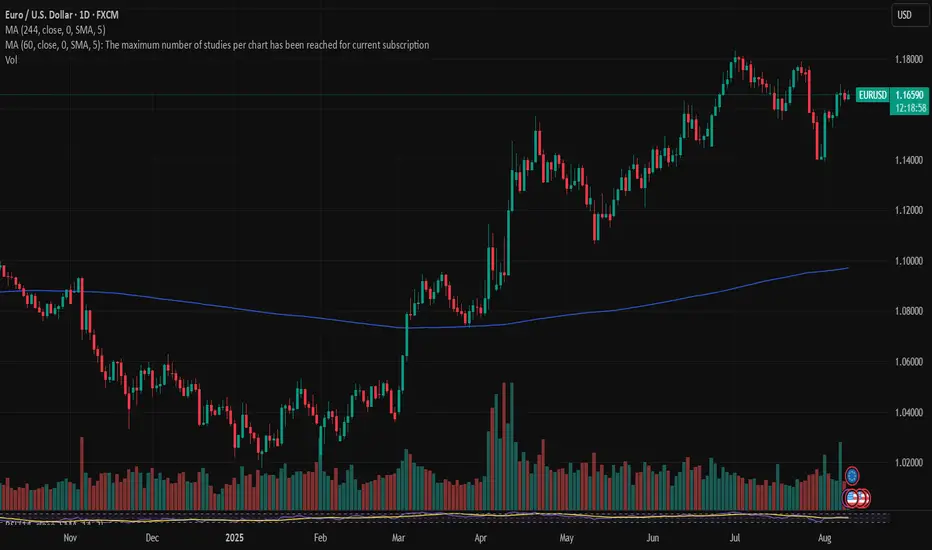
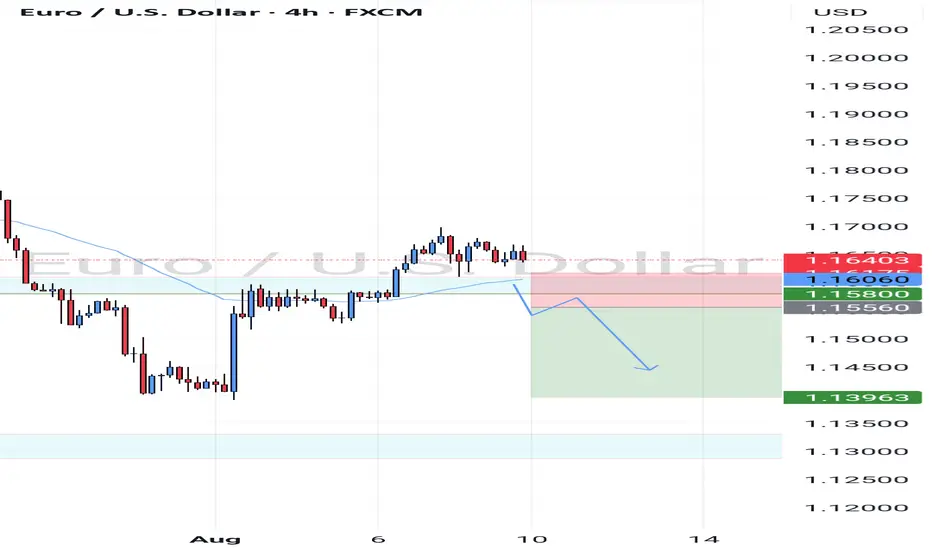
Buyers have broken through 1.15994 and 1.16108.
Buyer targets on the daily TF remain the same: 1.17110, 1.17888, 1.18299.
If a strong seller doesn’t emerge (spread/volume), look for buy setups at the blue levels: 1.15971, 1.15278.
Prefer scouting for patterns on the 1H, 2H, or 4H timeframes.
Wishing you profitable trades!
EURUSD trade ideas
EURUSD confidence 84% BullOur analysis found that the current market for the future trend of the currency to reach a more consistent bearish expectations, mainly benefited from the improvement of macroeconomic indicators and liquidity environment easing.
Combined with news and professional analysis reports, identified "policy support", "economic recovery" and other key words accounted for a significant increase in the proportion of market participants in a positive mood, promoting the formation of a long atmosphere.
The capital flow model shows that cross-border capital inflows have increased, and institutional investors are gradually increasing their holdings of the currency, indicating that there is sufficient support on the capital side to enhance the sustained upward momentum of the price.
We recommended that investors combine the signal to reasonably plan the position layout, especially in the market adjustment to grasp the timing of entry and achieve cost optimization.
Position Management Recommendations:
Layout in batches, control the overall position ratio, avoid over-concentration, and pay attention to risk points in time to ensure capital safety.
EUR/USD - Short-Term - Triangle Breakout soonI'm currently watching EUR/USD as it's forming an ascending triangle on the lower timeframes. Price has been respecting the lower resistance while printing higher lows - suggesting bullish pressure building up. A breakout above the upper area could trigger a larger move to the upside. My first target for the breakout sits around 1.161 based on the triangle height.
Let’s see if the momentum follows through.

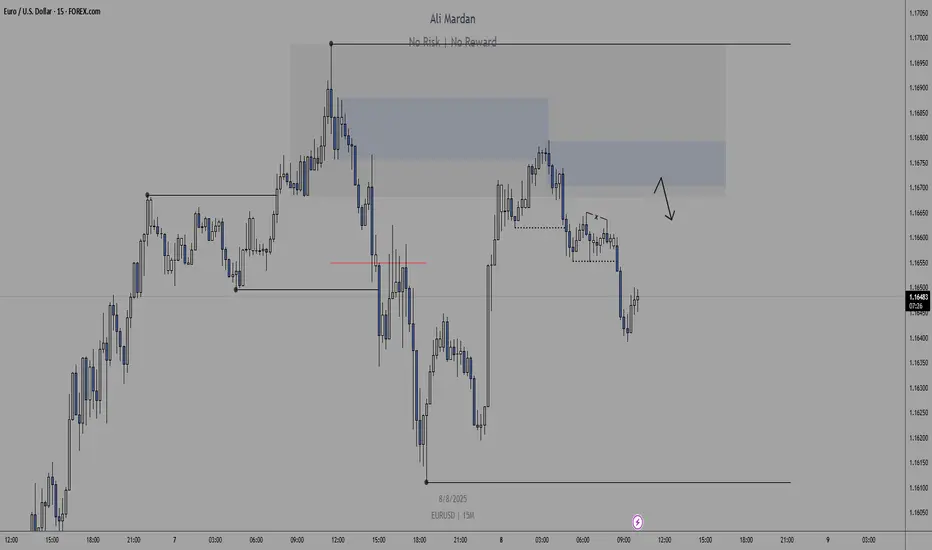
EURUSD – Critical Zone AheadBack on June 29, I shared a buy idea on EURUSD (tagged below this post).
Due to a busy schedule, I couldn't post an update—but as you can see, price reacted to my marked zone, did a quick stop-hunt, and moved up strongly.
Now, the current zone marked on the chart is a potential short area,
but again—we don’t tell the market what to do. We follow it.
📌 If the level breaks upward, we’ll wait for a pullback to go long.
If a valid short signal shows up, we’ll go short.
🔁 Anything can happen—this is why I always remind traders:
Don’t stand in front of the market.
Those who do… often end up like sardines eaten by the whales 🐋—liquidated and out of capital.
Let the market choose the direction, and we simply follow.
📈 Stay flexible. Stay humble. Stay profitable.
EURUSD UPTREND IS STILL INTACT
📊 Trend Analysis:
Primary Trend: Uptrend
From January to mid-July 2025, EUR/USD formed higher highs and higher lows — indicating strong bullish momentum.
Recent Correction:
After peaking around 1.18700, price retraced sharply to the 1.13800–1.14800 zone, testing previous structure support before bouncing.
---
🔍 Key Price Levels:
Level Type Notes
1.18700 Resistance Recent swing high (mid-July). Price rejected strongly from here.
1.17760 Resistance Intermediate high. May act as short-term cap.
1.15860 Support Previous consolidation area and key breakout zone.
1.13960–1.14800 Support Area of bullish reaction – demand zone.
---
🧠 Market Structure:
Break of Structure: The dip below 1.15860 suggests a temporary break in bullish structure.
Liquidity Grab / Stop Hunt: The aggressive sell-off followed by a fast recovery hints at institutional liquidity grab below 1.15000 zone.
Current Status: Price is rebounding after sweeping lows and is now retesting the 1.16700–1.17700 resistance zone.
Volume Observation:
Volume remains moderate—no extreme spikes, indicating no panic selling or aggressive institutional selling at this stage.
---
Conclusion:
Bias: Bullish
As long as price holds above 1.15860–1.14910 and the ascending trendline, the bullish structure remains intact.
A clean break below 1.14910 and the trendline would invalidate the bullish structure and may lead to deeper corrections toward 1.12060 or 1.10160.
---
Trade Idea (Example):
Entry: Around 1.15860 (on a successful retest)
Stop-Loss: Below 1.14900
Targets: 1.17760, 1.18710
NB
Hi Traders,Please let's take note that my previous analysis on EURUSD on SELL is no more valid, EURUSD is no more SELLING is now BUY does the new correction

EURUSD, What's cooking?Since we all know that the market rewards the patient one and scolds the impatient, I've been waiting in the dark. So the EU did some crazy stunts some weeks ago, extending downwards without permission but for all we know, every broken bone must be repaired. I never thought the lazy NFP could give us the head start for a retest and boom...here we are, about to get to the promised land after so much wait. Irregularities can be found as EU ascend, just to clock out of a shift above but as a LOVING SWEET HONEY that I am, I have prepared a warm bath for "HONEY, I'M HOME"...
Be advised that we could end up drowning in the bath water, so do yourself a favor and make sure you still got a leg sticking out (don't go all in), just in case the cops get involved.
Ready or not, hit that SELL BUTTON at the designated mark and regret later!
Go and sin no more!
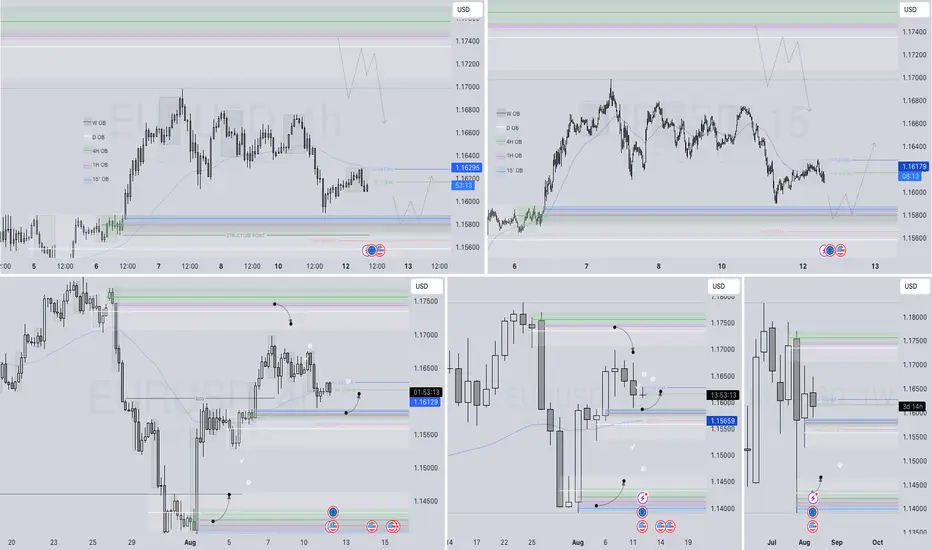
EURUSD – DAILY FORECAST Q3 | W33 | D13 | Y25📊 EURUSD – DAILY FORECAST
Q3 | W33 | D13 | Y25
Daily Forecast 🔍📅
Here’s a short diagnosis of the current chart setup 🧠📈
📍EURUSD Market Update – FRGNT
Price has now entered our higher time frame order block, meaning long positions are off the table for now. ❌📈
We’re now looking for price to push deeper into the daily OB, advancing into the lower time frame order blocks nested within the HTF zone. 🔍
From here, we’re waiting for a clear break of structure to confirm intent — once we get that, we’ll look to ride price short with the trend. 📉🎯
Stay patient, stay disciplined — let the setup come to you.
Higher time frame order blocks have been identified — these are our patient points of interest 🎯🧭.
It’s crucial to wait for a confirmed break of structure 🧱✅ before forming a directional bias.
This keeps us disciplined and aligned with what price action is truly telling us.
📈 Risk Management Protocols
🔑 Core principles:
Max 1% risk per trade
Only execute at pre-identified levels
Use alerts, not emotion
Stick to your RR plan — minimum 1:2
🧠 You’re not paid for how many trades you take, you’re paid for how well you manage risk.
🧠 Weekly FRGNT Insight
"Trade what the market gives, not what your ego wants."
Stay mechanical. Stay focused. Let the probabilities work.
FX:EURUSD

EURUSD – DAILY FORECAST Q3 | W33 | D12 | Y25📊 EURUSD – DAILY FORECAST
Q3 | W33 | D12 | Y25
Daily Forecast 🔍📅
Here’s a short diagnosis of the current chart setup 🧠📈
Higher time frame order blocks have been identified — these are our patient points of interest 🎯🧭.
It’s crucial to wait for a confirmed break of structure 🧱✅ before forming a directional bias.
This keeps us disciplined and aligned with what price action is truly telling us.
📈 Risk Management Protocols
🔑 Core principles:
Max 1% risk per trade
Only execute at pre-identified levels
Use alerts, not emotion
Stick to your RR plan — minimum 1:2
🧠 You’re not paid for how many trades you take, you’re paid for how well you manage risk.
🧠 Weekly FRGNT Insight
"Trade what the market gives, not what your ego wants."
Stay mechanical. Stay focused. Let the probabilities work.
FX:EURUSD
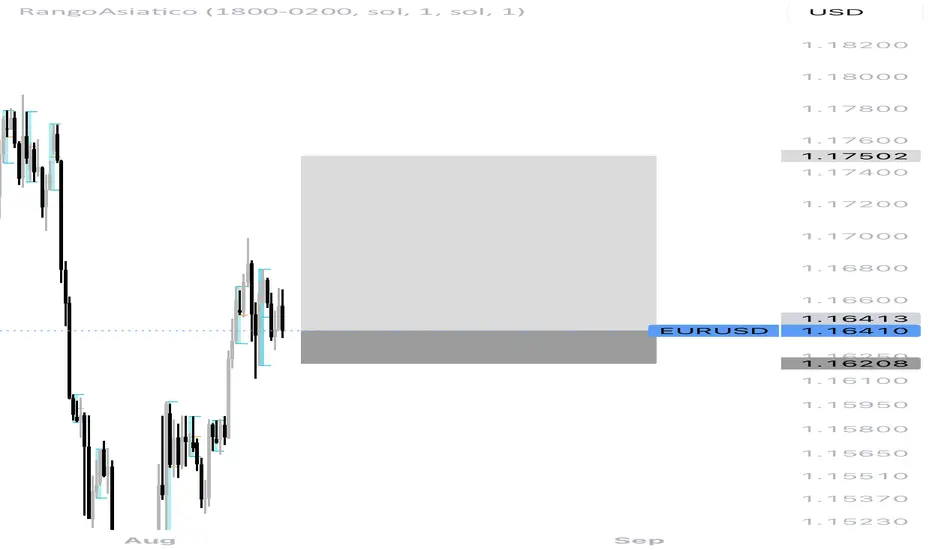
Upward movement for EURUSDWait for price to run through the SSL, then look out for a Shift in Market Structure, then take longs, aiming for the 1.16670 as Tp1 and 1.16700 as Tp2, always remember to manage risks. Happy trading in 0010 hours

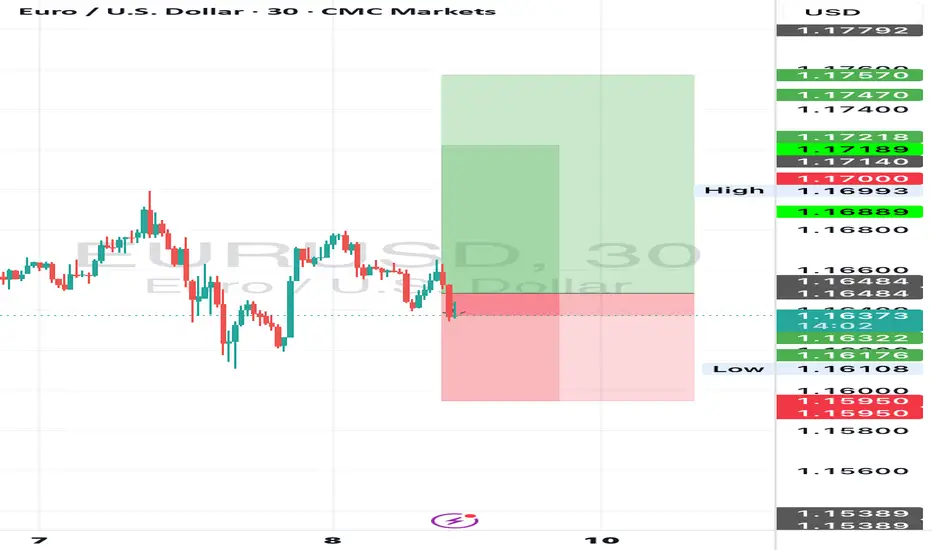
Fundamental Market Analysis for August 8, 2025 EURUSDThe EUR/USD exchange rate remains stable after rising during the previous three sessions, trading at around 1.1660 during Asian trading hours on Friday. The pair may regain its positions as the US dollar (USD) may struggle as markets assess the probability of a 25 basis point (bp) rate cut at the September meeting at nearly 93%, compared to 48% a week ago.
Expectations for a Fed rate cut in September have intensified as the number of new applications for unemployment benefits in the US increased after the US nonfarm payrolls (NFP) report for July pointed to a cooling labor market.
Data on initial jobless claims in the US showed that the number of US citizens filing new claims for unemployment benefits rose to 226,000 for the week ending August 2. This figure exceeded the market consensus forecast of 221,000 and was higher than the previous week's figure of 218,000.
The probability that the central bank will leave rates unchanged is approximately 87%. Markets estimate the probability of another ECB rate cut before March 2026 at only 60%.
Trade recommendation: BUY 1.1660, SL 1.1625, TP 1.1710
EURUSD Bearish Market Structure Unfolding – Liquidity Grab BelowEURUSD Bearish Market Structure Unfolding – Liquidity Grab Below Support Expected"
🔍 Technical Analysis Breakdown:
🔺 Resistance Zone (1.17500 - 1.18500)
Labelled “Strong High”, this is a high-supply zone where price previously reversed.
Multiple Break of Structure (BOS) and Change of Character (CHoCH) confirm this as a strong bearish supply area.
Any retracement toward this level could be ideal for short entries.
🟩 Fair Value Gap (FVG)
This imbalance area previously served as a magnet for price before it broke down.
Price failed to hold inside the FVG, reinforcing bearish sentiment.
🔻 Support Zone (1.13500 - 1.14000)
Marked as a "Weak Low", suggesting this level is likely to be taken out in a liquidity sweep.
Price is expected to retest and potentially break below this zone in the near term.
📉 Current Price Action
Recent CHoCH (Bearish) confirms shift in structure.
Price has made a corrective pullback and seems poised for another leg down.
Highlighted grey zone suggests price may retrace slightly higher before continuing its bearish move.
🎯 Bias: Bearish
Expecting downside continuation toward 1.13500 support, targeting liquidity below.
Traders may wait for rejection signals on lower timeframes around the minor pullback zone before executing shorts.
📚 Educational Notes:
CHoCH indicates a shift in market sentiment (from bullish to bearish).
FVG often acts as a magnet but if not respected, confirms momentum in the opposite direction.
Support/Resistance zones are used to determine institutional activity zones.

EUR/USD Breakout Ladder — Targeting 1.20+
📊 EUR/USD Breakout Ladder — Targeting 1.20+
Strategy: Staggered buy stops every 5 pips
Executed Range: 1.15792 → 1.20000
Lot Size: 0.1 per rung average
Stops/TP: No SL / No TP — trailing begins above 1.2025
Status: All orders placed — waiting for price to do the work
⸻
🔍 Trade Thesis
EUR/USD is climbing cleanly through multi-week resistance levels with no exhaustion signs yet on H1/H4.
This is a precision ladder build, not a directional bet — letting price trigger into strength only.
Key Zone Ahead:
🟦 1.2000 = major psychological + historical structure
🔓 Trail logic activates only after confirmed close above 1.2025–1.2040
📈 If momentum holds, next macro levels are 1.2250 → 1.2500+
⸻
🌐 Macro Correlation Map (Live)
Asset Signal Implication for EUR/USD
DXY 98.12 (↘) ✅ USD weakness supports upside
VIX 16.77 (↓ 6%) ✅ Low fear = risk-on flow
SPX 6,345 (↑ 0.73%) ✅ Broad risk bid confirms trend
BTC/USD 114,514 (↓ 0.45%) ⚠️ Minor drag, but not dominant driver
GOLD $3,378.72 (↑ 0.28%) 🟨 Stable —
no conflict with EUR strength
US10Y Not shown, but yields soft ✅ Less USD appeal globally
→ Macro environment favors continued EUR/USD upside. No current red flags across equities, vol, or commodity safety flows.
⸻
⚠️ Risk Notes
• This is not a high-leverage bet — it’s a structure-following execution
• No guessing reversals, no trying to pick tops/bottoms
• Will scale out partials only on trail trigger, not emotional spikes
⸻
Bias: Bullish continuation through memory zones
Execution: Fully automated ladder — price leads, I follow
Objective: Let strength pay. No chase. No force.
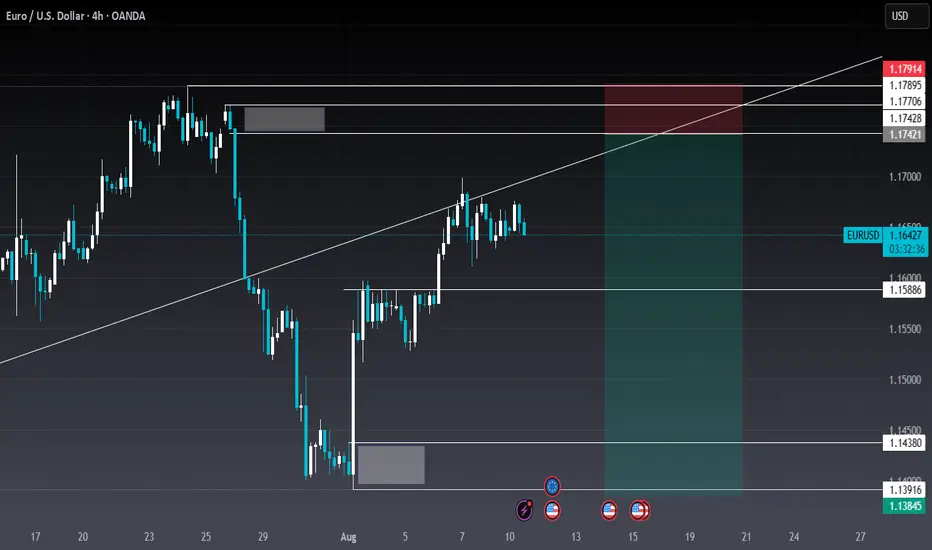
Higher Timeframe Ice Zone - Lower Timeframe Double TopAfter a pretty rough end to the week the FX:EURUSD has rallied up into an Ice Zone - Which is a previous price level that has acted as both support and resistance in the recent past.
As we venture down to the lower timeframe we'll see that price action has also formed a double top level at that pattern which is a classic price pattern for a bearish reversal.
If you're looking for a more conservative entry then waiting for a 2618 opportunity could be something you do as well.
Please leave any questions or comments below & be sure to give me a follow if you want to be notified of my trading ideas.
Akil

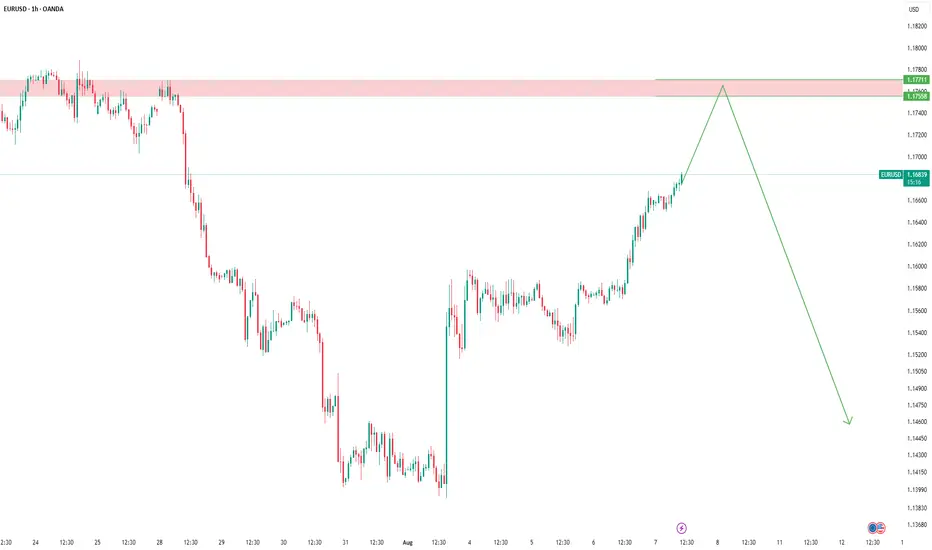
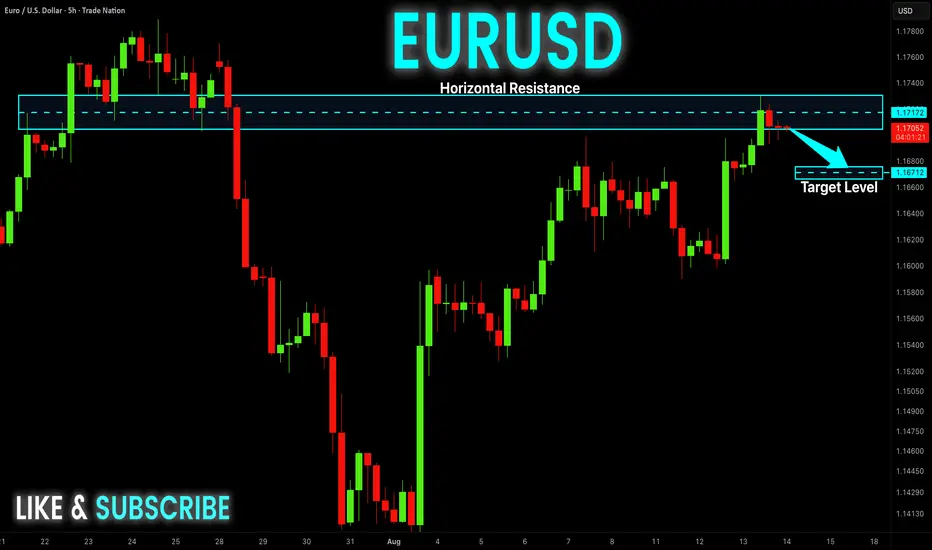
EUR-USD Risky Short! Sell!
Hello,Traders!
EUR-USD went up sharply
But then hit a horizontal
Resistance of 1.1731
From where we are already
Seeing a local bearish reaction
And we will be expecting
A further bearish move down
Sell!
Comment and subscribe to help us grow!
Check out other forecasts below too!
Disclosure: I am part of Trade Nation's Influencer program and receive a monthly fee for using their TradingView charts in my analysis.
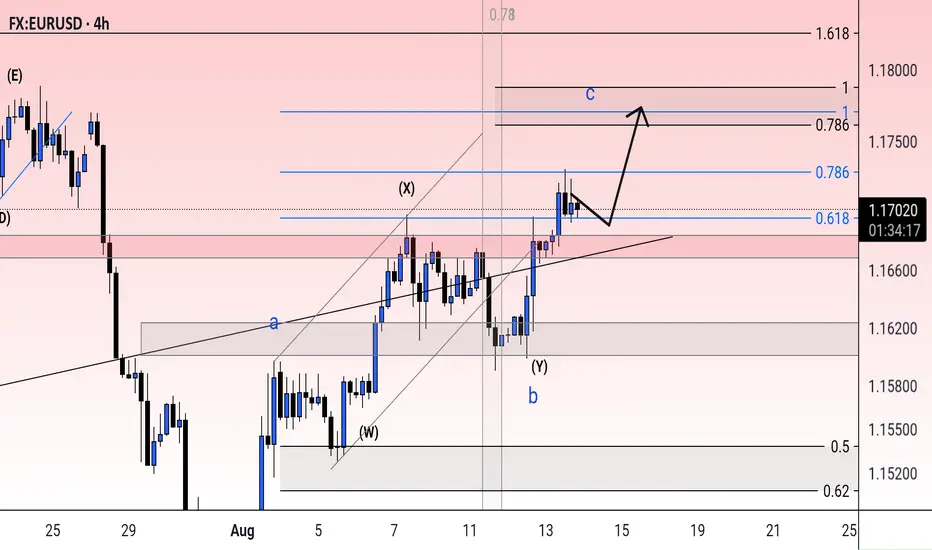
Possibility of uptrend After some correction and fluctuation, the upward trend is expected to continue to the resistance levels indicated on the chart. As long as the price fluctuates above the red resistance area, an upward trend is likely.
EUR/USD ShortEUR/USD short from H4 supply zone.
Price moved away from the zone creating huge bearish engulfing candles also leaving a huge imbalance.
To add to this price broke through a significant upward trend line.
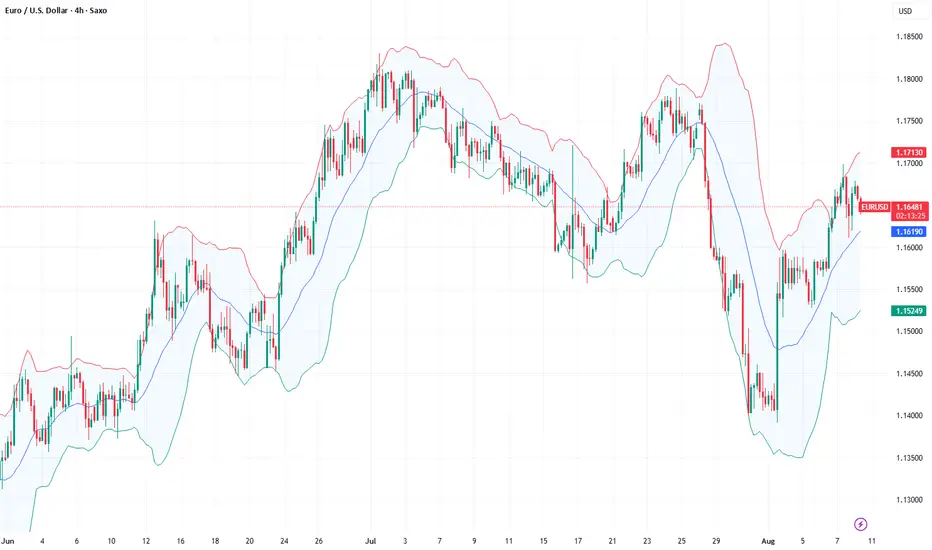
EURUSD: July inflation shapes sentiment Two weeks ago was a quite intensive time when it comes to U.S. macro data, so investors used the previous week to digest the latest available information and adjust their positions accordingly. As for data posted during the previous week for the U.S. economy, the ISM Services PMI in July reached 50,1, which was a bit lower from forecasted 51,5.
Economic data posted for the EuroZone include the HCOB Composite PMI final for July in Germany, which was standing at 50,6 while the same indicator for the Euro Zone was at the level of 50,9. Both indicators were in line with market expectations. The Producers Price Index in the Euro Zone in June was increased by 0,8% for the month, reaching 0,6% on a yearly basis. Factory orders in June in Germany dropped by -1,0% for the month, while the market was expecting to see an increase of 0,8%. Retail Sales in the Euro Zone in June were higher by 0,3%, leading the indicator to 3,1% for the year. The figure was higher from market expectations of 2,6%. The Balance of Trade in Germany in June was standing at euro 14,6B, much lower from expected euro 17,3B. The Industrial Production in Germany in June dropped by -1,9% for the month, again significantly surpassing the expected drop of -0,5%.
In line with the market repositioning based on the latest published data, so the U.S. Dollar headed toward the levels from three weeks ago. The eurusd pair started the previous week by testing the 1,14 support line and swiftly moved to the higher grounds, reaching 1,1691 as the highest weekly level. The currency pair closed the week at 1,1640. The RSI moved from the oversold market side, and reached the level of 50 as of the weekend. It still does not provide a clear suggestion that the market is ready to head toward the overbought market side. The MA50 continued its divergence from MA200, without an indication of a potential slowdown of divergence in the coming period.
Based on current charts, there is some potential for eurusd to move to even higher grounds in the coming period, in order to test the 1,17 resistance level. At the same time, there is also some probability that a modest reversal might continue from Friday's trading session at the start of the week ahead. In this sense, support at 1,16 could be tested for one more time. Still, it should be considered that the US inflation figures for July will be posted during the week, as well as retail sales in July, in which sense, some modestly higher volatility might be implied at the release of these data.
Important news to watch during the week ahead are:
EUR: ZEW Economic Sentiment Index in August in Germany, Industrial Production in the Euro Zone in June, GDP Growth Rate second estimate for Q2 in Euro Zone,
USD: Inflation Rate in July, Producers Price Index in July, Retail Sales in July, Industrial Production in July, University of Michigan Consumer Sentiment Index preliminary for August.
EURUSD We’ve broke a resistance level, so I’m expecting price to make retest then we get to the trendline above before we continue down, until proven otherwise tho
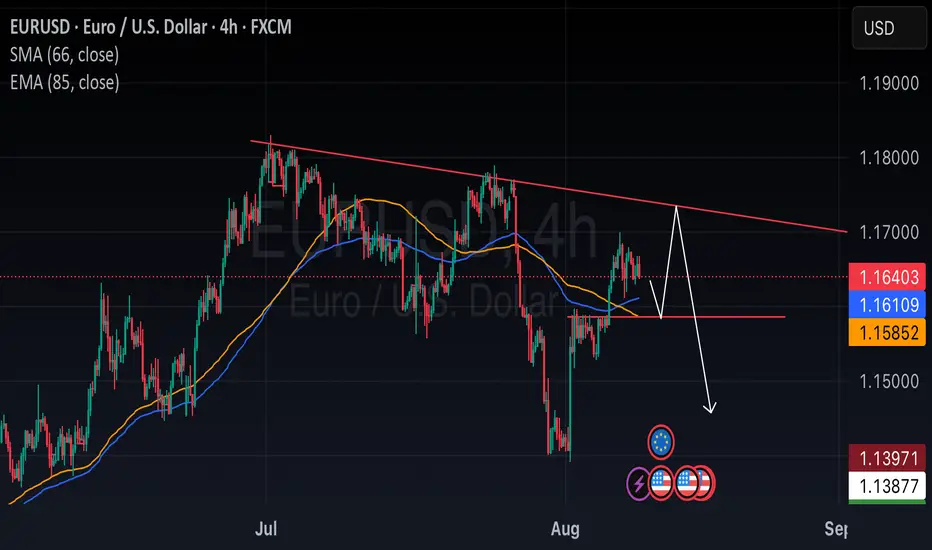
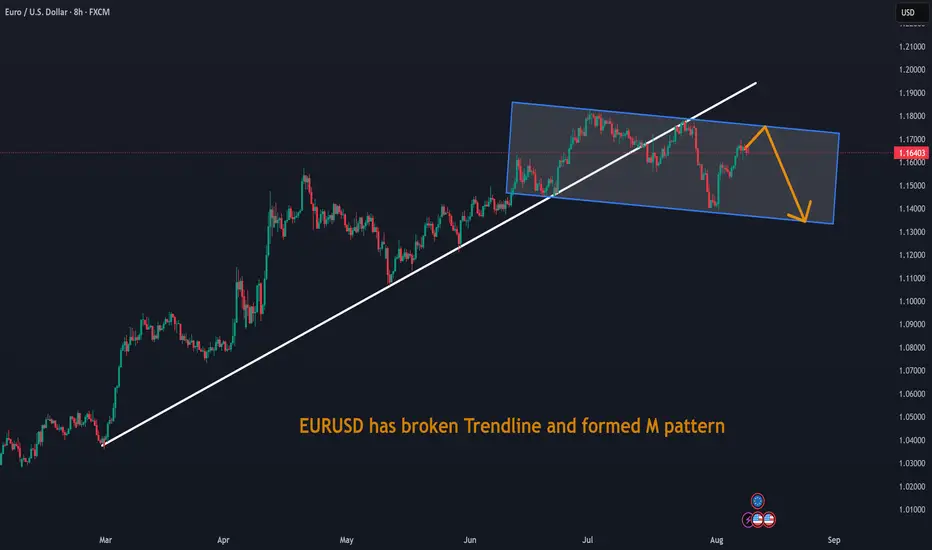
EURUSD has broken Trendline and formed M patternEURUSD has broken Trendline and formed M pattern. Looks like out of steam now
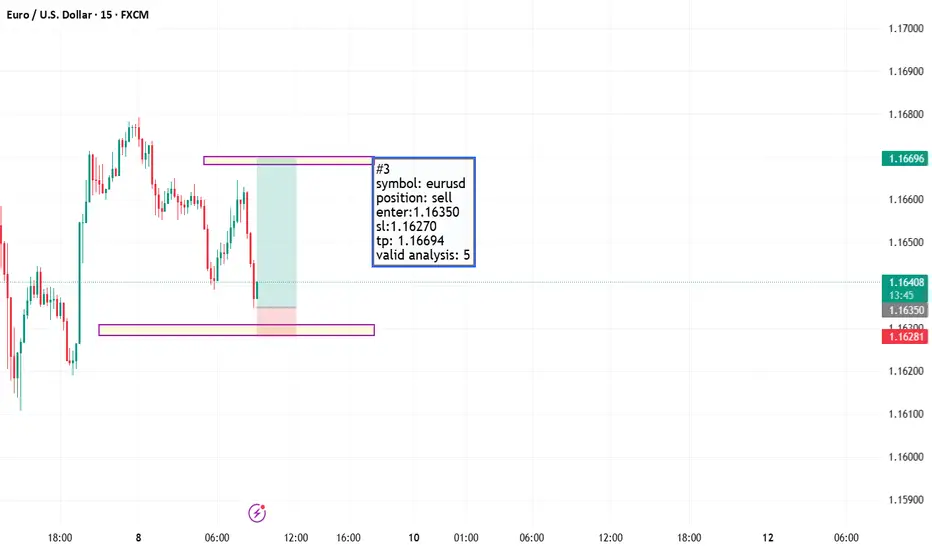
EurusdI posted this signal few days ago if I am not mistaken am expecting price to come down break and retest the zone then I can sell more
EURUSD TODAYEURUSD chart 15m now waiting for a mitigation of POI above to take 15m swing low. but most probably a sideway could happen.