#AN024: "Light" August, Heavy FOREX Data
August is unforgiving: thin liquidity, but a heavy macroeconomic environment. This week, the July US CPI (Tuesday, August 12, at 2:30 PM CET) is the event that could reshape mid-month FX flows; it comes after weak payrolls and with the "tariffs → inflation" theme once again front and center. Hello, I'm Andrea Russo, an independent Forex trader and prop trader with $200,000 in capital under management. Thank you in advance for your time.
The BLS confirms the release calendar (July to August 12), while desks and media are warning of tariff-induced inflation risk and a market pricing in Fed cuts in September.
US: CPI, Tariffs, and the Pricing of Cuts
The stock market has rebounded, but the week will hinge on CPI and PPI: if tariffs boost tradables, the "mini-stagflation" scenario (stagnant inflation and slowing growth) becomes credible and supports the USD in risk-off mode; a soft CPI, however, reinforces the Fed's pricing of a cut and could weigh on the greenback. Currently, traders are looking for a low monthly CPI but with the risk of a downturn due to tariffs.
Europe: ECB Steady, EUR "Still Anchored"
The ECB left rates unchanged on July 24, with the message: inflation at target in the medium term, domestic pressures declining, wages slowing. This "anchor" the EUR: less endogenous macro direction, more dependent on Tuesday's US data. Range-trading is likely ahead of the US CPI; a hot surprise pro-USD pushes EURUSD down, while a soft surprise rebounds it.
UK: BoE cuts to 4% — sterling more "data-dependent"
The BoE has cut by 25 bps to 4% (the fifth time this year) and in its Monetary Policy Report, it predicts a transitory inflation peak of 4% in September before returning. FX translation: GBP loses its "carry edge," becoming sensitive to labor/price data; against the USD, it remains hostage to Tuesday's CPI; against the EUR, it tends to smooth out excesses (less interest rate premium). Disciplined sell-the-rally on GBP/USD if US CPI surprises to the upside; conversely, a soft CPI could trigger short-covering on sterling.
Japan: BoJ patient, but the "more is possible" theme
The June minutes show a BoJ willing to reopen the hike discussion once the trade shocks related to US tariffs subside. In the summer, with intermittent risk-off, the JPY remains bid on negative shocks and warm US data (real yields ↑), and weakens if the CPI reinforces the Fed cut scenario (US yields ↓). USD/JPY sensitive to the term premium: it rises with a hot CPI, retreats with a soft CPI and risk-off.
Australia: RBA under dovish pressure
Consensus strengthens for an RBA cut (after the "no cut" in July): core disinflation and cooling jobs provide coverage. AUD feels the combination of Fed pricing + RBA risk: hot US CPI = AUD down twice (strong USD + dovish RBA); soft CPI = technical rebound, but capped if the RBA actually cuts.
China & commodities: PPI in deflation, lighter oil
China remains disinflated: CPI flat y/y and PPI -3.6% y/y in July. This is a cyclical headwind for FX commodities and, by extension, mitigates near-term global inflation risks. Oil is correcting on demand concerns and the OPEC+ headline; lower Brent is supporting the "soft US CPI" scenario on the sidelines.
EURUSD trade ideas

EURUSD Still waiting to see how price reacts at the levels outlined in the idea and should provide more information
Range breakoutEUR/USD managed to break out of the range, and did so with relatively strong momentum. It will likely rise up to 1.17500.

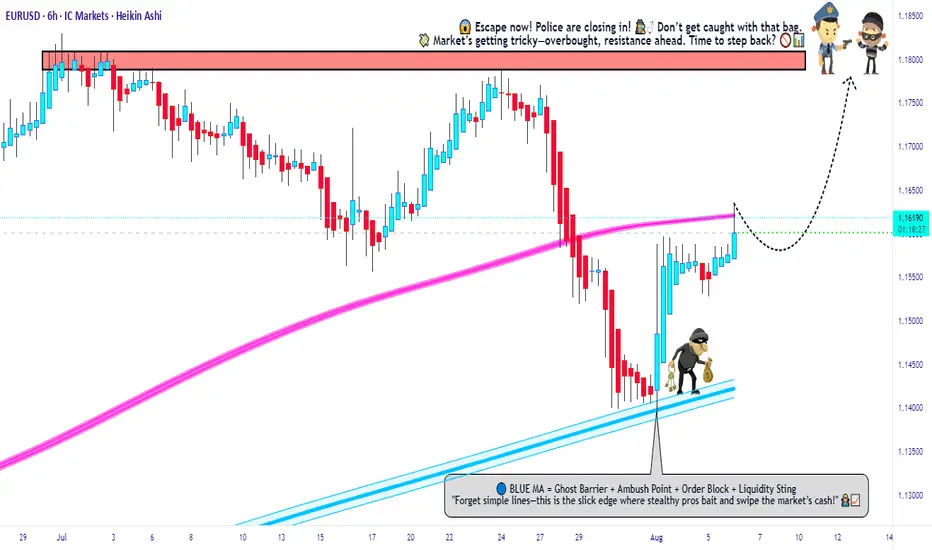
Fiber Battle Plan: Bulls Prepare for EUR/USD Uprising🏴☠️💸 EUR/USD "Fiber Heist Plan" – Thief Trader's Bullish Raid! 💸🏴☠️
🔓 The Vault is CRACKED – Time to LOAD UP! 🚀📈💰
🎯 MASTER PLAN:
Asset: EUR/USD ("Fiber")
Direction: BULLISH HEIST 🐂💪
Entry Strategy: Layered Limit Orders (Sneaky thief-style accumulation)
Trigger: Hull MA CROSS confirmed + Price > 1.16300 🎯
Stop Loss: 1.15100 (Guarding the loot!) 🛡️
Target: 1.18000 (Bank it & bounce!) 💰🔥
🕵️ THIEF TRADER’S BREAKDOWN:
💡 "Weak hands shake, WE TAKE!" – This is a high-probability bullish raid with layered entries for MAXIMUM stealth.
✅ ENTRY TACTICS:
Buy Limit Orders stacked near swing lows (1.16300 zone)
Only trigger AFTER Hull MA confirms bullish flip (No early fomo!)
Scale in like a pro thief – don’t dump all bullets at once.
⚔️ RISK CONTROL (MANDATORY!):
SL at 1.15100 (Break this? ABORT MISSION.)
No revenge trading! Stick to the plan or get caught slippin’.
🎯 PROFIT SECURING:
First TP: 1.18000 (Lock in gains!)
Trailing SL option (If momentum stays strong, let it RUN!)
🚨 THIEF’S WARNING:
⚠️ News = Trap Zone! (Avoid fresh entries during high-impact news)
⚠️ No greed! Secure profits before the market reverses on you.
⚠️ Follow the Hull MA like a shadow – if it flips bearish, RE-EVALUATE!
🔥 SUPPORT THE HEIST!
💥 SMASH THAT LIKE & BOOST BUTTON if you're riding with the Thief Trading Crew!
💬 Comment "🚀 LOADED!" if you're in!
We steal smart, trade sharp, and stack profits like bandits. Stay lethal, traders! 🐱👤💸🔥
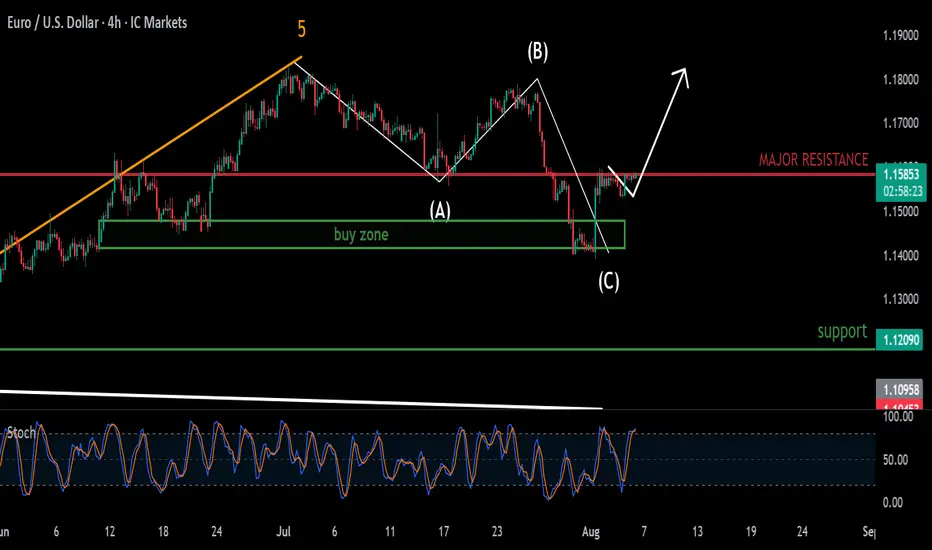
"EURUSD: Wave C Completion Signals Uptrend Continuation"Buy stop: $1.16151
Set up: ABC correction
Sl: $1.15080
TP:$1.18221
RR: 2:1
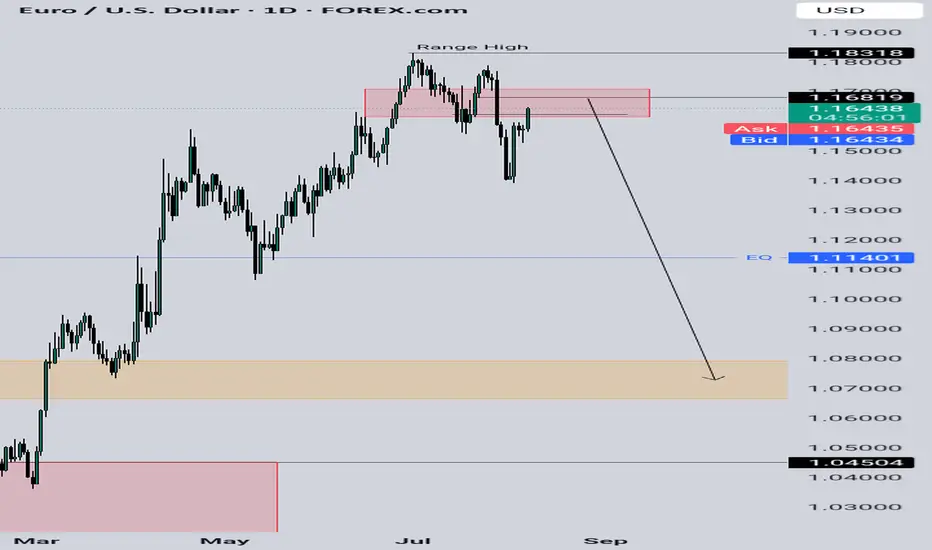
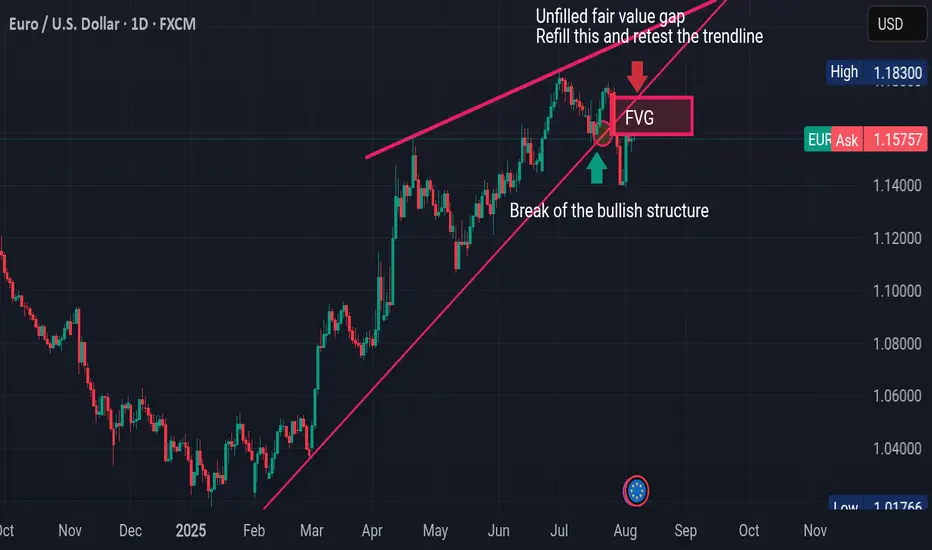
EURUSD DAILY TIMEFRAME ANALYSIS 📊 Key Observations:
1. Uptrend and Trendline Support:
The pair was following a strong ascending trendline.
Price respected this trendline until it broke downwards, indicating a break of bullish market structure.
2. Break of Structure (BoS):
The chart marks a clear Break of Structure (BoS) below the trendline, signifying that buyers lost control and sellers stepped in.
This often suggests a potential trend reversal or at least a deeper correction.
3. Fair Value Gap (FVG):
A Fair Value Gap (imbalance) is highlighted between ~1.1680–1.1830.
This area represents a liquidity void where price moved too quickly in one direction and may return to "fill the gap".
Price is likely to retrace into this FVG, possibly touching the underside of the broken trendline (now resistance).
4. Bearish Retest Zone:
The FVG and trendline intersection make this a strong bearish retest zone.
If price reaches this level, it could act as a supply zone or area of resistance for further downside continuation.
---
🔁 What Could Happen Next:
✔️ Bullish Scenario (less likely without fundamentals):
Price breaks above the FVG and reclaims the trendline.
If that happens, bullish momentum could resume with 1.20+ as the target.
❌ Bearish Scenario (currently more probable):
Price retraces into the FVG zone and rejects.
This retest confirms the trendline as resistance.
Bearish continuation toward 1.1400, 1.1300, or even 1.1100 is likely.
---
🔑 Key Technical Levels:
Level Type Price Level (Approx)
FVG Upper Bound 1.1830
FVG Lower Bound 1.1680
Support 1 1.1400
Support 2 1.1300
Support 3 1.1065
---
🧠 Conclusion:
This chart shows a classic Smart Money Concept (SMC) setup:
Break of structure ➝ Retrace to FVG ➝ Potential bearish continuation. Watch how price reacts around 1.1680–1.1830. That zone will reveal if sellers are still in control.
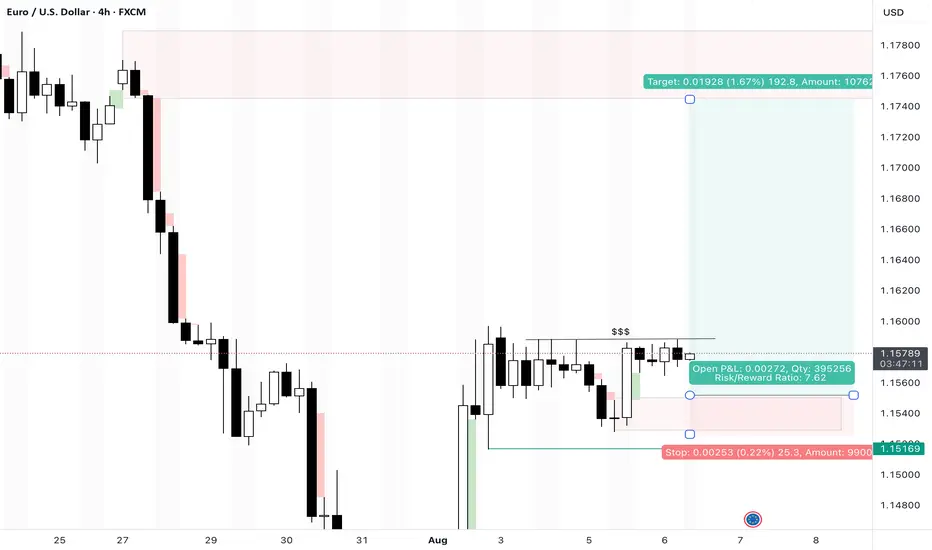
EURUSD- 6/8/25 - bullish pushAfter last week's high momentum bullish move, the last few days has resulted in a consolidation with a price ceiling that has been tested about 4 times - equal high liquidity zone.
Ideally i would like a pull back to trigger a bullish move.
+ve:
1. equal high liquidity that has been tested 4 times
2. continuing with bullish momentum
-ve:
1. Large imbalance below this zone which could draw price lower
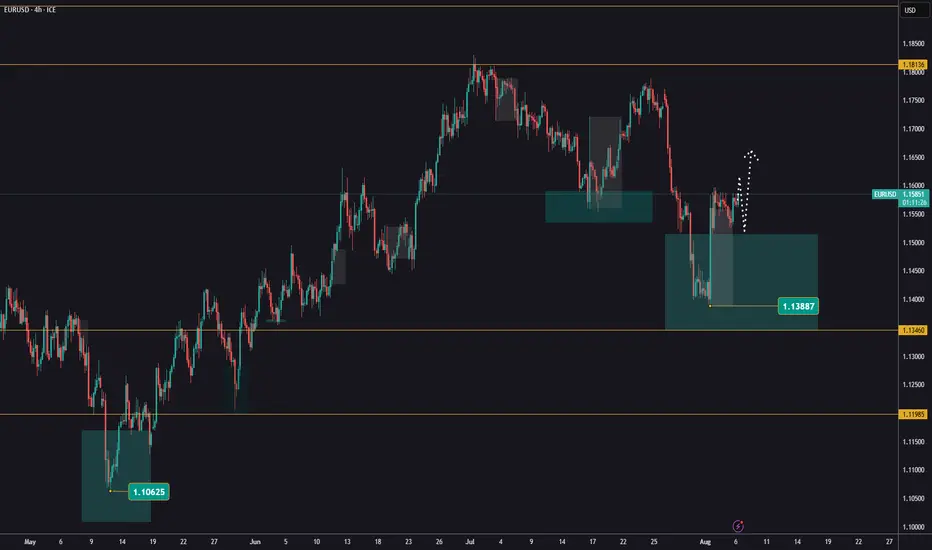
Buying opportunities on EURUSDEURUSD is currently in an uptrend.
Following Friday’s news, we saw a bounce and a higher low.
The target is a retest and breakout above the previous highs around 1,1800.
The exact entry point can be identified on the lower timeframes after a reaction.
This idea becomes invalid if the price drops below 1.1388!
EURUSD – DAILY FORECAST Q3 | W32 | D6 | Y25📊 EURUSD – DAILY FORECAST
Q3 | W32 | D6 | Y25
Daily Forecast 🔍📅
Here’s a short diagnosis of the current chart setup 🧠📈
Higher time frame order blocks have been identified — these are our patient points of interest 🎯🧭.
It’s crucial to wait for a confirmed break of structure 🧱✅ before forming a directional bias.
This keeps us disciplined and aligned with what price action is truly telling us.
📈 Risk Management Protocols
🔑 Core principles:
Max 1% risk per trade
Only execute at pre-identified levels
Use alerts, not emotion
Stick to your RR plan — minimum 1:2
🧠 You’re not paid for how many trades you take, you’re paid for how well you manage risk.
🧠 Weekly FRGNT Insight
"Trade what the market gives, not what your ego wants."
Stay mechanical. Stay focused. Let the probabilities work.
FX:EURUSD

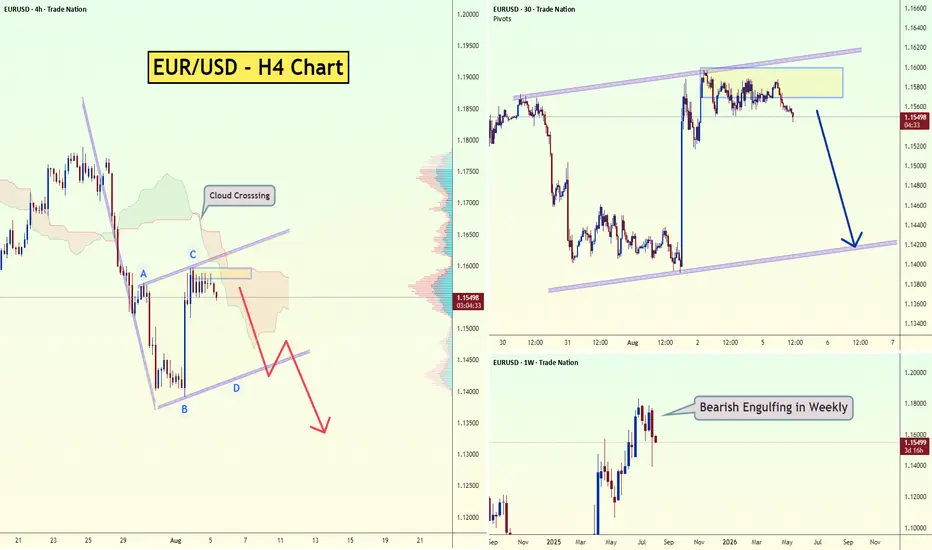
EUR/USD - Bearish Outlook (05.08.2025)The EUR/USD Pair on the H4 timeframe presents a Potential Selling Opportunity due to a recent Formation of a Bearish Flag Pattern. This suggests a shift in momentum towards the downside in the coming Days.
Possible Short Trade:
Entry: Consider Entering A Short Position around Trendline Of The Pattern.
Target Levels:
1st Support – 1.1400
2nd Support – 1.1300
🎁 Please hit the like button and
🎁 Leave a comment to support for My Post !
Your likes and comments are incredibly motivating and will encourage me to share more analysis with you.
Best Regards, KABHI_TA_TRADING
Thank you.
Disclosure: I am part of Trade Nation's Influencer program and receive a monthly fee for using their TradingView charts in my analysis.

EURUSD – Retest in Play After NFP Reversal?EURUSD started last week with a heavy bearish tone, dropping 200 pips on Monday alone — which is quite a move for such a typically stable pair.
After a brief consolidation around the neckline support of the recent double top, sellers came back in, pushing the pair down to 1.1400 by Friday — a level I highlighted in my previous analysis.
But then came NFP...
The weak jobs data triggered a sharp bullish reversal, and the euro took off like a rocket.
By the weekly close, the pair had rallied all the way back to the neckline zone, now acting as potential resistance.
________________________________________
🔍 Technical Outlook:
This area around 1.1550–1.1590 could now serve as a retest of the broken structure.
• 🔽 A rejection here, followed by a break back below 1.1500, would confirm the bearish scenario and open the door for a move toward 1.1200, the next major support.
• 📌 On the flip side, a sustained move above the neckline would invalidate the double top — and put bulls back in control.
________________________________________
Conclusion:
Watching for sell signals around the neckline makes technical sense — but confirmation is key.
The reaction early this week will likely set the tone for the next major swing.
Disclosure: I am part of TradeNation's Influencer program and receive a monthly fee for using their TradingView charts in my analyses and educational articles.

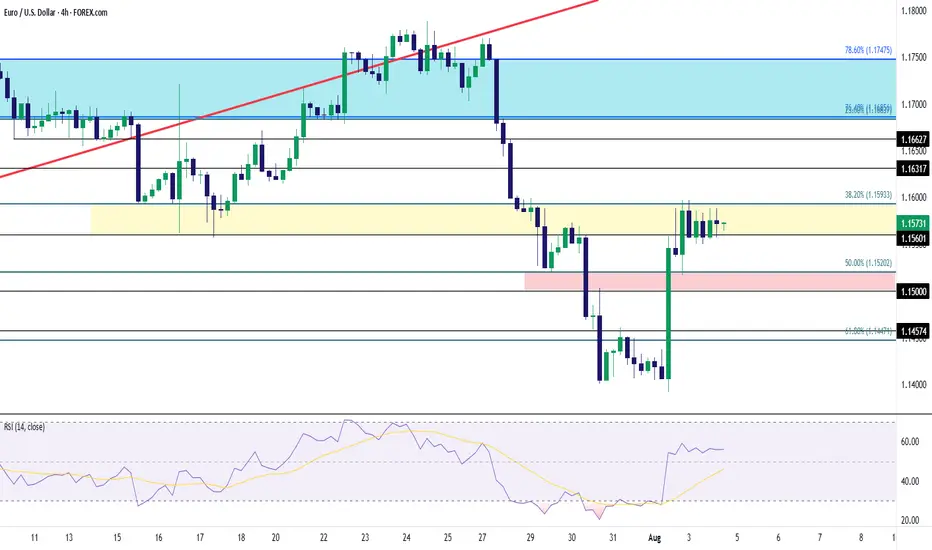
EUR/USD Snapback from Oversold Tests Fibonacci ResistanceIt happened quickly but EUR/USD fell into oversold territory last Thursday in the aftermath of the Fed rate decision and the Core PCE report a day later. The pair fell all the way until the 1.1400 handle came into catch the lows in a move that had been very one-sided. But Friday served as reminder of why chasing developed breakouts can be so dangerous, as an NFP report with a massive revision to the headline print for the prior two months pulled the rug on the USD rally that had driven into Friday morning.
But now is where we find out the true trend in both EUR/USD and the USD. The last resistance level that I wrote of in the Thursday post at 1.1560 is currently in-play on EUR/USD, which along with the Fibonacci level at 1.1593 is helping to hold resistance so far today.
From the daily chart - this is a look of resistance at prior support - the same support that held the lows in mid-July before EUR/USD rallied up to a lower-high.
But from shorter-terms, even the four-hour chart, this can be argued as bullish given the continued show of strength above the 1.1500 handle. This sets up for a key support zone from 1.1500-1.1520, and if sellers can take that out, it'll look more attractive for that longer-term theme to play out.
But, until then, bulls have put in a strong showing with continued support at 1.1560 for today, and the door remains open for a test of deeper resistance at 1.1632, 1.1663 and then the longer-term Fibonacci level at 1.1686. - js
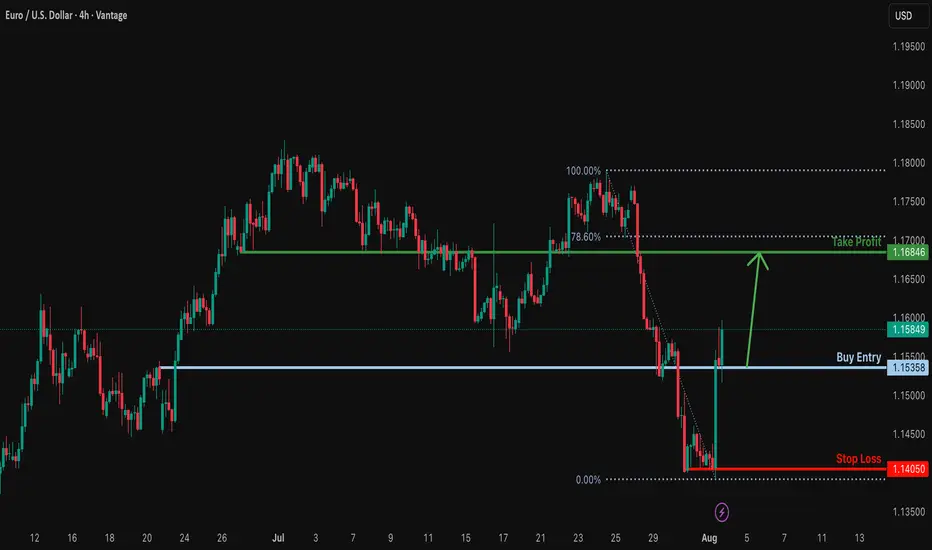
Bullish rise?EUR/USD has reacted off the support level and could potentially rise from this level to our takeprofit.
Entry: 1.1535
Why we like it:
There is a pullback support.
Stop loss: 1.1405
Why we like it:
There is a swing low support.
Take profit: 1.1684
Why we like it:
There is a pullback resistance that is slightly below the 78.6% Fibonacci retracement.
Enjoying your TradingView experience? Review us!
Please be advised that the information presented on TradingView is provided to Vantage (‘Vantage Global Limited’, ‘we’) by a third-party provider (‘Everest Fortune Group’). Please be reminded that you are solely responsible for the trading decisions on your account. There is a very high degree of risk involved in trading. Any information and/or content is intended entirely for research, educational and informational purposes only and does not constitute investment or consultation advice or investment strategy. The information is not tailored to the investment needs of any specific person and therefore does not involve a consideration of any of the investment objectives, financial situation or needs of any viewer that may receive it. Kindly also note that past performance is not a reliable indicator of future results. Actual results may differ materially from those anticipated in forward-looking or past performance statements. We assume no liability as to the accuracy or completeness of any of the information and/or content provided herein and the Company cannot be held responsible for any omission, mistake nor for any loss or damage including without limitation to any loss of profit which may arise from reliance on any information supplied by Everest Fortune Group.
Week of 8/3/25: EURUSD AnalysisPrice was bearish all of last week until NFP, resulting in a shift in 4h and 1h market structure to be bullish.
Focus this week is being bullish and following 1h order flow until it reaches the extreme of the daily bearish structure to then be cautious and seeing where price wants to go from there.
Major News:
Tuesday: PMI
Thursday: Unemployment Claims

EURUSD Trading Opportunity! SELL!
My dear followers,
This is my opinion on the EURUSD next move:
The asset is approaching an important pivot point 1.1585
Bias - Bearish
Technical Indicators: Supper Trend generates a clear short signal while Pivot Point HL is currently determining the overall Bearish trend of the market.
Goal - 1.1497
About Used Indicators:
For more efficient signals, super-trend is used in combination with other indicators like Pivot Points.
Disclosure: I am part of Trade Nation's Influencer program and receive a monthly fee for using their TradingView charts in my analysis.
———————————
WISH YOU ALL LUCK

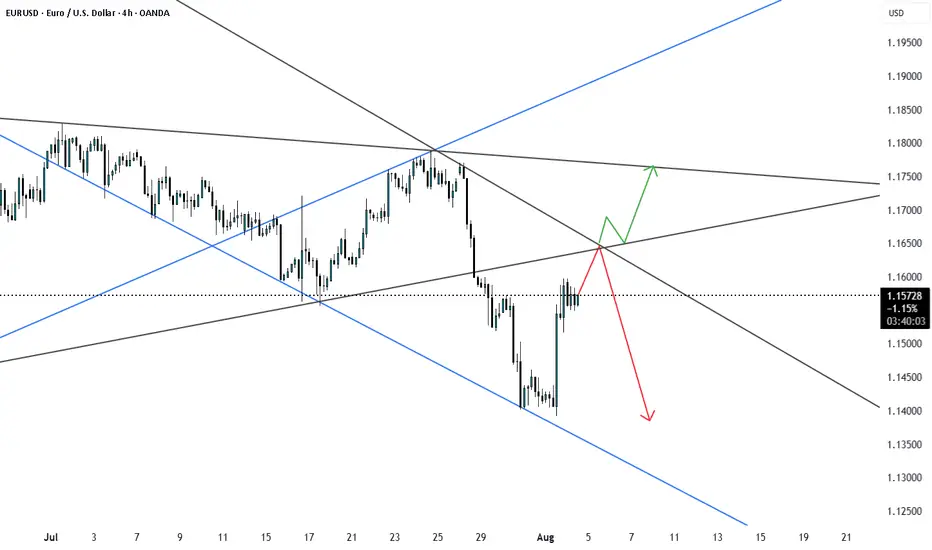
EURUSD Possible Scénario EUR/USD is currently in a downtrend and trading within a developing channel pattern.
The structure isn’t fully formed yet, but a minor upward move is likely in the short term, toward a key resistance area where two resistance levels intersect.
This confluence increases the probability of a downward reversal from that zone.
However, in the event of NFP news triggering a bullish breakout above resistance, the pair could shift to the upside.
We’ll wait and see how price reacts at this critical level.
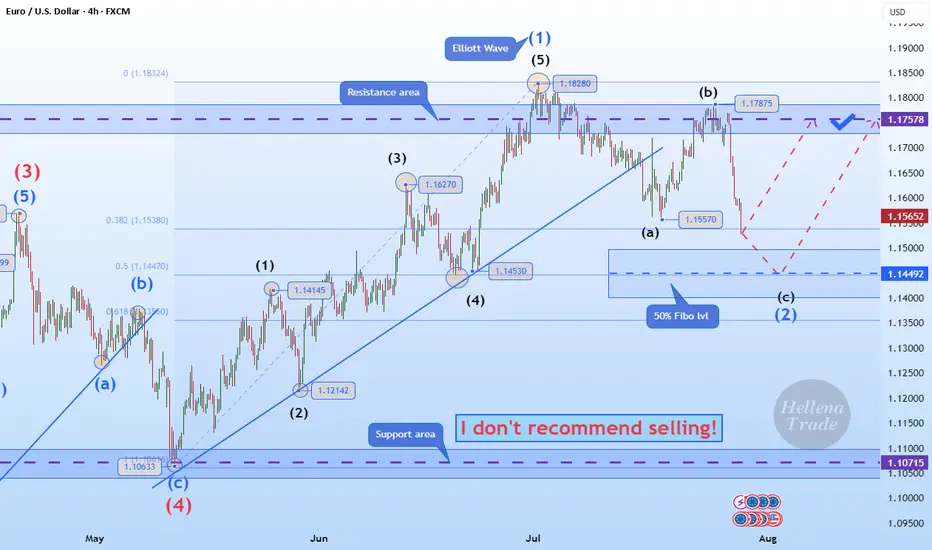
Hellena | EUR/USD (4H): LONG to the resistance area 1.17578.Colleagues, the price has made a strong downward movement, which can only mean one thing: the correction is not complete.
This means that the latest upward movement is wave “1” of medium order.
Therefore, I now expect the correction to end in wave “2” at the 50% Fibonacci level and thean upward movement to continue to at least the resistance level of 1.17578.
It is quite possible that after updating the level of 1.15570, the price will immediately begin an upward movement — this is a more risky option for entering a position.
Manage your capital correctly and competently! Only enter trades based on reliable patterns!
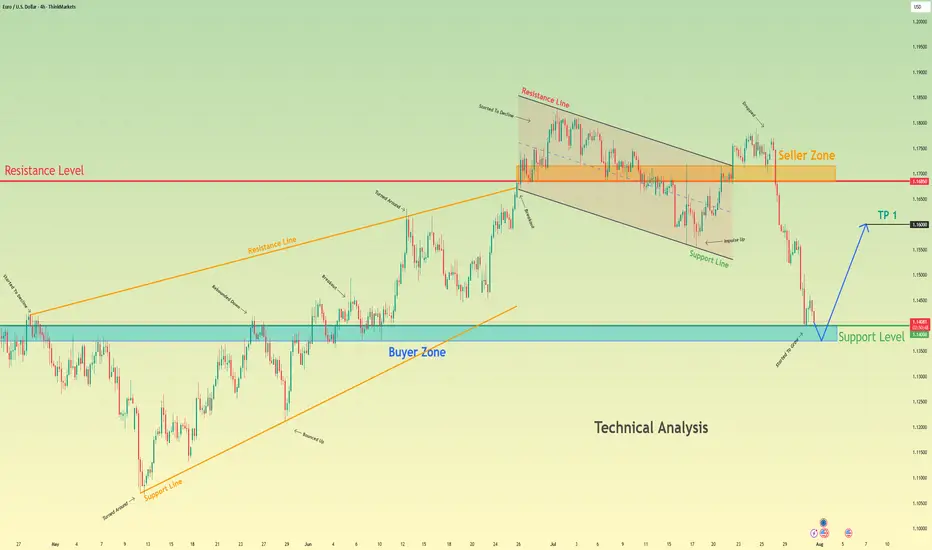
Euro bounce from buyer zone and start to move upHello traders, I want share with you my opinion about Euro. After a prolonged upward trend which formed a large rising wedge, the EURUSD faced a significant rejection from the seller zone near the 1.1685 resistance level. This failure to continue higher marked a key turning point, exhausting the bullish momentum and initiating a new bearish market phase. This new phase has since taken the form of a well-defined downward channel, within which the price has been undergoing a series of downward corrections and impulses. The most recent market action has been a sharp downward fall, accelerating the price's descent towards a critical area of historical significance. Currently, the pair is approaching the major support level at 1.1400, which also constitutes a strong buyer zone where demand has previously stepped in. The primary working hypothesis is a long, counter-trend scenario, which anticipates that the current bearish momentum will be absorbed by the strong demand within this buyer zone. A confirmed and strong rebound from this 1.1400 support area would signal a potential temporary bottom and the start of a significant upward correction. Therefore, the tp for this rebound is logically set at the 1.1600 level, a key psychological and technical point that represents a realistic first objective for a bounce of this nature. Please share this idea with your friends and click Boost 🚀
Disclaimer: As part of ThinkMarkets’ Influencer Program, I am sponsored to share and publish their charts in my analysis.
EURUSD Showing Reversal Signs After 7-Month Bullish TrendHello everybody!
After holding bullish momentum for a long time (7 months), EURUSD is starting to show signs of reversal:
1. It has been rejected from a strong resistance area.
2. It broke a support area, which is now expected to act as resistance.
3. It broke a solid upward trendline with a strong downward move.
If this area holds and price doesn't go above 1.18000, we can look to sell from here.
In that case, the most likely target will be around 1.12000.
Manage your risk and trade safe!

Simple Psychology Tips Using Volume for Better TradingMany newer traders assume that when someone says "psychology" in trading, they are referring to mindset.
It is also widely believed that trading is about the BEST entries.
Now, think of it this way. It is not about winning trades, it is actually about managing losses well to allow you to take the winners over and over again. You might think that a 3 to 1 risk-to-reward strategy is boring, you might have gone all in on your favourite crypto project. But what makes the difference between gambling and trading is actually very, very simple. So simple, in fact, many overlook it or simply ignore it.
Most seek a silver bullet - high win rates and perfectly timed entries, then they overleverage and move stops on the one "good trade" they are seeking to make.
Whilst doing this, they tend to overload the 6 monitors they have purchased to trade with a thousand indicators, which they don't really need.
The candlesticks tell a story, volume supports that story. When you learn any technique from Elliott Waves to Wyckoff, they all have a dependence on volume - even if the correlation is not apparent.
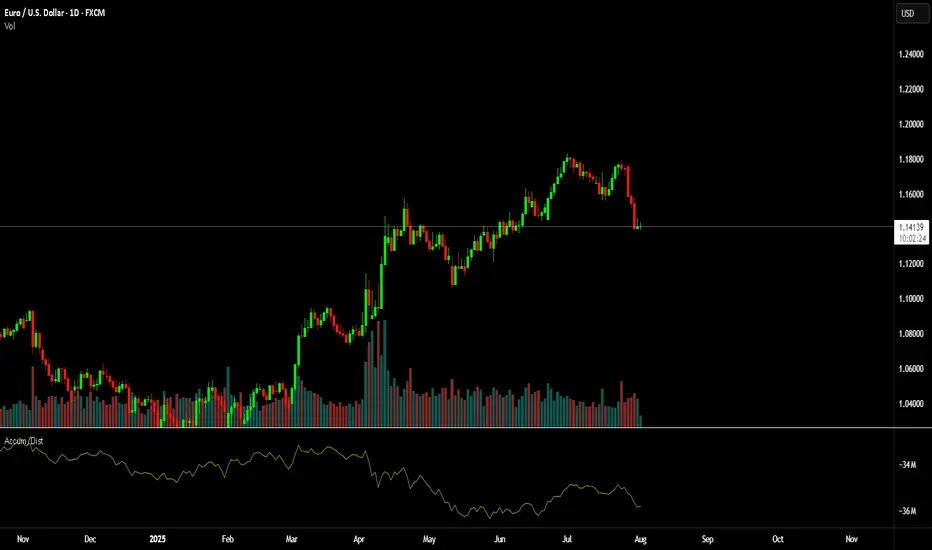
Look at this first image.
Price had moved down since the vertical line, the AD line also moved down - sell-off, in full swing. But then volume starts to shift before the AD line starts to increase.
Now, look at what happens next...
As we move forward and the new vertical line shows where volume spiked, the AD line starts to decrease as the price continues to rise.
This is enough of a story to start your analysis.
We then get a move with a lower high formed.
As this plays out, the sell-side volume rises, creating momentum for the short position.
Look a little closer and you will see, that the volume on the move up just before the drop was also decreasing. Making a divergence to price.
You might feel that the market is against you, or that the big players are single-handedly seeking your stops. But the truth is, the psychology in moves such as this one shown is where most retail traders either have greed that markets will only go up for ever or the fear that they are missing out on a market that only goes up forever.
It is that herd mentality that generates the liquidity for the professionals.
Losing 1% on a trade, is part of the process, risking 80%> on a single move will make you paper rich for about 10 minutes before the real losses set in.
This is where the psychology and the basic techniques such as risk management and understanding what candlesticks and volume bars are telling you, will make a world of difference to your results.
A/D line and volume are free on @TradingView and to be fair you don't need to overcomplicate it more than that!
Stay safe, have a great weekend all!!!
Disclaimer
This idea does not constitute as financial advice. It is for educational purposes only, our principal trader has over 25 years' experience in stocks, ETF's, and Forex. Hence each trade setup might have different hold times, entry or exit conditions, and will vary from the post/idea shared here. You can use the information from this post to make your own trading plan for the instrument discussed. Trading carries a risk; a high percentage of retail traders lose money. Please keep this in mind when entering any trade. Stay safe.
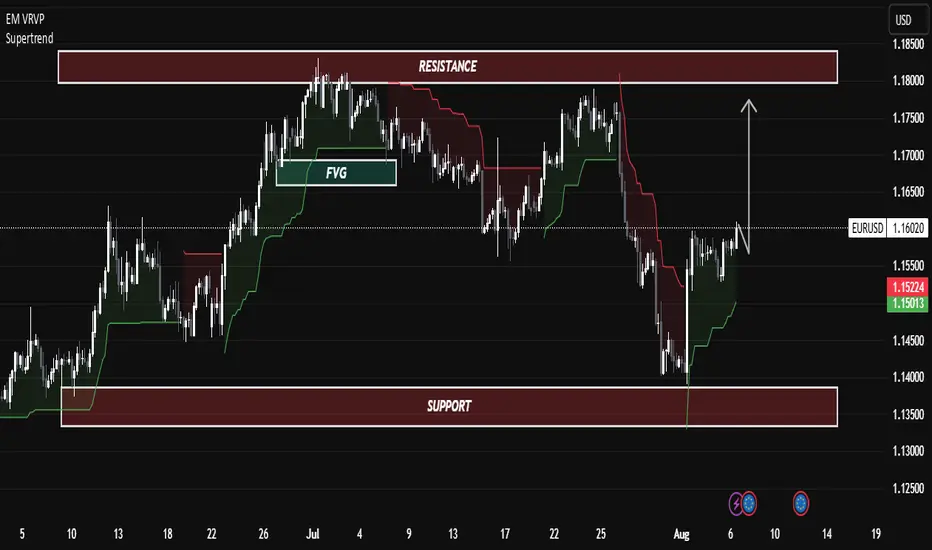
EUR/USD Eyes Bullish Continuation Toward Key Resistance”📊 EUR/USD Chart Analysis (H4 Timeframe) – August 6, 2025
🔍 Market Structure Overview:
Current Price: 1.16086
Trend Context: After a sharp drop toward the 1.14000 support zone, EUR/USD is showing signs of a bullish reversal.
Supertrend Indicator: The Supertrend has flipped bullish, supporting upward momentum.
🧱 Key Levels:
Support Zone: 1.13500 – 1.14200
This level acted as a strong demand area where price reversed sharply.
Resistance Zone: 1.17800 – 1.18500
A major supply zone where price was previously rejected multiple times.
Fair Value Gap (FVG): Between 1.15500 – 1.16500
This imbalance has now been filled, indicating institutional interest and possible price continuation.
📈 Technical Outlook:
Price Action:
The price formed a strong bullish reversal after a sweep of support, indicating possible liquidity grab or accumulation.
Market Objective:
Price is likely targeting the resistance zone near 1.18000, aligned with the arrow shown on the chart.
Supertrend Confirmation:
The flip from red to green further confirms the potential continuation of the bullish leg.
📚 Educational Note:
This is a classic example of price forming a bullish market structure shift after hitting higher timeframe support and then reclaiming the FVG zone. Price breaking and holding above 1.16500 may confirm continuation toward the resistance zone.
✅ Conclusion:
Bias: Bullish
Entry Idea (Educational Purpose):
After confirming a higher low above 1.15500 and strong bullish candle close, entries can be considered toward 1.18000.
Invalidation: A break below 1.14500 would invalidate the bullish setup.
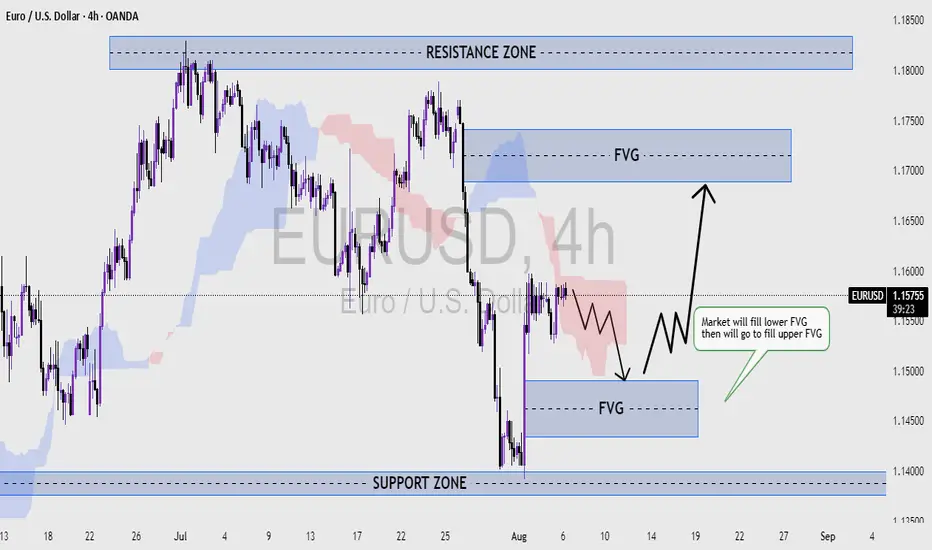
EUR/USD Market Analysis (4H Timeframe)In this analysis of the EUR/USD currency pair, I have meticulously identified key market zones and potential price movements:
Resistance Zone (1.1800 - 1.1850):
A critical level where previous upward momentum faced rejection, indicating strong selling pressure.
Support Zone (1.1400 - 1.1450):
A solid base where buyers have historically stepped in, preventing further decline.
Fair Value Gaps (FVG):
Lower FVG (1.1450 - 1.1500): The market is expected to fill this imbalance first as part of its natural price action.
Upper FVG (1.1650 - 1.1700): Once the lower gap is filled, the price is likely to push upward to fill this imbalance.
Projected Movement:
The price is currently consolidating, suggesting a potential downward move to fill the lower FVG. Following that, a bullish surge toward the upper FVG is anticipated.
By leveraging these insights, traders can strategically position themselves for optimal entry and exit points.