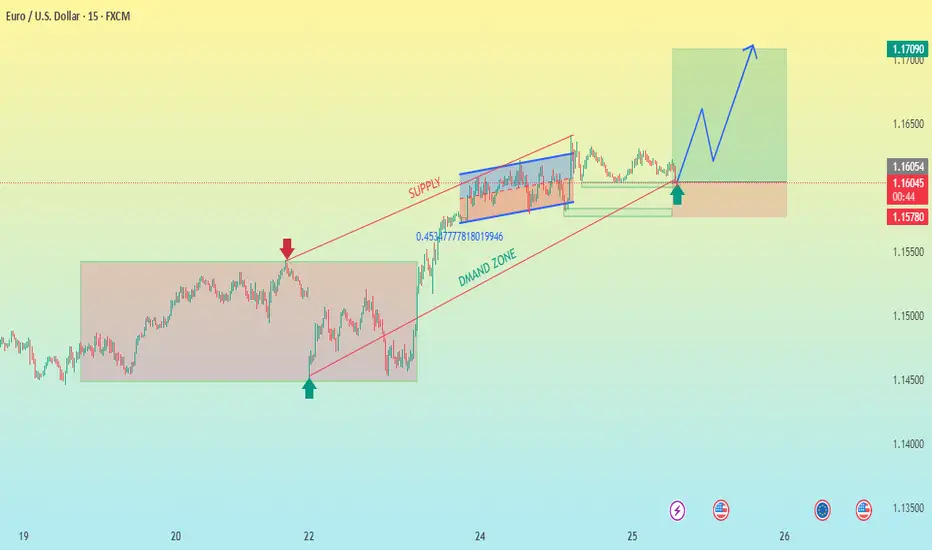
EUR/USD 15 MINUTE CHART PATTERN Thanks for sharing your EUR/USD trade setup. Here's a quick breakdown and risk-reward assessment for your 15-minute BUY entry strategy:
---
🟢 Trade Setup (Long)
Pair: EUR/USD
Entry: 1.16025
Stop Loss: 1.15780
Targets:
🎯 Target 1: 1.16361
🎯 Target 2: 1.16700
🎯 Target 3: 1.17090
---
🔍 Risk/Reward Ratios
Let’s calculate approximate Risk-to-Reward (R:R) for each target:
🔻 Risk: 1.16025 - 1.15780 = 24.5 pips
Reward to Target 1:
1.16361 - 1.16025 = 33.6 pips
✅ R:R ≈ 1.37
Reward to Target 2:
1.16700 - 1.16025 = 67.5 pips
✅ R:R ≈ 2.75
Reward to Target 3:
1.17090 - 1.16025 = 106.5 pips
✅ R:R ≈ 4.35
---
⚠ Key Notes:
Your stop loss is tight (24.5 pips), which is good for managing risk, but watch for minor price noise or wicks around support.
Best suited if price has broken out of consolidation or is in a strong uptrend on M15/M30.
Monitor news events (e.g., USD data, ECB statements) that can spike volatility.
Consider scaling out at each target to lock in profits and reduce exposure.
EURUSD trade ideas
Can it Reach New Highs as USD Weakens?EUR/USD: Euro's Resilience Holds Strong – Can it Reach New Highs as USD Weakens?
🌍 Macro Landscape: EUR/USD Rides Risk-On Sentiment and Fed Cut Hopes
The Euro (EUR) is showing significant strength, maintaining its position near a three-year high against the US Dollar (USD). This resilience is largely fueled by a moderately positive risk appetite in the market.
Simultaneously, the US Dollar is facing considerable downward pressure. This weakness stems from recent weaker-than-expected economic data from the United States and increasing market expectations for the Federal Reserve (Fed) to implement interest rate cuts. If US economic indicators continue to soften, it could solidify the case for earlier Fed rate cuts, further undermining the USD and potentially boosting EUR/USD.
🏦 Central Bank Policy: Diverging Paths for ECB and Fed
Federal Reserve (Fed): The market is increasingly pricing in the likelihood of Fed interest rate cuts. Weaker US data strengthens this narrative, as the Fed might be compelled to ease monetary policy to support economic growth. This dovish outlook for the Fed is a key driver of USD weakness.
European Central Bank (ECB): While the provided information focuses on the EUR's strength due to broader market sentiment and USD weakness, the ECB's more measured approach to monetary policy compared to the Fed's potential easing can create a favorable interest rate differential for the Euro, attracting capital flows.
This divergence in central bank policy expectations—with the Fed leaning towards cuts and the ECB maintaining a more cautious stance—creates a tailwind for the EUR/USD pair.
🌐 Capital Flows: Money Favors Euro Amidst USD Softness
Global capital flow models suggest that funds are increasingly moving towards assets perceived as offering better relative value or stability. As US yields become less attractive due to anticipated Fed rate cuts, capital may flow out of USD-denominated assets.
This outflow from the USD naturally benefits currencies like the Euro, especially given its current positive momentum driven by a moderate risk-on environment. The re-pricing of Fed policy risk directly influences these capital movements, contributing to the upward trajectory of EUR/USD.
📊 Technical Structure (H4 Chart Analysis): EUR/USD Eyes Key Resistance Levels
Based on the provided EUR/USD H4 chart:
Uptrend intact: The pair continues to exhibit a positive trend, characterized by higher lows and higher highs within an ascending channel.
Key Resistance Levels:
Initial Resistance: 1.16330. This level aligns with recent highs and the top of the minor channel. A break above this suggests further bullish momentum.
Major Resistance Zone: 1.17031. This is indicated as a significant resistance area, potentially a long-term target or a reversal point. A break here would confirm strong bullish conviction.
Key Support Levels:
Immediate Support: 1.15470. This level has acted as a support point, aligning with the EMA 200 and a Fibonacci retracement level, indicating a potential bounce area.
Strong Support Zone: 1.15249. This zone represents a robust demand area, aligning with previous price action and serving as a crucial level for bulls to defend.
Moving Averages (EMA 13-34-89-200): The price is trading above the short-term and long-term EMAs, suggesting strong bullish momentum. The EMAs are fanning out and showing a bullish alignment, reinforcing the uptrend.
Projected Price Action: The chart suggests that the price might retrace towards the 1.15470 or 1.15249 support zones before resuming its upward trajectory towards the 1.16330 and potentially 1.17031 resistance levels.
🎯 Trade Strategy Recommendations:
Scenario 1 – BUY the Dip:
Entry: Look for bullish confirmation around 1.15470 - 1.15249.
Stop-Loss: Below 1.15100 (or a level below the 1.15249 support for risk management).
Take-Profit:
TP1: 1.15600
TP2: 1.15800
TP3: 1.16000
TP4: 1.16200
TP5: 1.16330 (Targeting the immediate resistance)
TP6: 1.16500
TP7: 1.16800
TP8: 1.17031 (Targeting the major resistance)
Scenario 2 – SELL the Rally (Counter-trend/Reversal):
Entry: Look for bearish confirmation around 1.16330 - 1.16400 or higher near 1.17031.
Stop-Loss: Above 1.16500 (or above 1.17100 if selling at higher resistance).
Take-Profit:
TP1: 1.16200
TP2: 1.16000
TP3: 1.15800
TP4: 1.15600
TP5: 1.15470 (Targeting the immediate support)
TP6: 1.15249 (Targeting the strong support zone)
⚠️ Key Events to Watch:
Upcoming US Economic Data: Any further weak data could solidify Fed rate cut expectations and weigh on the USD.
ECB Official Statements: Comments from ECB members on inflation or monetary policy could impact EUR's strength.
Global Risk Sentiment: A continued moderate risk-on environment will generally support the EUR against the USD.
Trade smart and stay informed! Wishing everyone a successful trading day!
eurusd updateentry price 1.1329
stop loss update 1.133
take profit
1.153
1.165
1.177
1.194
result we hit first two target
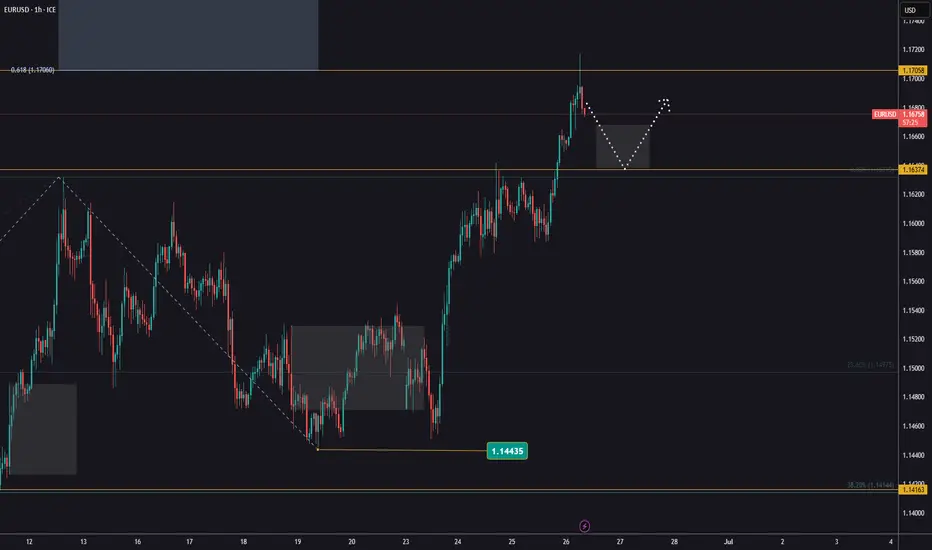
EUR/USD Ready to Explode or Collapse? All Eyes on June 26 🔺 Gann Trend Analysis
The red upward sloping line is a long-term Gann trendline connecting major swing lows since late May.
According to Gann principles, trendlines from major pivots are often tested again before a major reversal.
The annotation “a trend should be tested again” aligns with the Gann philosophy: after price rallies away, it often returns to test the base trendline.
The cluster of vertical blue time cycle lines (June 26) implies an important Gann time window, potentially a reversal point.
📐 Channel & Price Structure
A small ascending wedge/channel is drawn in red, signaling rising but weakening momentum.
Price is now approaching key resistance zones marked in yellow and green (1.1640, 1.1650, 1.1660, 1.1683).
These resistance zones suggest potential exhaustion, making the upper boundary of the channel a sell zone.
🔻 Bearish Scenario & Projections
Blue arrows indicate the expected bearish path after hitting resistance.
The reversal target is the Gann trendline retest zone around 1.1500–1.1520.
A break below this Gann trendline could trigger deeper drops in alignment with time-based cycles.
⚠️ Conclusion
This setup implies:
Bearish divergence between price action and time cycles.
Resistance clusters = likely reversal point.
Retest of the long-term Gann trendline is highly probable.

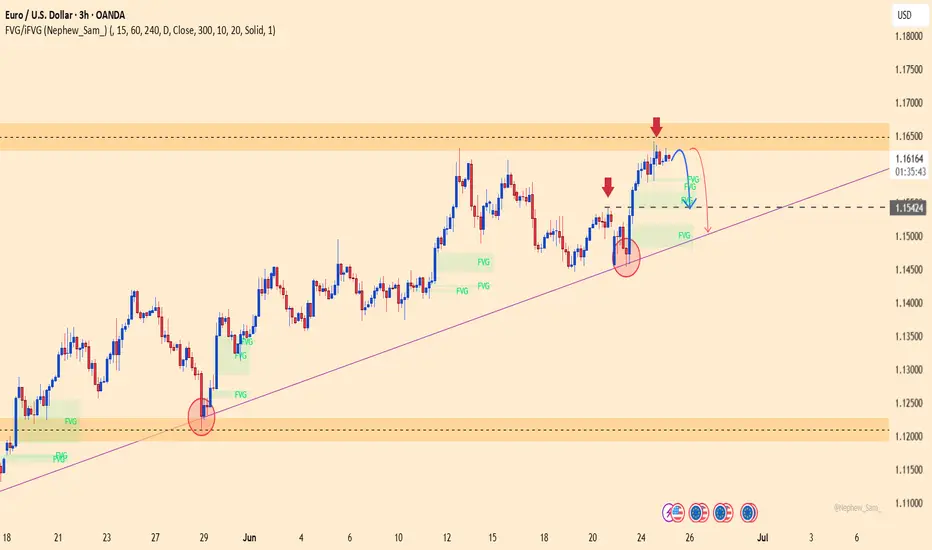
EURUSD – Signs of Weakness, Risk of Trendline BreakEURUSD is showing signs of weakness after a strong rejection at the 1.16300 resistance zone — a level that previously acted as a distribution area. Despite a brief rebound driven by mixed PMI data, the Euro failed to maintain its momentum and is now turning lower.
If price breaks below the support zone around 1.15400 — which aligns with both the trendline and an old FVG — a deeper decline toward the 1.15000 level could be triggered. Continued failure to surpass the 1.16300 resistance would further strengthen the corrective pressure.
On the fundamental side, expectations for the ECB to hold rates steady and weaker-than-expected Eurozone data are dampening the Euro’s outlook. Meanwhile, the US Dollar remains firm on safe-haven demand, with upcoming US GDP and Core PCE data likely to drive short-term direction.
EURUSD - Shifting from Bearish to Bullish Soon!Hello TradingView Family / Fellow Traders. This is Richard, also known as theSignalyst.
📈EURUSD has been overall bullish trading within the rising wedge marked in blue.
Moreover, the orange zone is a strong support!
🏹 Thus, the highlighted blue circle is a strong area to look for buy setups as it is the intersection of support and lower blue trendline acting as a non-horizontal support.
📚 As per my trading style:
As #EURUSD approaches the blue circle zone, I will be looking for bullish reversal setups (like a double bottom pattern, trendline break , and so on...)
📚 Always follow your trading plan regarding entry, risk management, and trade management.
Good luck!
All Strategies Are Good; If Managed Properly!
~Rich
Disclosure: I am part of Trade Nation's Influencer program and receive a monthly fee for using their TradingView charts in my analysis.

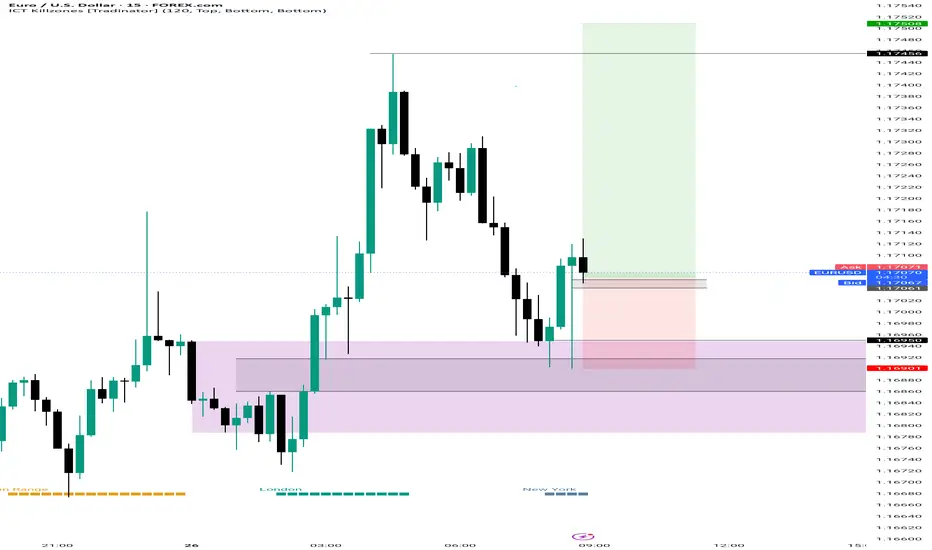
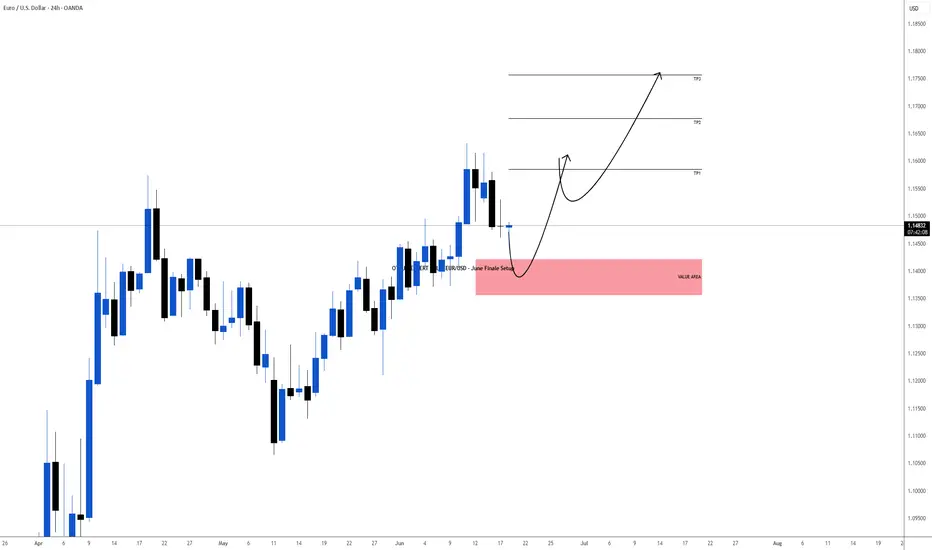
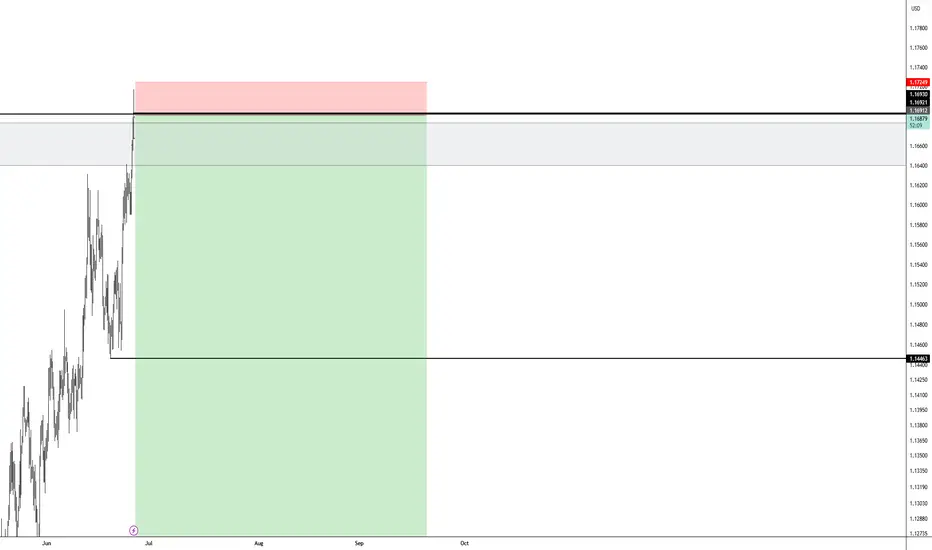
OTEUM EXPERT CALL: EUR/USD – June Finale Setup We’re eyeing the last intramonth swing of June, expected to bleed into early July. Our playbook: let the market cough up one final risk-off spike on the Iran headlines 🌪️📰, then scoop up positions in the value zone (red box) for the next bullish leg 🚀.
Patience first, trigger later 🕰️🎯—wait for price to hit the sweet spot, load up, and ride the firework into summer. Stay nimble; geo-shock headlines can flip the board fast ⚠️.
#EURUSD #Intramonth #RiskOff #ValueHunt #OTEUM

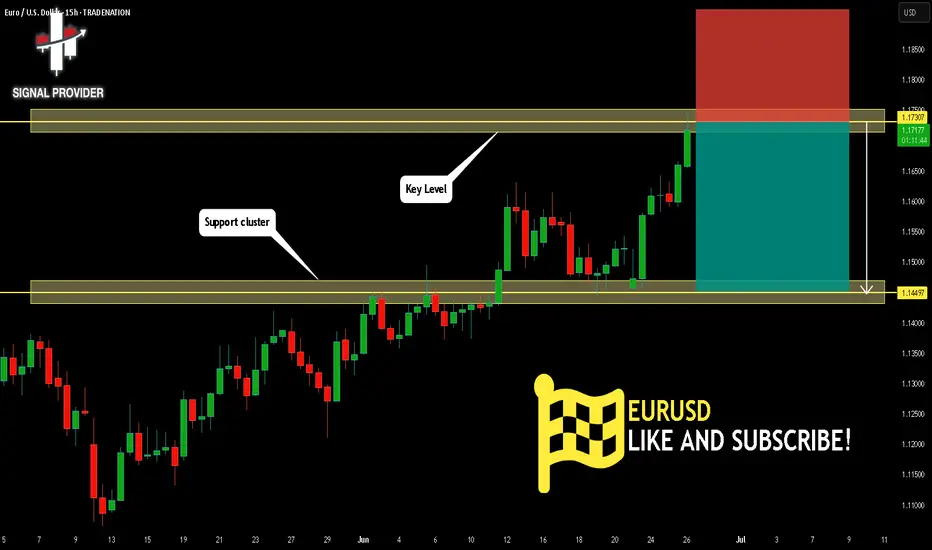
EURUSD Will Move Lower! Short!
Please, check our technical outlook for EURUSD.
Time Frame: 15h
Current Trend: Bearish
Sentiment: Overbought (based on 7-period RSI)
Forecast: Bearish
The price is testing a key resistance 1.173.
Taking into consideration the current market trend & overbought RSI, chances will be high to see a bearish movement to the downside at least to 1.144 level.
P.S
Overbought describes a period of time where there has been a significant and consistent upward move in price over a period of time without much pullback.
Disclosure: I am part of Trade Nation's Influencer program and receive a monthly fee for using their TradingView charts in my analysis.
Like and subscribe and comment my ideas if you enjoy them!
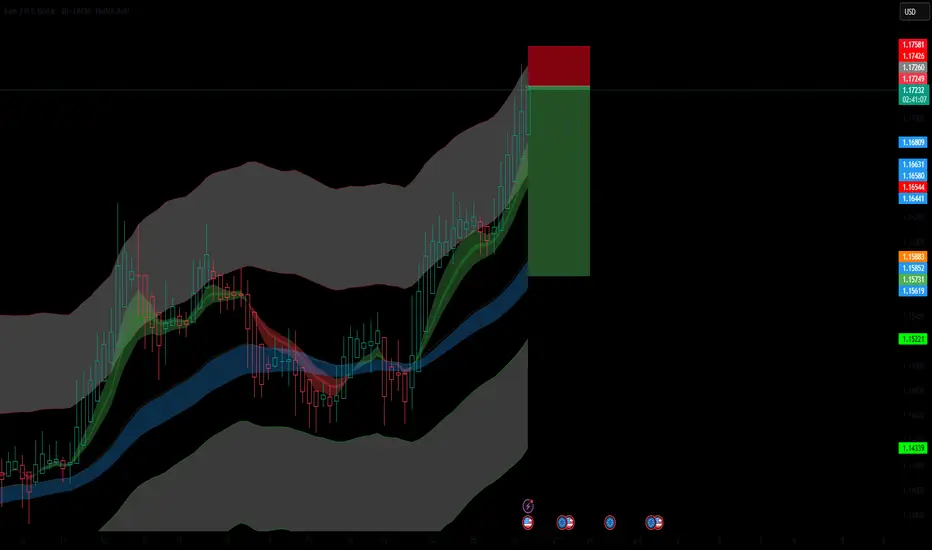
Overextended Rally into Resistance ZoneEUR/USD has pushed into the upper boundary of the Keltner Channel on the 4H timeframe, indicating a potential exhaustion of bullish momentum. Price is showing signs of overextension with Heikin Ashi candles losing strength near a key resistance zone.
📉 Short Position Setup:
Entry: 1.17220 (near upper Keltner resistance)
SL: 1.17581 (above recent highs and volatility buffer)
TP: 1.15220 (targeting mid-channel and previous structure support)
🔻 Bearish Confluence:
Price rejecting upper Keltner band
Potential for mean reversion after strong rally
Weakening bullish momentum in candle structure
Confirmation with further bearish price action or divergence signals would strengthen the case for downside continuation.
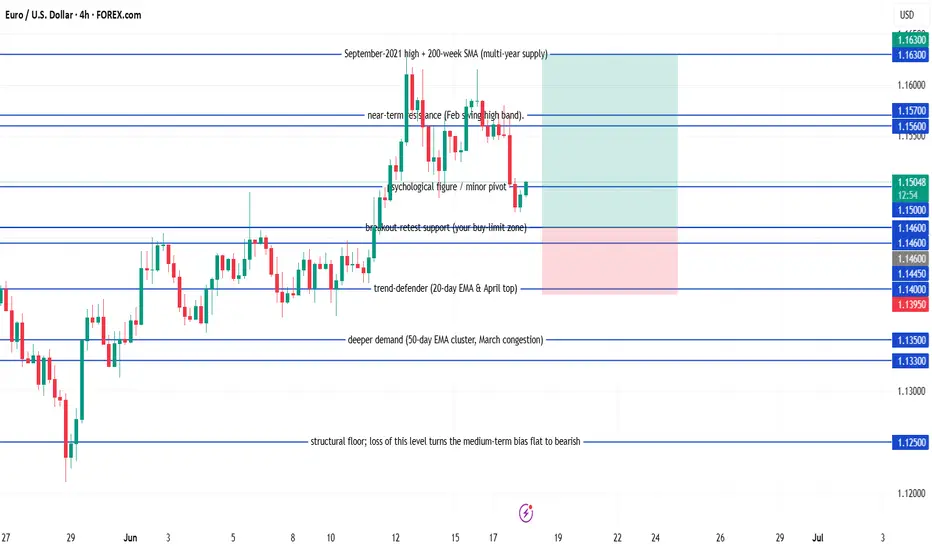
EUR/USD Buy EUR/USD pull-back long
Buy-limit at 1.1460
Stop-loss at 1.1395
Take-profit 1 at 1.1560 – when this first target is reached, move the stop to breakeven
Take-profit 2 at 1.1630
Condition: keep the order active only while the daily candle continues to close at or above 1.1445.
Expiry: if the order hasn’t been filled after five full trading days, cancel it and reassess.
OTEUM EXPERT CALL: EUR/USD – June Finale Setup We’re eyeing the last intramonth swing of June, expected to bleed into early July. Our playbook: let the market cough up one final risk-off spike on the Iran headlines 🌪️📰, then scoop up positions in the value zone (red box) for the next bullish leg 🚀.
Patience first, trigger later 🕰️🎯—wait for price to hit the sweet spot, load up, and ride the firework into summer. Stay nimble; geo-shock headlines can move the board fast ⚠️.
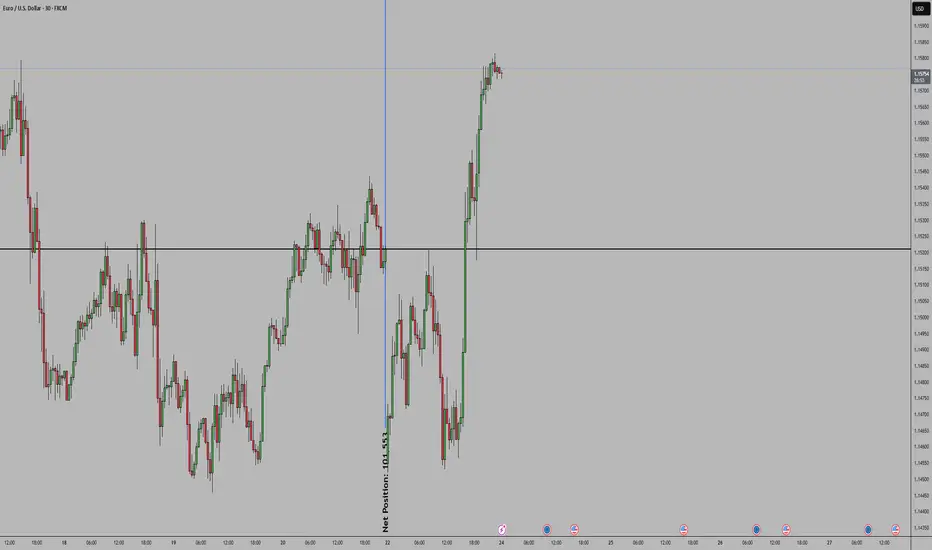
Target achievedThe impulsive rise in EURUSD continues.
This morning, it reached 1,1717 — our first projected target.
This is a good level to take profits.
Now, watch for a pullback and the potential for another move up.
Most of the move should already be captured by this point.
Reduce your risk and avoid using large position sizes.
If the price moves higher again, the next target is 1,1778!
The Reversal We have Been Waiting For!Key level has been tapped, gap is still open to be filled at 1.11690.
Entry at 1.16912
SL above top wick
Black line at the low is tp1
LT trade: Short EU til the rest of the yearFire may burns to the europe continent. price is reaching a hypothetical resistance, it may shoot up these days and heads down
DeGRAM | EURUSD growth in the channel📊 Technical Analysis
● The chart for EURUSD, as indicated in the upper right corner, displays a classic descending wedge pattern, which is typically a bullish reversal signal. Price action has respected the wedge’s lower boundary multiple times, forming a series of higher lows while sellers failed to push the pair below the 1.0670 support zone. The most recent candles show a decisive breakout above the wedge’s upper trendline, accompanied by increased volume, suggesting that buyers are regaining control. This breakout is further validated by the RSI indicator, which has moved out of oversold territory and is now trending upward, confirming the shift in momentum.
● The technical setup is reinforced by the presence of a horizontal resistance level at 1.0750, which has acted as a magnet for price in previous attempts. The chart also highlights a bullish engulfing pattern on the daily timeframe, signaling strong demand and a potential continuation toward the next resistance at 1.0820. The moving averages are beginning to converge, with the shorter-term MA crossing above the longer-term MA, a classic bullish crossover that often precedes sustained upward movement. These factors collectively point to a high-probability scenario for further gains in the EURUSD pair.
💡 Fundamental Analysis
● Recent fundamental developments support the bullish technical outlook. Over the past two days, the Federal Reserve has maintained its policy rate, but forward guidance has hinted at a possible rate cut later this year, which has weighed on the US dollar. Meanwhile, the European Central Bank has adopted a more cautious stance, with the probability of a near-term rate cut decreasing as inflation data remains sticky in the eurozone. Additionally, easing geopolitical tensions in the Middle East and stable US retail sales have reduced safe-haven demand for the dollar, further supporting the euro’s advance.
✨ Summary
● A confirmed breakout above the descending wedge and bullish momentum indicators suggest a long entry on EURUSD above 1.0750, targeting 1.0820. The bullish scenario remains valid as long as price holds above the 1.0670 support. A close below this level would invalidate the setup and call for a reassessment of the trend.
-------------------
Share your opinion in the comments and support the idea with a like. Thanks for your support
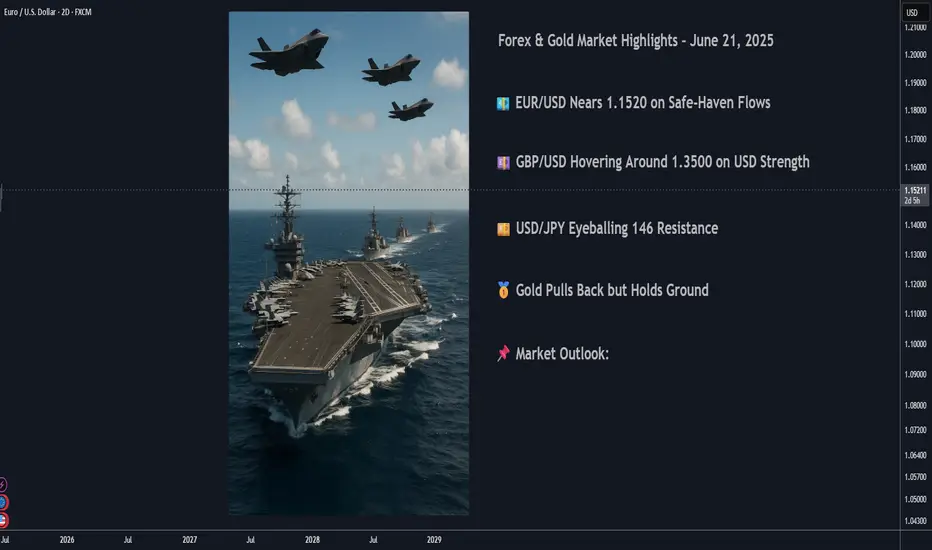
Forex and Gold Market Highlights June 21 2025Forex & Gold Market Highlights – June 21, 2025
🕒 Key Events This Week:
• 🏦 Fed officials signaling possible rate cuts vs. cautious economic tone
• 🌍 Escalating Israel–Iran tensions boosting safe-haven flows
• 🏭 Mixed U.S. macro data (retail sales, Philly Fed, housing) shaping Fed expectations
________________________________________
💶 EUR/USD Nears 1.1520 on Safe-Haven Flows
EUR/USD edged up to about 1.1520 amid weakness in the U.S. dollar, driven by global risk-off sentiment. Mixed signals from the Fed kept traders cautious.
________________________________________
💷 GBP/USD Hovering Around 1.3500 on USD Strength
GBP/USD remains near 1.3500, slipping slightly off highs after weaker UK retail data. The pair faces resistance in the 1.3550–1.3600 zone.
________________________________________
💴 USD/JPY Eyeballing 146 Resistance
USD/JPY climbed toward 146.00, driven by risk-averse USD demand and dovish BOJ stance. The pair is testing key retracement resistance near 146.76.
________________________________________
🥇 Gold Pulls Back but Holds Ground
Spot gold slid to around $3,334 3,381 this week, under pressure from a stronger dollar and diminished Fed rate-cut hopes. Still, geopolitical jitters kept it from falling hard.
• Weekly drop of ~2.5%, trading in a $3,330–$3,400 range.
________________________________________
📈 DXY Index Rallies on Risk Aversion
The U.S. Dollar Index rose ~0.45%, marking its strongest weekly gain in over a month due to heightened safe-haven flows amid Middle East tensions.
________________________________________
📌 Market Outlook:
• EUR/USD: Mixed bias. May test 1.1550–1.1600 if risk-off continues; downside risk near 1.1400 if U.S. data surprises.
• GBP/USD: Expected to stay in the 1.3450–1.3550 range; UK economic data and USD momentum will be key.
• USD/JPY: Bullish tilt remains toward 146.76, but any BOJ hints of policy tightening could shake it.
• Gold: Pressure from a firm dollar is likely to persist. Watch for geopolitical developments and upcoming Fed signals for reversal clues.
EURUSDHello, I hope you have a good day ❤
Please don't forget to support us so that our activities can continue!🚀
The trend of the above times is completely upward and this move is not far from expected.
But since it is the first week of the new month, be sure to observe capital management.
Be profitable💲💎
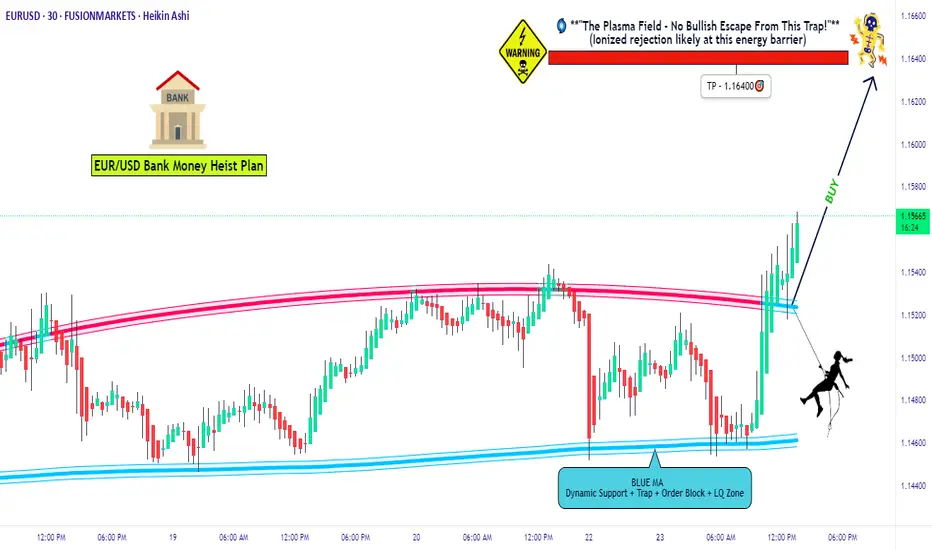
EUR/USD BULL RAID: Quick Profit Heist Before the Drop!🏴☠️ EUR/USD "The Fiber" HEIST ALERT: Bullish Loot Before the Trap! 🚨💰
🌟 Greetings, Market Pirates & Profit Raiders! 🌟
Hola! Oi! Bonjour! Hallo! Marhaba! 🤑
🔥 Thief Trading Strategy Activated! 🔥
Our bullish heist on EUR/USD is LIVE—time to swipe the loot before the bears set their trap! 🎯💸
📈 Entry (Vault is OPEN!):
Buy Limit Orders preferred (15M/30M swing levels).
Alert up! Don’t miss the breakout.
🛑 Stop Loss (Escape Route):
Nearest Swing Low (1.15200) on 30M TF.
Adjust for your risk & lot size—no reckless robberies!
🎯 Target (Profit Hideout): 1.16400
Scalpers: Stick to LONG only—trail your SL to lock gold!
Swing Traders: Ride the wave or split the haul.
⚡ Why This Heist?
Bullish momentum + weak bears = perfect robbery conditions.
Overbought? Yes. Risky? Absolutely. But thieves thrive in chaos!
📢 Pro Tip:
Avoid news spikes (volatility = jail time for unprepared traders).
Trailing SL = Your Getaway Car.
💥 BOOST THIS PLAN!
Hit 👍, share 🔄, and let’s drain this market together! More heists coming—stay tuned! 🚀🐱👤
(Disclaimer: Trade smart. We’re thieves, not gambleers.)
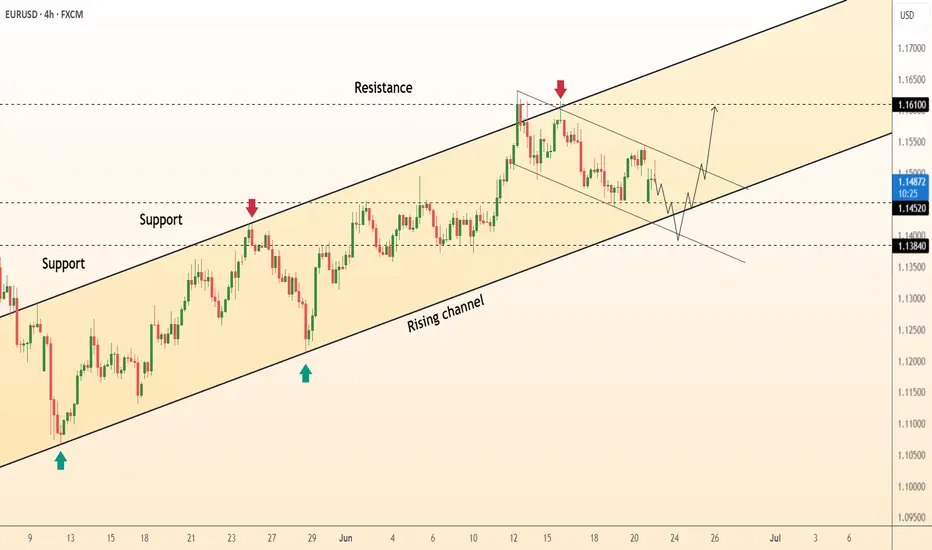
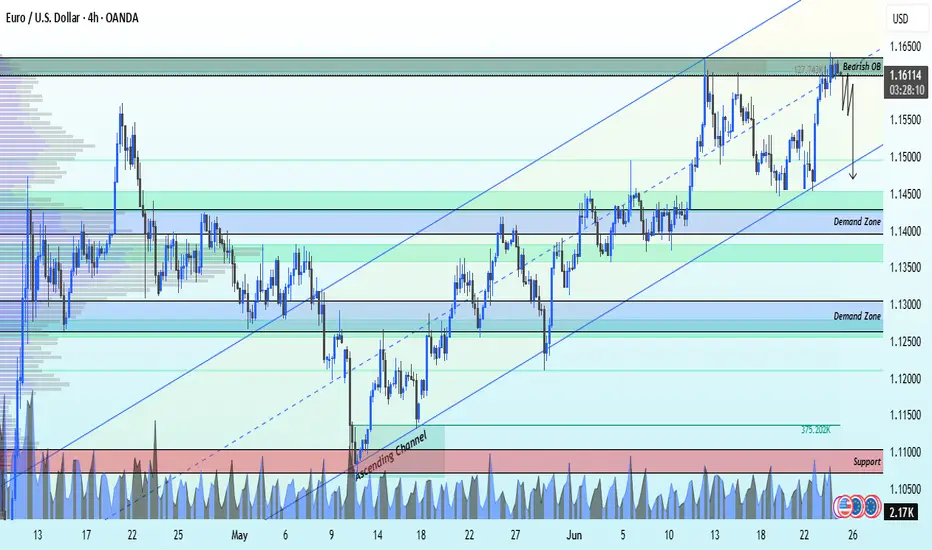
EURUSD Selling From bearish ob at 1.16100 strong sell📉 EURUSD Analysis – 4H Timeframe 📉
The pair is currently respecting an ascending channel, but we’re eyeing a potential reversal from the bearish Order Block (OB) around 1.16100 – a prime sell zone.
🎯 Technical Targets:
1st Target: 1.14500 – Demand Zone
2nd Target: 1.13000 – Demand Zone
3rd Target: 1.11000 – Key Support Level
This setup offers clean risk-reward with price action confirming supply pressure at the top.
🚨 Watch for confirmations before entering – smart entries win the game.
💬 Like, follow, comment your thoughts, and join the team for more real-time updates and insights!
With love,
Livia 😜💹
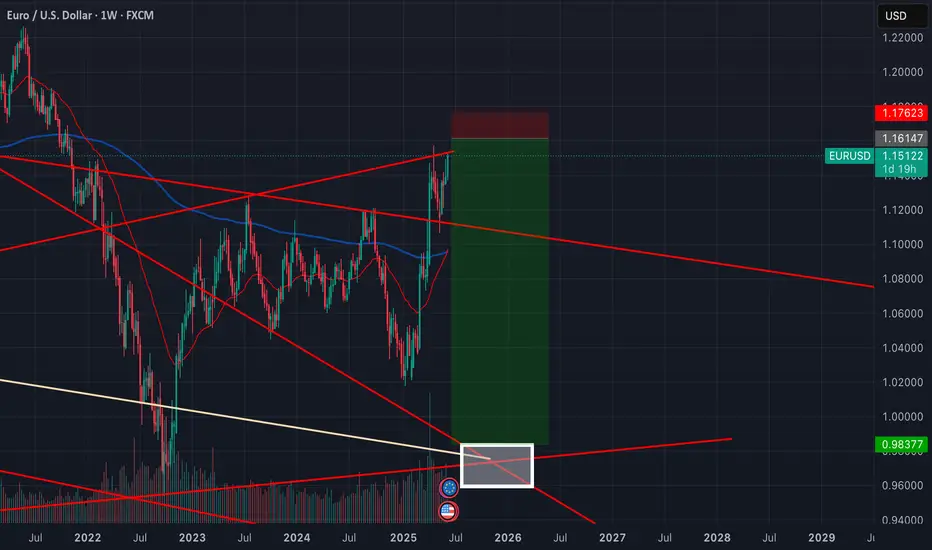
EUR/USD Breaking above Major ResistanceI had posted a short for the EUR/USD a week or 2 ago but I canceled it due to concerns about a major breakdown on the DXY. Well sure enough, my concerns were valid as the DXY continues to break lower, sending the EUR/USD above this weekly trendline going back 5 years. This is huge, if it closes above by the end of the week, the EUR/USD will have broken resistance and will be going much higher.
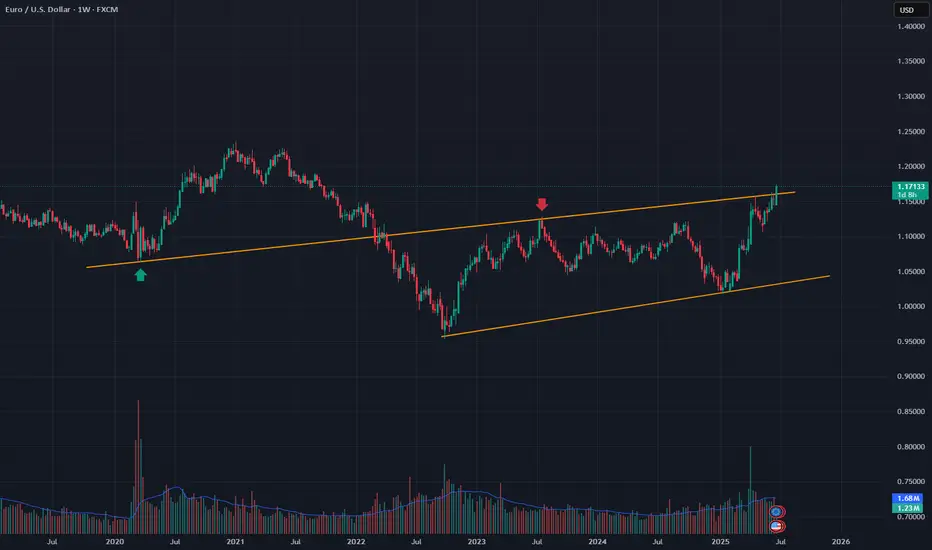
EURUSDCOT Report: Shows net longs on the EUR, indicating a bullish bias for EUR/USD as institutional traders expect the EUR to strengthen against the USD.
Bias: A close above resistance would confirm the bullish bias for EUR/USD.
EURUSD Eyes Higher HighsHi there,
The EUR/USD is showing a bullish setup on the 30-minute chart, with two key price targets in focus and an upside bias toward 1.16867.
I’ve seen a completed ABC corrective pattern, followed by a significant low at point D. This suggests that the recent correction may be over. If momentum continues, the pair could rally from current levels, potentially breaking above the previous swing high at point C to form a new higher high.
Immediate resistance levels to watch are 1.16016 and 1.16311, with the main bullish target at the 0.618 Fibonacci extension near 1.16867. If price holds above the recent low and maintains upward momentum, we can anticipate that these targets remain in play.
Happy Trading,
K.
Not trading advice.
