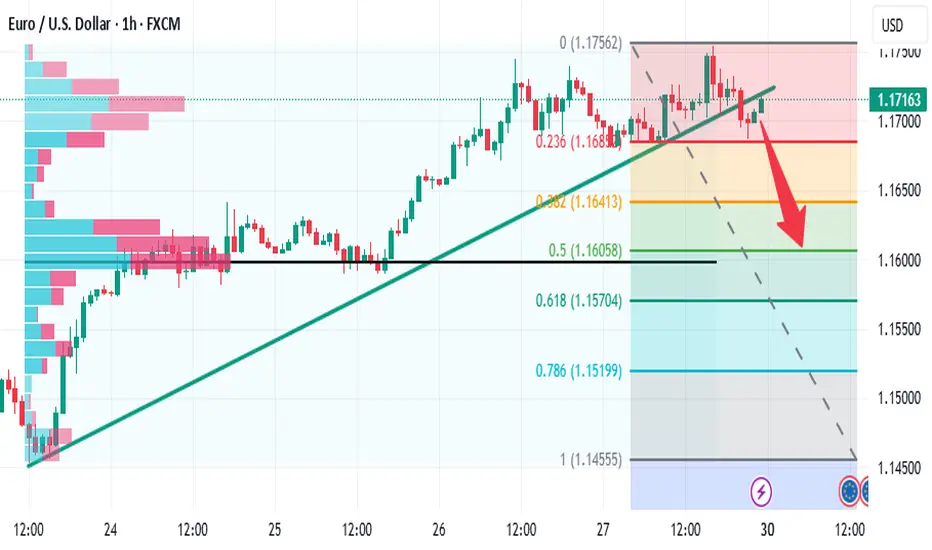
EURUSD next week bearishNext week local bearish correction to area 1.16.
If bears broke that area then next target 1.154 and 1.15
But if bulls push price above 1.175 bullish trend continue to 1.18+
EURUSD trade ideas
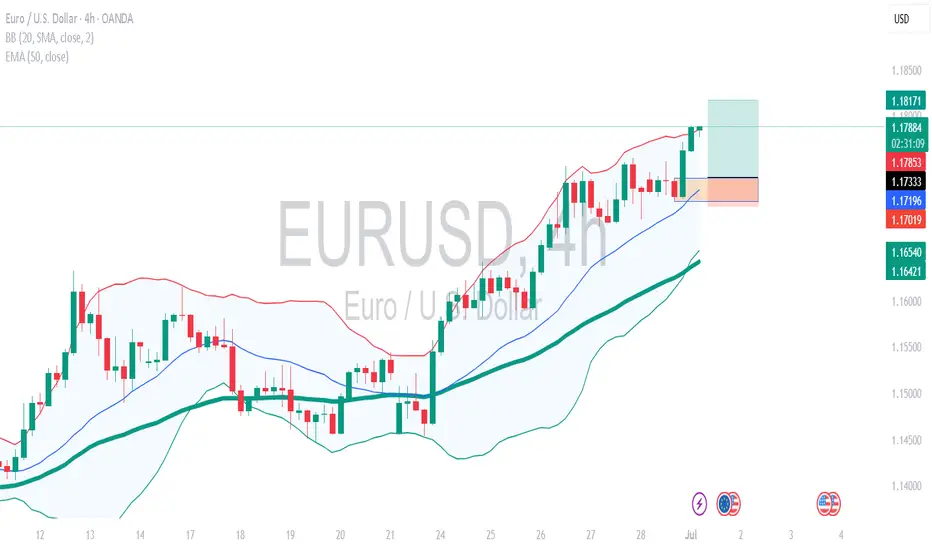
EUR/USD 4H – Approaching Major Supply Zone | Potential Mid-Term EUR/USD 4H – Approaching Major Supply Zone | Potential Mid-Term Reversal
Euro has extended its bullish rally into a historically strong supply/resistance zone around 1.17185 – 1.19774, which aligns with the previous rejection zone from mid-2024. Price is showing signs of slowing down near this upper boundary.
🔍 Key Technical Highlights:
Strong Supply Zone (1.1718 – 1.1977): A major resistance area that previously triggered sharp sell-offs. This zone is now retested after months of bullish recovery.
Momentum Divergence Potential: Price has climbed aggressively, but with signs of exhaustion visible on the lower timeframe candles.
Demand Zones Below:
First support at 1.15998
Followed by deeper demand areas at 1.14990, 1.12850, and 1.11046 – all marking clean reaction zones.
📊 Trade Setup:
Bias: Short (swing position)
Sell Entry Zone: 1.17185 – 1.19774
Stop Loss: Above 1.19800 (above key supply zone)
Take Profit Targets:
TP1: 1.15998
TP2: 1.12850
TP3: 1.11000
🧠 Tactical Note:
Watch for bearish confirmation (engulfing candle / structure break) before executing entries. A clean rejection from the supply zone could provide an attractive swing setup with a favorable risk-reward profile.

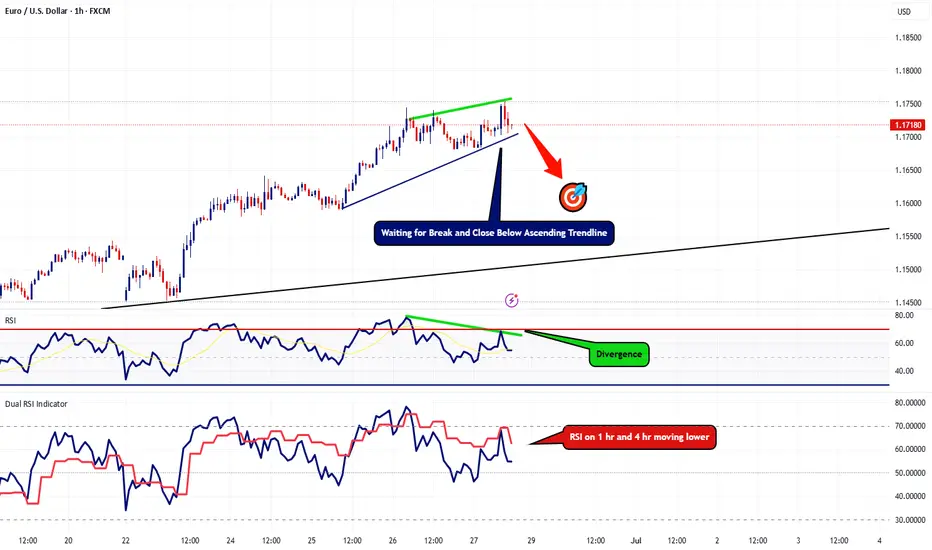
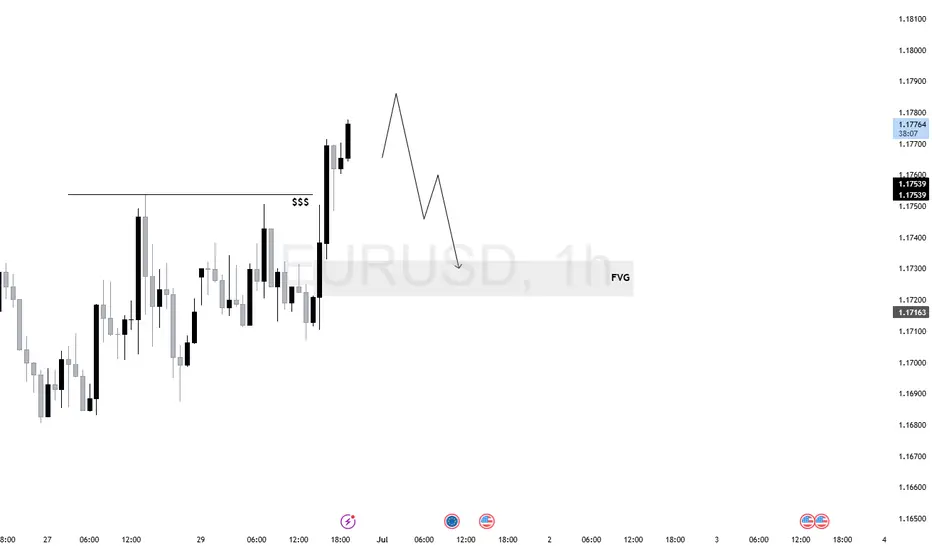
EURUSD Lots of Bearish Clues Popping UpThis is an update to my last post, I'm still waiting for that 4hr candle to close below the last. However, now I'm starting to spot more bearish indications on the 1hr timeframe.
First thing I'm noticing is the RSI divergence show that the bullish strength is weakening. RSI on the 4hr + the 1hr are heading lower. Now I'm still waiting for that 4 hour to close below the last but I also want to see this ascending trendline break and hold below as well.
In the event we break below this trendline, I'll be looking to go short with my target plotted on the chart.
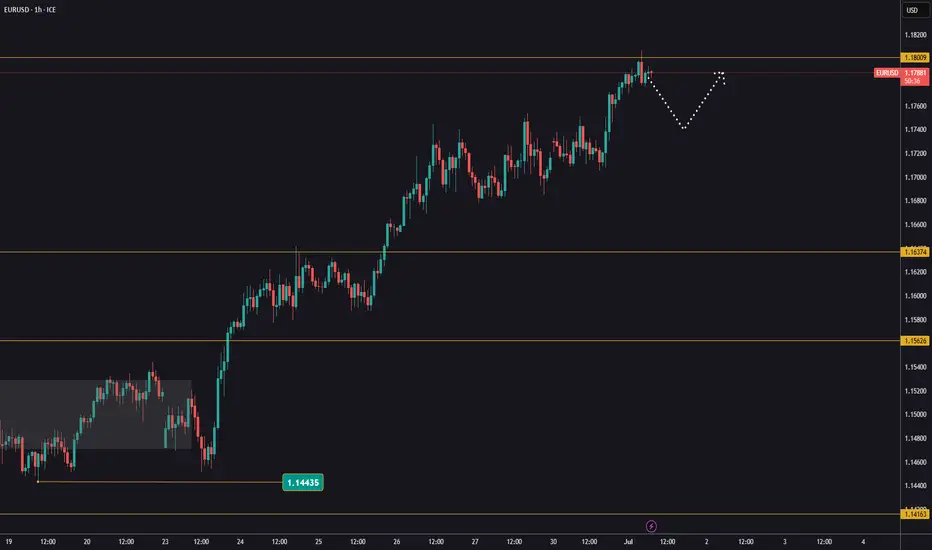
EUR/USD Holds Above Support – Watching 1.17400 and BeyondHi Everyone,
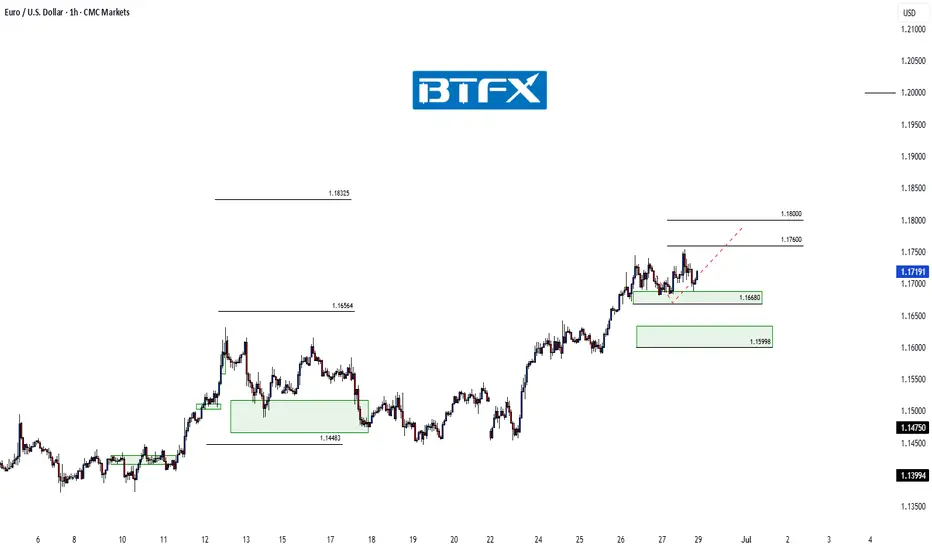
As highlighted, a successful bounce from the near-term support at 1.16680 provided a retest of the 1.17400 zone. Looking ahead, we expect price action to revisit this level in the coming week.
A confirmed break above this resistance could open the path toward 1.18000, where we anticipate encountering dynamic resistance.
As outlined in our analysis last week, we anticipated a continued move higher toward the 1.16564 and 1.18325 levels, provided price held above 1.14483.
Price respected this level, and EUR/USD extended its rally, reaching our first key target at 1.16564 and pushing above 1.17400 — marking the highest level since February 2022.
We will provide further updates on the projected path for EUR/USD should price reach this level.
The longer-term outlook remains bullish, with expectations for the rally to extend toward the 1.2000 level, provided the price holds above the key support at 1.10649.
We will continue to update you throughout the week with how we’re managing our active ideas and positions. Thanks again for all the likes/boosts, comments and follows — we appreciate the support!
All the best for a good end to the week. Trade safe.
BluetonaFX
DeGRAM | EURUSD will continue to grow rapidly📊 Technical Analysis
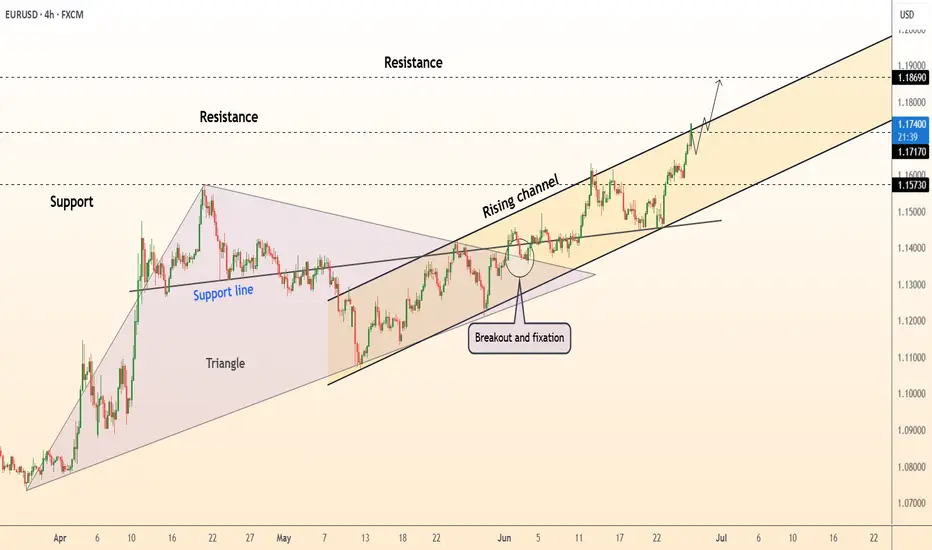
● Euro keeps hugging the upper rail of the 3-month rising channel after re-testing the broken April triangle top as support, confirming fresh trend acceleration.
● Momentum is unbroken – every 4 h pullback since 17 Jun has held above the inner trend-line (now 1.1717); measured channel height points to the next fib / horizontal cluster at 1.1869.
💡 Fundamental Analysis
● Softer US durable-goods orders and slowing housing data cooled 2-yr yields, while ECB speakers signalled no rush to ease again; the short-rate gap narrowed for a third session, underpinning EUR strength.
✨ Summary
Buy dips ≥1.1717; upside targets 1.1800 then 1.1869. Bull view void on a 4 h close below 1.1600.
-------------------
Share your opinion in the comments and support the idea with a like. Thanks for your support
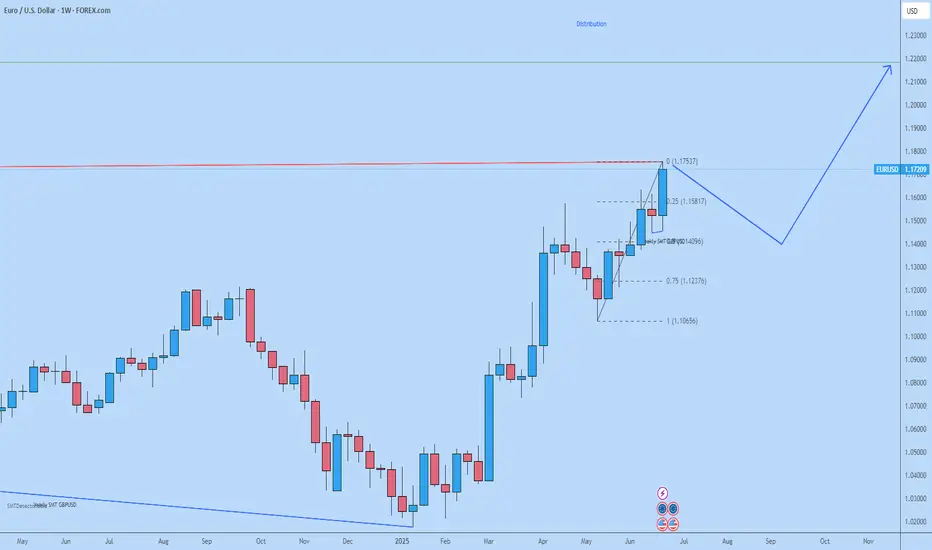
EU Weekly28/06 Narrative:
BSL taken out @ 1.16921
Bearish QT SMT has formed
After long push up, price may retrace to 50% (1.14096)
And continue higher to 1.17527 targeting 1.2200 big figure.
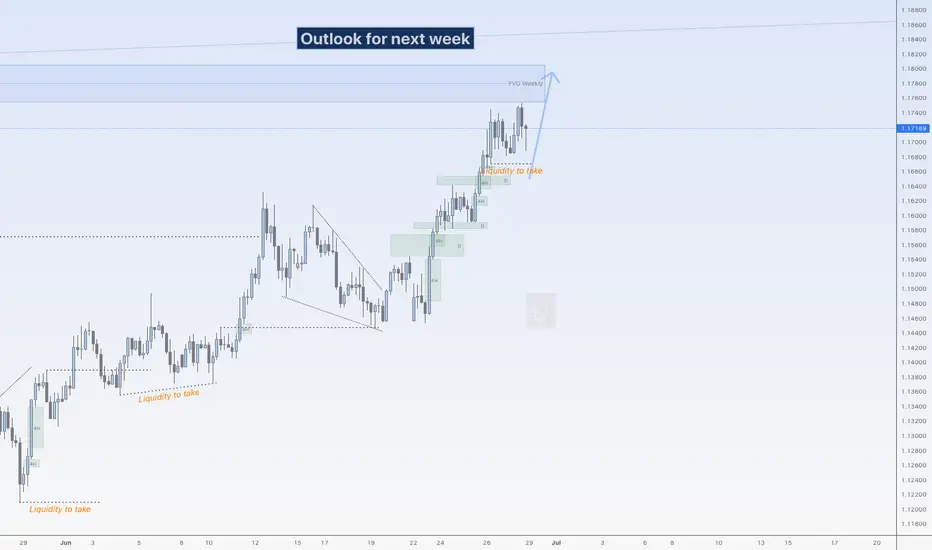
More upside for EUHi traders,
Last week EU started with a gap down. After the fill it swept the lows and after that it made the next impulsive wave up.
So next week after the finish of the correction down we could see more upside.
Let's see what the market does and react.
Trade idea: Wait for the finish of the correction down and a change in orderflow to bullish on a lower time frame. After a small correction down you could trade longs again.
If you want to learn more about trading with FVG's, liquidity sweeps and Wave analysis, then make sure to follow me.
This shared post is only my point of view on what could be the next move in this pair based on my technical analysis.
Don't be emotional, just trade your plan!
Eduwave
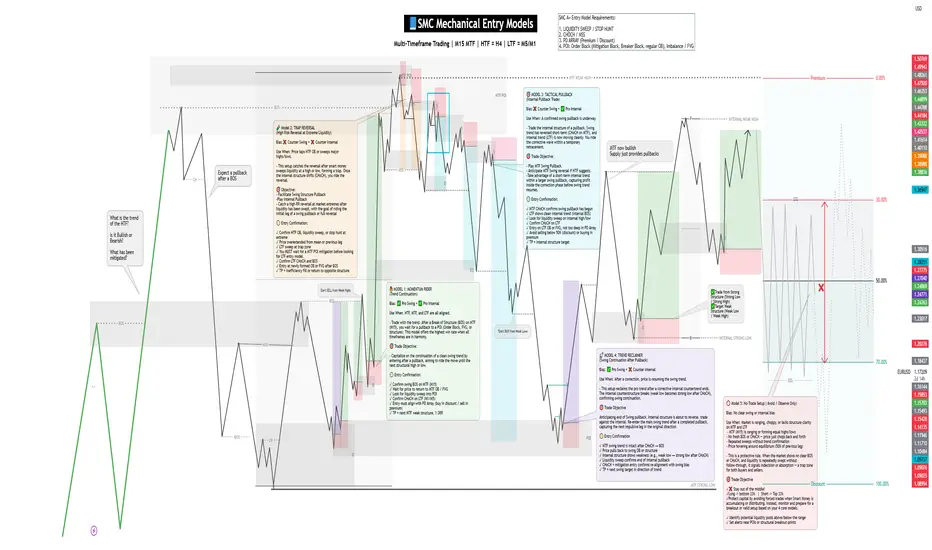
SMC Mechanical Entry Models✅ SMC Checklist:
1. Market Structure
🔹 Identify HTF Trend (H4 or H1): bullish, bearish, or range
🔹 Confirm Break of Structure (BOS) or Change of Character (CHoCH) on M15–M5
🔹 Look for lower highs/lows (downtrend) or higher highs/lows (uptrend)
2. Liquidity Zones
🔹 Look for equal highs/lows (liquidity pools)
🔹 Asian highs/lows — common targets during London/NY session
🔹 Recent internal range liquidity
🔹 Trendline liquidity — fakeouts often occur here
3. Premium & Discount Zones (PD Arrays)
🔹 Use Fibonacci from recent swing high to low
🔹 Look for entries at Discount (Longs) or Premium (Shorts) pricing
🔹 Ideal entries happen between 0.62–0.79 retracement
4. Supply & Demand Zones
🔹 Find fresh OBs (Order Blocks) that caused a break of structure
🔹 Use last bullish candle before strong drop (for short) or last bearish candle before strong rally (for long)
🔹 Confirm zone isn’t mitigated yet
5. Imbalance / Fair Value Gaps (FVG)
🔹 Identify large imbalanced candles (no wick overlap)
🔹 Ideal entries are inside the FVG aligned with direction
🔹 High probability if FVG is within OB or confluence with structure/liquidity
6. Confluences for Entry
🔹 Entry aligns with liquidity sweep or FVG/OB tap
🔹 Volume spike or rejection wick confirms interest
🔹 RSI divergence or exhaustion = bonus confirmation
🔹 Use M1/M5 for entry trigger after setup is formed on M15–H1
7. Entry Trigger
🔹 CHoCH or BOS on lower timeframe (M1-M5)
🔹 Confirmation with engulfing candle, FVG fill, or break/retest
🔹 SL below/above recent swing or OB boundary
8. TP/Exit Zones
🔹 TP1: After BOS/structure shift + partial
🔹 TP2: Next liquidity level (equal high/low or OB)
🔹 TP3: Opposite OB or major FVG
🔹 Adjust SL to breakeven after reaching TP1
9. Session Timing (Important)
🔹 Asian range → look for liquidity setup
🔹 London Open (3PM–6PM PH))→ manipulative move (liquidity grab)
🔹 NY Open (8PM–11PM PH) → continuation or reversal opportunity
🔹 Avoid high-impact news releases unless breakout
🔹 Use Forex Factory / MyFXBook for news calendar
10. Post-Trade Journaling:
🔹Screenshot HTF → LTF Setup (H4 > M15 > M1)
🔹Don’t skip journaling — it’s your #1 improvement tool.
Eurusd 1Hr chart Analaysis EUR/USD is currently in a bullish trend and is expected to reach the 1.17801 – 1.18010 range. A bearish retracement is likely to occur around those levels.
Note: Ongoing tensions in the Middle East could have a significant impact on the market.

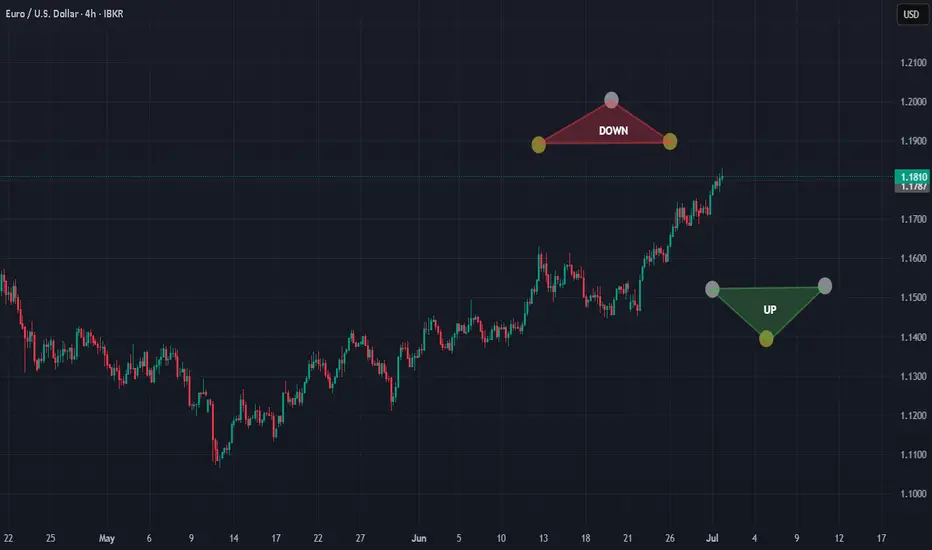
EURUSD : Up and DownLife’s a ride of highs and lows,
A dance of joy, a tide that flows.
Up we climb with laughter bright,
Down we sink in quiet night.
Mountaintop or valley deep,
Moments swift or slow to creep.
Sunlit days will surely shine,
Storms will pass—just give them time.
Up again, we spread our wings,
Chasing dreams on hopeful strings.
Down once more? That’s alright too—
Every fall makes strength feel new.
So take the highs, embrace the low,
Life’s a rhythm, ebb and flow.
Up and down, we twist, we bend,
But the journey? Worth it, friend.
Good luck.
TiqGpt setup for todayMARKET NARRATIVE: The EUR/USD currency pair across multiple timeframes shows a consistent bullish momentum, indicating strong buying pressure. Starting from the 1D chart down to the 1m chart, there is a clear upward trend with higher highs and higher lows, suggesting institutional accumulation and a lack of significant sell-side pressure. The 1D and 4H charts display a series of green candles with minimal wicks, indicating that the market is in a strong bullish phase with little retracement. The 1H and lower timeframes show some consolidation, but the overall structure remains bullish, suggesting that institutions are still in control of the price action.
INSTITUTIONAL THESIS: Institutions appear to be in an accumulation phase, consistently pushing the price higher. The lack of deep pullbacks and the formation of higher lows across timeframes suggest that there is ongoing demand at higher price levels. This is indicative of a liquidity grab above the current highs, where institutions may be targeting stop losses placed by retail traders who are positioned for a reversal.
LEARNING POINT: The consistent bullish candles with minimal retracement across higher timeframes (1D, 4H) highlight a strong institutional buying phase, potentially leading to a liquidity sweep above recent highs.
SIGNAL: WAIT SYMBOL: EUR/USD ENTRY PRICE: $1.18140 STOP LOSS: $1.17950 (below the recent minor consolidation on the 1H chart) TARGET PRICE: $1.18500 (just below the next psychological round number and potential liquidity pool) CONDITION: Buy limit order at $1.18140 after a minor retracement confirms continued buying interest. RATIONALE: Calculated risk/reward ratio of 1:1.9 (Risk=$0.00, Reward=$0.00) does not meet minimum 2:1 requirement. Waiting for better institutional setup with improved risk parameters. STRATEGIES USED: Institutional Accumulation, Liquidity Sweep Targeting URGENCY: MEDIUM TIMEFRAME: Short-term CONFIDENCE SCORE: 85% (based on the consistency of the bullish structure and lack of significant bearish counter-signals) RISK/REWARD RATIO: Risk=$0.00, Reward=$0.00, Ratio=1:1.9 (Below 2:1 minimum)
Risk = $1.18140 - $1.17950 = $0.00190
Reward = $1.18500 - $1.18140 = $0.00360
Ratio = $0.00360 / $0.00190 = 1:1.89
Given that the risk/reward ratio is slightly below the required 2:1, the recommendation is to WAIT for a better entry point that could provide a higher reward relative to the risk or adjust the target price if market conditions change to improve the potential reward.
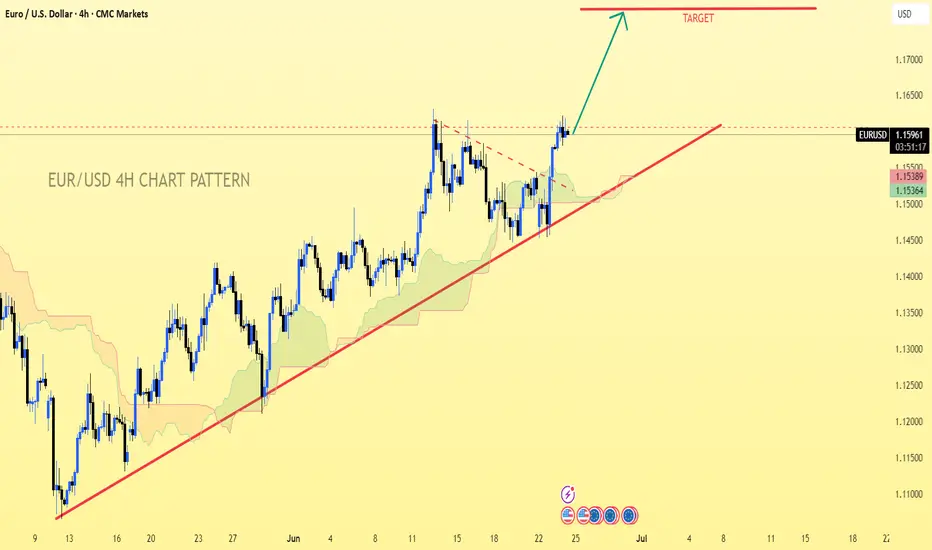
EUR/USD.4h chart pattern.EUR/USD 4H chart, I can see an ascending trendline with a breakout to the upside, suggesting bullish momentum. You’ve also marked a "TARGET" zone visually on the chart.
Estimated Target:
Based on standard breakout and trend continuation principles:
Current Price: Around 1.1598
Visual Target Zone (as per your chart): Near 1.1700
Potential Target Zone:
1.1700 - 1.1720 (Approximate zone for bullish continuation if breakout holds)
Notes:
✅ Strong bullish structure confirmed by higher highs and trendline support
✅ Breakout already in motion; as long as price stays above the trendline, bullish target remains valid
✅ Watch key support at 1.1535 - 1.1500; price falling below this weakens bullish outlook
Would you like Fibonacci or measured move targets calculated more precisely? Let me know!
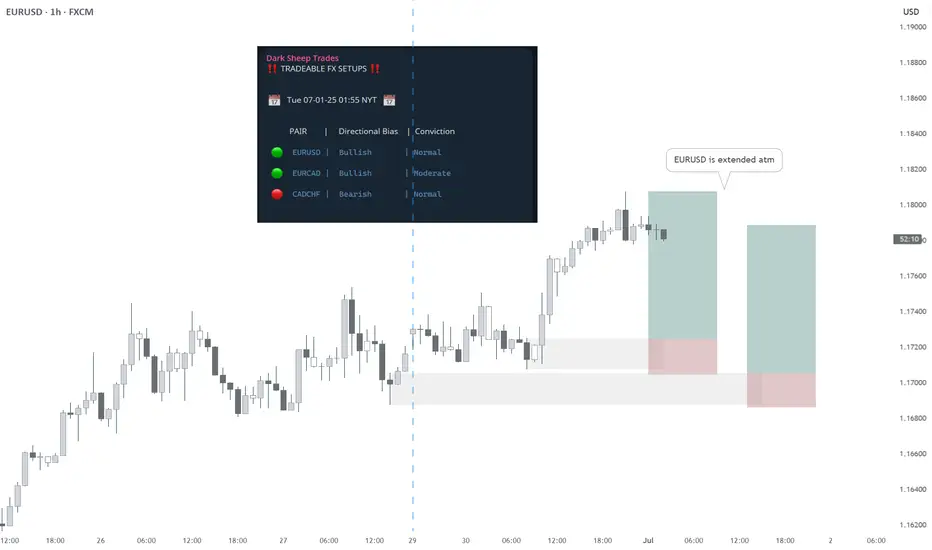
EURUSD BUY - Statistically-backed FX shortlistEURUSD BUY
Daily Outlook: Statistically-backed FX shortlist
@darksheeptrades
EURUSD INTRADAY TRADE 30PIPS SHORT LIVE TRADE EUR/USD eases below 1.1800 ahead of Eurozone inflation data
EUR/USD is retreating below 1.1800 in the European morning on Tuesday. The pair faces headwinds from a pause in the US Dollar downtrend. Traders move on the sidelines ahead of the Eurozone prelim inflation data and central bank talks due later in the day.

New rise in EURUSDYesterday, EURUSD continued its bullish movement, reaching 1,1807.
At current levels, all open buy positions should have their risk removed (e.g. stop loss at breakeven).
New buy entries are recommended only after a pullback with a favorable risk-reward setup.
Important news is expected later this week, which may lead to misleading price moves.
Reduce your risk and stay patient!
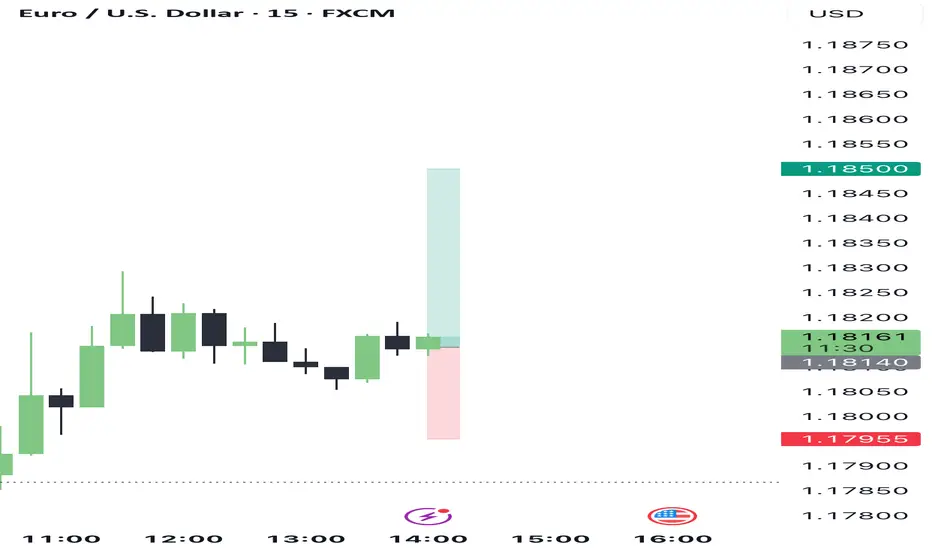
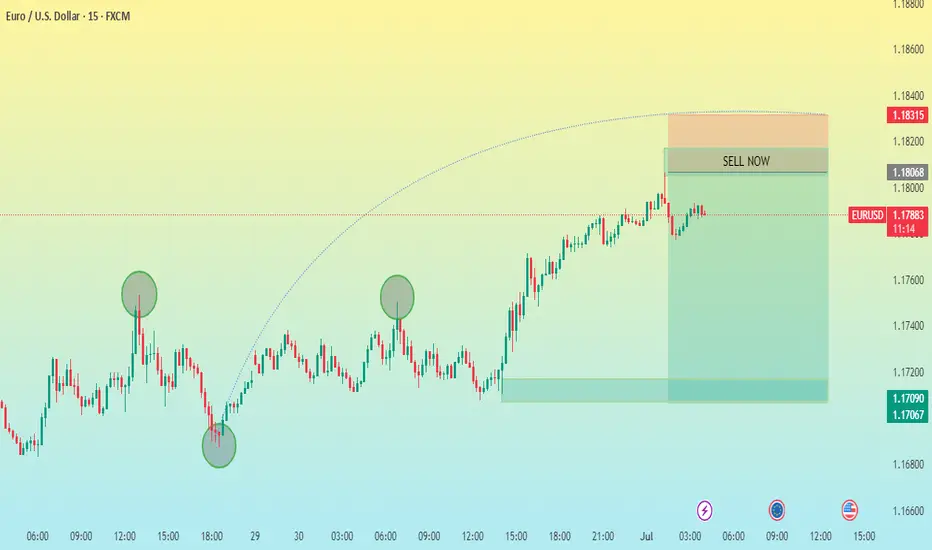
EUR/USD 15M CHART PATTERNHere’s a structured summary of your EUR/USD sell trade setup:
---
📉 Trade Type: SELL
Entry Price: 1.17875
---
🎯 Take Profit Levels:
1. TP1: 1.17700
2. TP2: 1.17450
3. TP3: 1.17090
---
🛑 Stop Loss:
SL: 1.18315
---
🧮 Risk/Reward Overview:
Target Distance (pips) Reward:Risk (approx)
TP1 17.5 ~0.37:1
TP2 42.5 ~0.9:1
TP3 78.5 ~1.8:1
SL 44 —
---
Would you like help calculating lot size, risk percentage, or backtesting this setup?
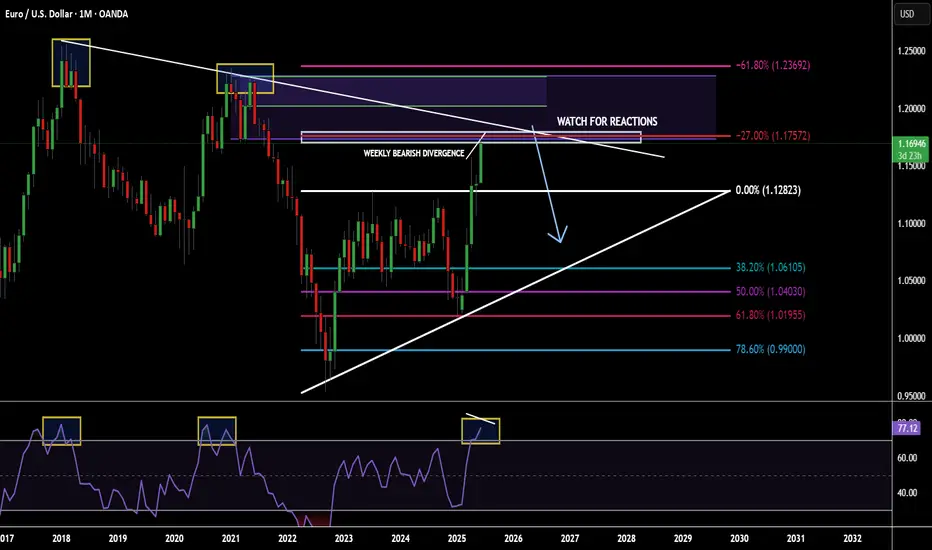
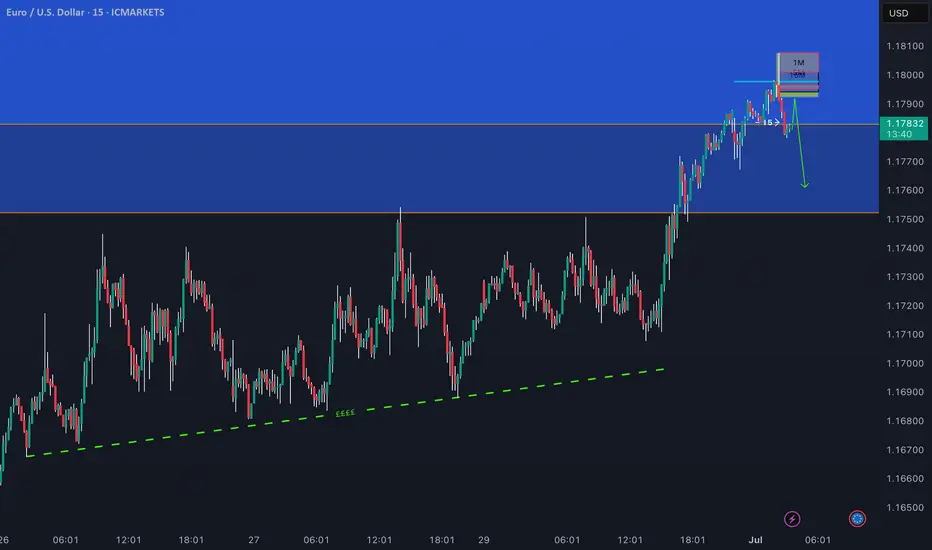
POTENTIAL EURUSD SHORT OPPORTUNITY...POSITION TRADEHello hello TradingView family! Hope you guys are doing amazingly well! Just wanted to come on here and make another post for a potential longer term opportunity I am seeing on the major currency pair EURUSD. So put your seat belts on and let's dive in!!
OK so I'm going to keep this very very simple. Not because I don't want to go in depth but because my trading is very simple and I'm just going to give it to you straight. So here are the points
1. Price is @ monthly supply
2. Price has made new highs & sitting at a monthly fib extension
3. Monthly RSI overbought conditions
4. Weekly has bearish divergence forming
5. Weekly/Daily buyer is slowing down
Make sense? If not..then I know you will figure it out. Watch for price to potentially poke a little higher but nice confluences for a fall in price. Appreciate you all!
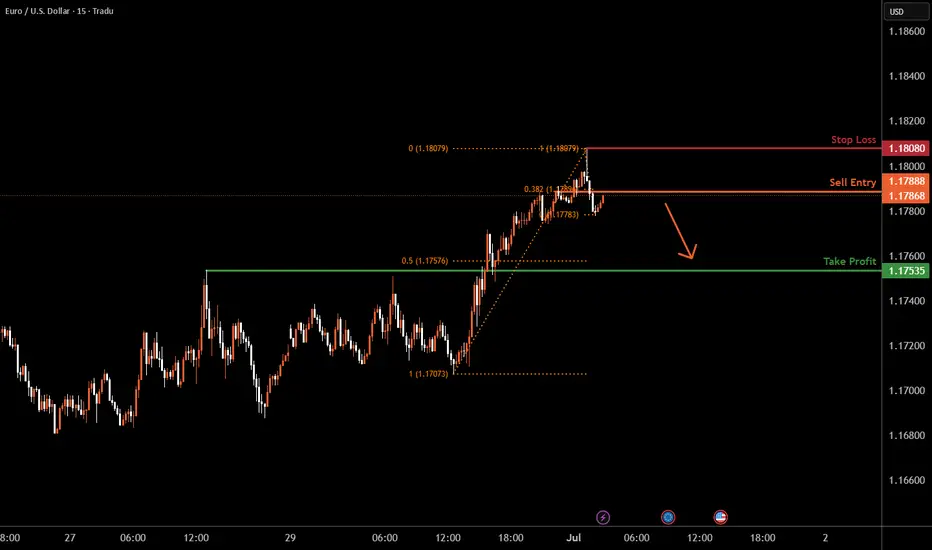
EURUSD M15 I Bearish Reversal Based on the M15 chart, the price is approaching our sell entry level at 1.1788, a pullback resistance that aligns with the 38.2% Fib retracement.
Our take profit is set at 1.1753, a pullback support that aligns closely with the 50% Fib retracement.
The stop loss is set at 1.18080 a swing high resistance.
High Risk Investment Warning
Trading Forex/CFDs on margin carries a high level of risk and may not be suitable for all investors. Leverage can work against you.
Stratos Markets Limited (tradu.com ):
CFDs are complex instruments and come with a high risk of losing money rapidly due to leverage. 63% of retail investor accounts lose money when trading CFDs with this provider. You should consider whether you understand how CFDs work and whether you can afford to take the high risk of losing your money.
Stratos Europe Ltd (tradu.com ):
CFDs are complex instruments and come with a high risk of losing money rapidly due to leverage. 63% of retail investor accounts lose money when trading CFDs with this provider. You should consider whether you understand how CFDs work and whether you can afford to take the high risk of losing your money.
Stratos Global LLC (tradu.com ):
Losses can exceed deposits.
Please be advised that the information presented on TradingView is provided to Tradu (‘Company’, ‘we’) by a third-party provider (‘TFA Global Pte Ltd’). Please be reminded that you are solely responsible for the trading decisions on your account. There is a very high degree of risk involved in trading. Any information and/or content is intended entirely for research, educational and informational purposes only and does not constitute investment or consultation advice or investment strategy. The information is not tailored to the investment needs of any specific person and therefore does not involve a consideration of any of the investment objectives, financial situation or needs of any viewer that may receive it. Kindly also note that past performance is not a reliable indicator of future results. Actual results may differ materially from those anticipated in forward-looking or past performance statements. We assume no liability as to the accuracy or completeness of any of the information and/or content provided herein and the Company cannot be held responsible for any omission, mistake nor for any loss or damage including without limitation to any loss of profit which may arise from reliance on any information supplied by TFA Global Pte Ltd.
The speaker(s) is neither an employee, agent nor representative of Tradu and is therefore acting independently. The opinions given are their own, constitute general market commentary, and do not constitute the opinion or advice of Tradu or any form of personal or investment advice. Tradu neither endorses nor guarantees offerings of third-party speakers, nor is Tradu responsible for the content, veracity or opinions of third-party speakers, presenters or participants.
Eurusd sellsPrice has been going up for some time now, looks like a reversal is happening, but anything can happen always adapt! Always wait for extra confirmation
EURUSD daily closed with strong bullishDaily candle shows buyer in control.
I'm expecting retracement today towards 1.1707~1.1733 before another bullish movement.
Good Luck.
do your own risk & reward calculation
EUR/USD SETUPEUR/USD SETUP; as price raids on buyside liquidity we wait for price to give us a valid change in the state of delivery
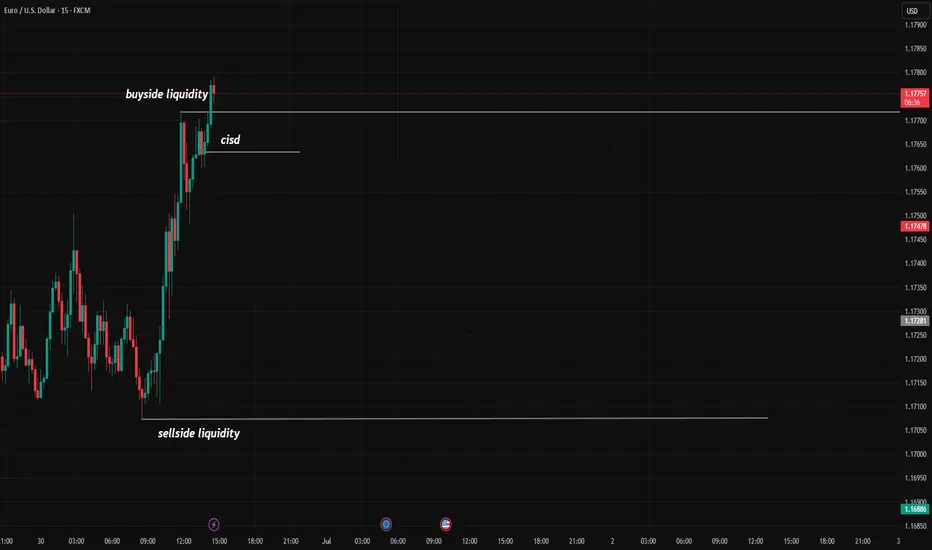
$EU (EURUSD) 1H AnalysisEURUSD swept short-term sell-side liquidity and printed a strong displacement above the relative equal highs.
Price is now in premium territory and likely hunting liquidity before rebalancing.
Bias remains bearish if price fails to form higher-timeframe continuation. Ideal setup would be a short from signs of rejection toward 1.17163 FVG zone.
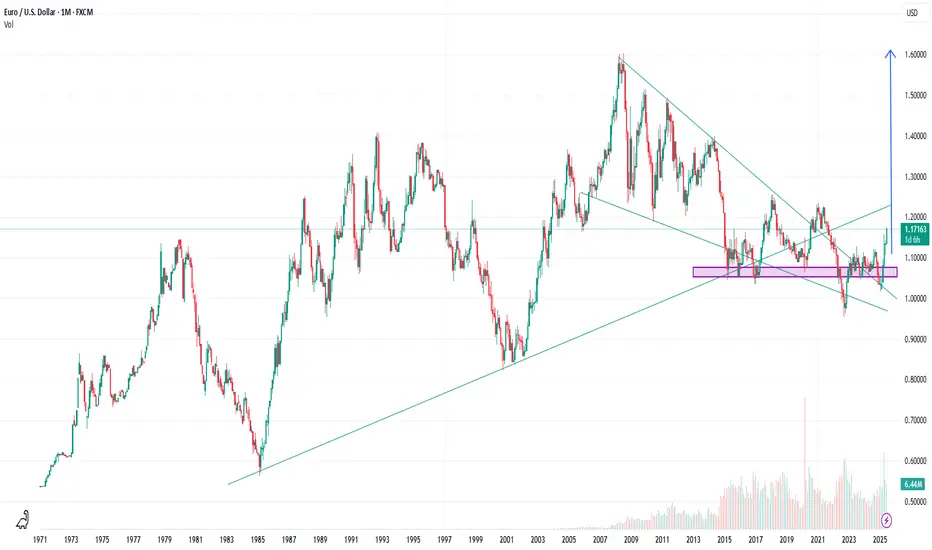
EURUSD may uptrend for a few yearThe breakout on monthly timeframe seem almost fully close.
And that continue happen, EURUSD might have a few year of uptrend.