EURUSD consider on support and resistance zone togetherEURUSD now on resistance area i expect the price will break and form head and shoulder
on the other hand, may this area is strong and the price make down trend ,but we should wait candle pattern on this area to take sell
you must wait price action to take good trade with risk to reward 1:3
good luck
EURUSD trade ideas

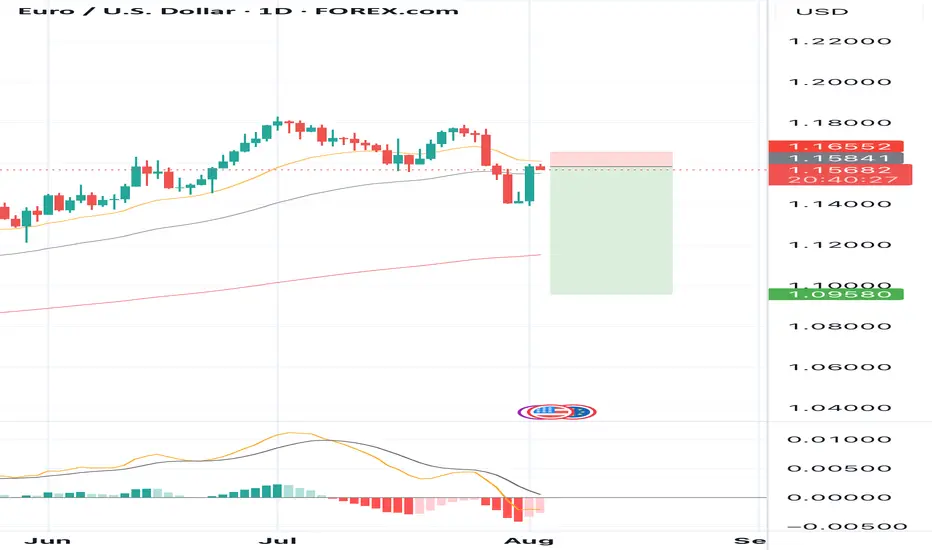
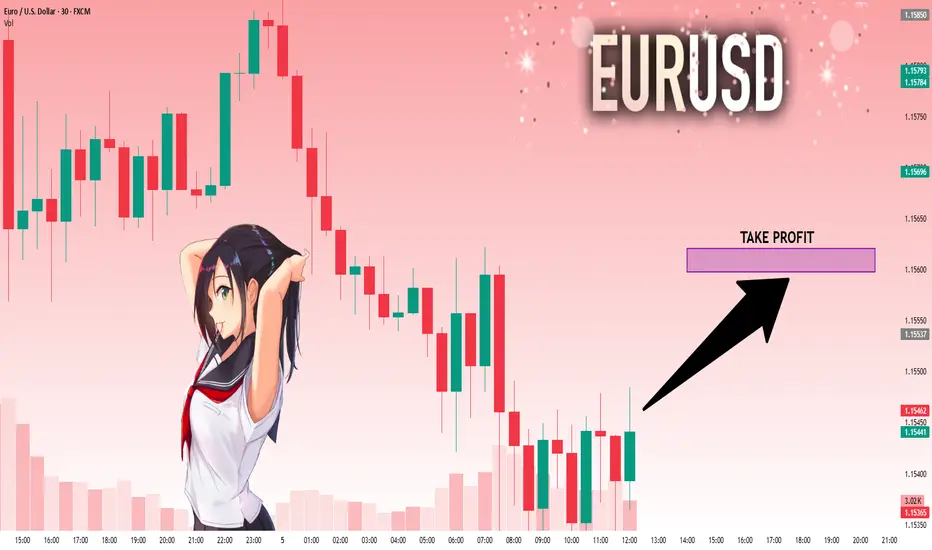
SELL EURUSD for bullish divergence trend reversal STOP LOSS: 1.1SELL EURUSD for bullish divergence trend reversal STOP LOSS: 1.1655
Regular Bearish Divergence
In case of Regular Bearish Divergence:
* The Indicator shows Lower Highs
* Actual Market Price shows Higher Highs
We can see a strong divergence on the MACD already and There is a strong trend reversal on the daily time frame chart.....
The daily time frame is showing strength of trend reversal from this level resistance so we are looking for the trend reversal and correction push from here .....
TAKE PROFIT: take profit will be when the trend comes to an end, feel from to send me a direct DM if you have any question about take profit or anything
Remember to risk only what you are comfortable with........
EU|Bullish Structure Holding| 4H OB + Inducement Sweep Lining Up(Refined & Structured):
• Pair: EURUSD
• Bias: Bullish
• 4H Overview: Clean bullish structure is intact with bullish intent already shown. After breaking a recent high, price swept sell-side liquidity and inducement, tapping directly into a 4H order block.
• 30M Structure: Watching for a clear change of character—specifically a break of a 30M lower high. Once that happens and price sweeps internal liquidity into the 30M OB, I’ll begin hunting confirmation.
• Entry Zone: After internal OB mitigation, I’ll drop to the 5M for a strong church-level confirmation. Execution follows once the story completes.
• Targets: 5M to 30M highs depending on delivery.
• Mindset Note: Right now it’s analysis mode. Structure is unfolding beautifully. Patience, precision, and price reading—this is where the game’s won.
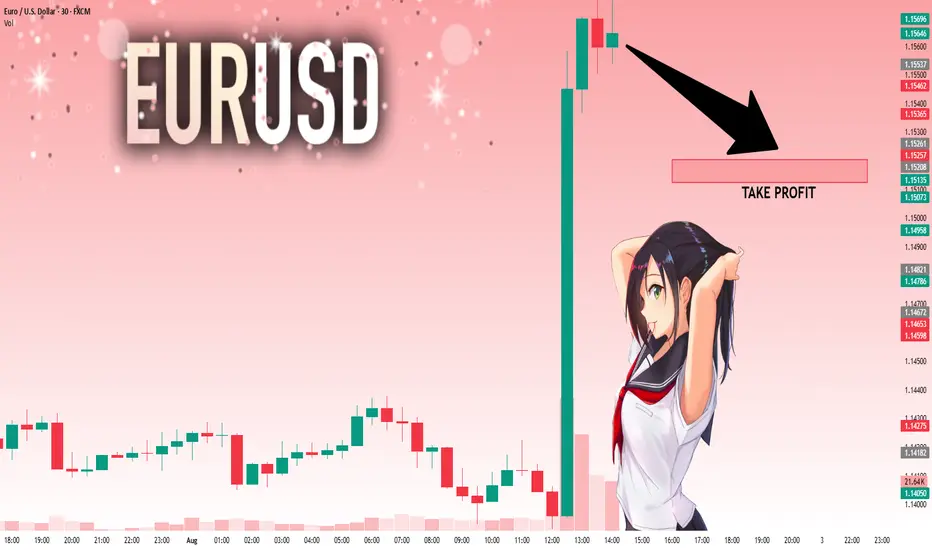
EURUSD: Move Down Expected! Short!
My dear friends,
Today we will analyse EURUSD together☺️
The price is near a wide key level
and the pair is approaching a significant decision level of 1.15337 Therefore, a strong bullish reaction here could determine the next move up.We will watch for a confirmation candle, and then target the next key level of 1.15208.Recommend Stop-loss is beyond the current level.
❤️Sending you lots of Love and Hugs❤️
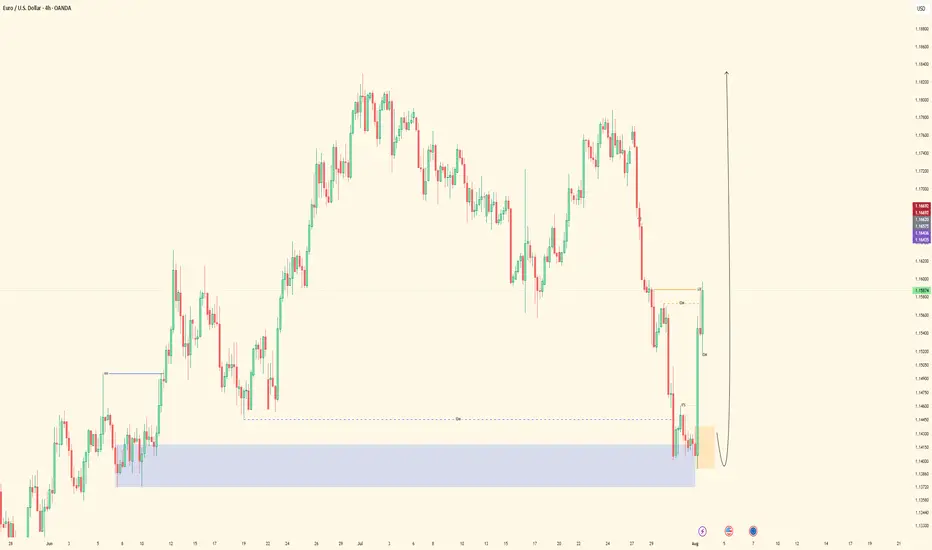
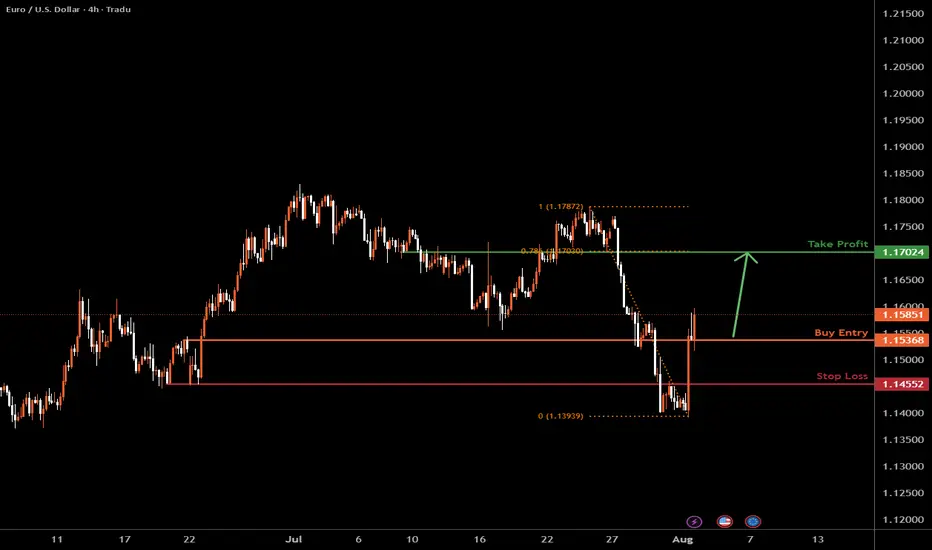
The Fiber H4 | Bullish riseEUR/USD has bounced off the support level, which serves as a pullback support and could potentially rise from this level to our take-profit target.
Buy entry is at 1.1585, which is a pullback support.
Stop loss is at 1.1455, which is a pullback support.
Take profit is at 1.1702, which is a pullback resistance that aligns with the 78.6% Fibonacci retracement.
High Risk Investment Warning
Trading Forex/CFDs on margin carries a high level of risk and may not be suitable for all investors. Leverage can work against you.
Stratos Markets Limited (tradu.com ):
CFDs are complex instruments and come with a high risk of losing money rapidly due to leverage. 65% of retail investor accounts lose money when trading CFDs with this provider. You should consider whether you understand how CFDs work and whether you can afford to take the high risk of losing your money.
Stratos Europe Ltd (tradu.com ):
CFDs are complex instruments and come with a high risk of losing money rapidly due to leverage. 66% of retail investor accounts lose money when trading CFDs with this provider. You should consider whether you understand how CFDs work and whether you can afford to take the high risk of losing your money.
Stratos Global LLC (tradu.com):
Losses can exceed deposits.
Please be advised that the information presented on TradingView is provided to Tradu (‘Company’, ‘we’) by a third-party provider (‘TFA Global Pte Ltd’). Please be reminded that you are solely responsible for the trading decisions on your account. There is a very high degree of risk involved in trading. Any information and/or content is intended entirely for research, educational and informational purposes only and does not constitute investment or consultation advice or investment strategy. The information is not tailored to the investment needs of any specific person and therefore does not involve a consideration of any of the investment objectives, financial situation or needs of any viewer that may receive it. Kindly also note that past performance is not a reliable indicator of future results. Actual results may differ materially from those anticipated in forward-looking or past performance statements. We assume no liability as to the accuracy or completeness of any of the information and/or content provided herein and the Company cannot be held responsible for any omission, mistake nor for any loss or damage including without limitation to any loss of profit which may arise from reliance on any information supplied by TFA Global Pte Ltd.
The speaker(s) is neither an employee, agent nor representative of Tradu and is therefore acting independently. The opinions given are their own, constitute general market commentary, and do not constitute the opinion or advice of Tradu or any form of personal or investment advice. Tradu neither endorses nor guarantees offerings of third-party speakers, nor is Tradu responsible for the content, veracity or opinions of third-party speakers, presenters or participants.
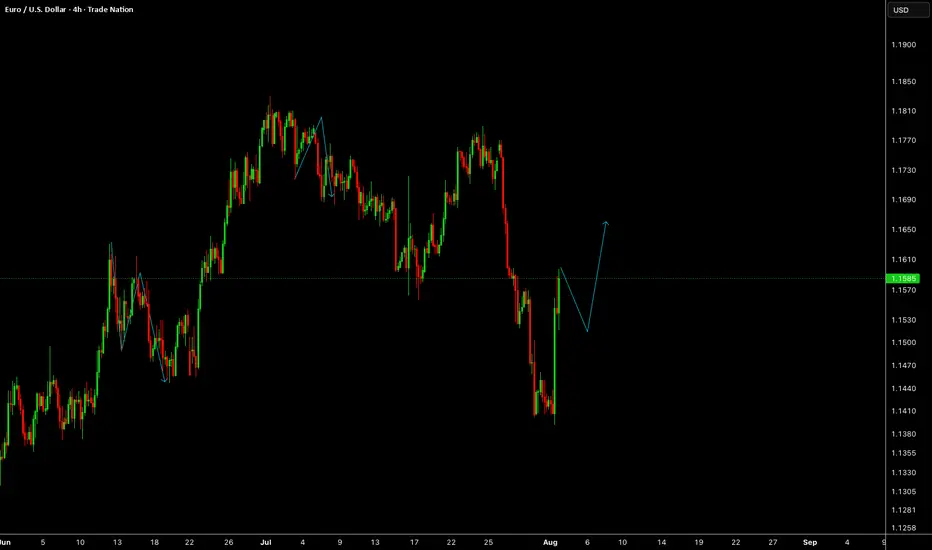
EURUSDEURUSD needs a correction and another push up this week.
Disclosure: We are part of Trade Nation's Influencer program and receive a monthly fee for using their TradingView charts in our analysis.
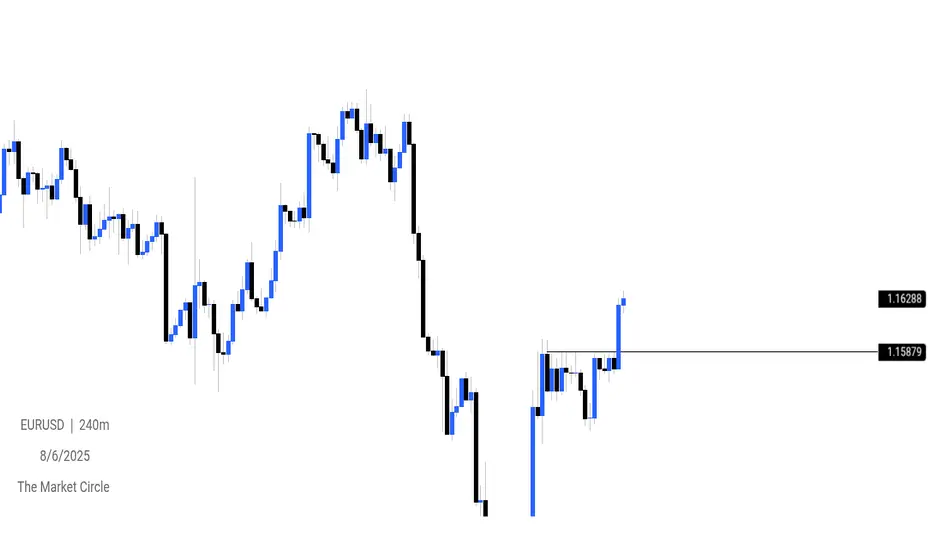
EURUSD OUTLOOKEUR/USD is expected to show bullish sensitivity around the 1.15879 level, indicating a key support area where buyers may step in.
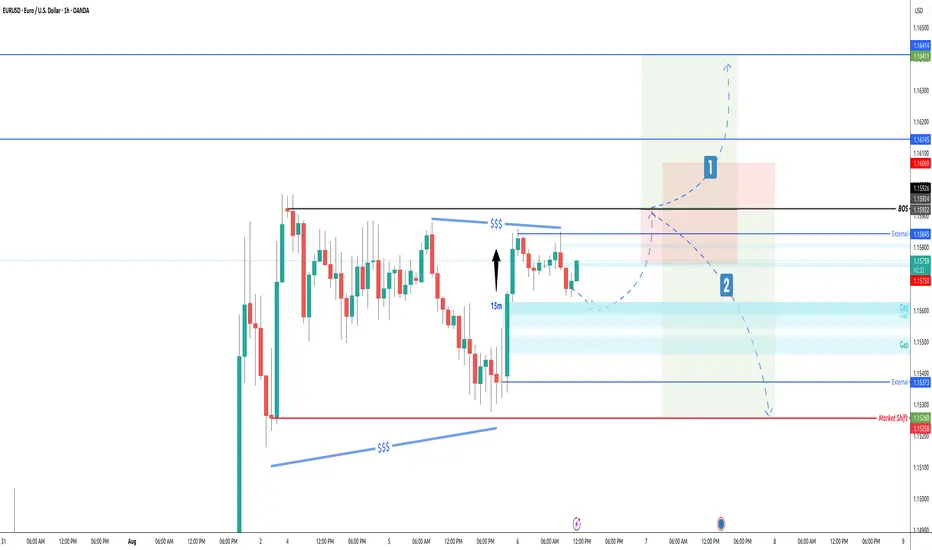
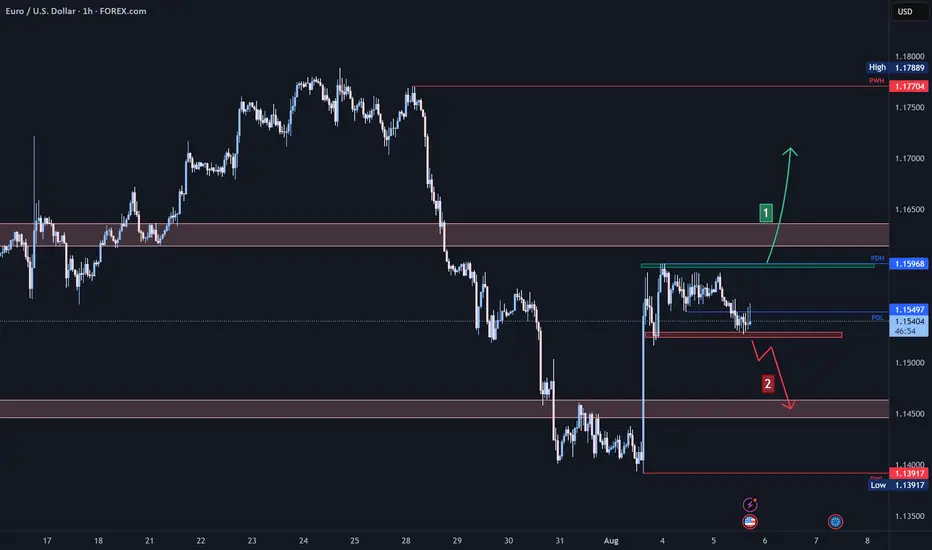
EURUSD 60/15Current state is ranging before a huge green.
Game plan:
1. 15m is showing bullish, if 1h could BOS, then will go long.
2. If cannt BOS then will go for short. Make sure 15m has BOS too.
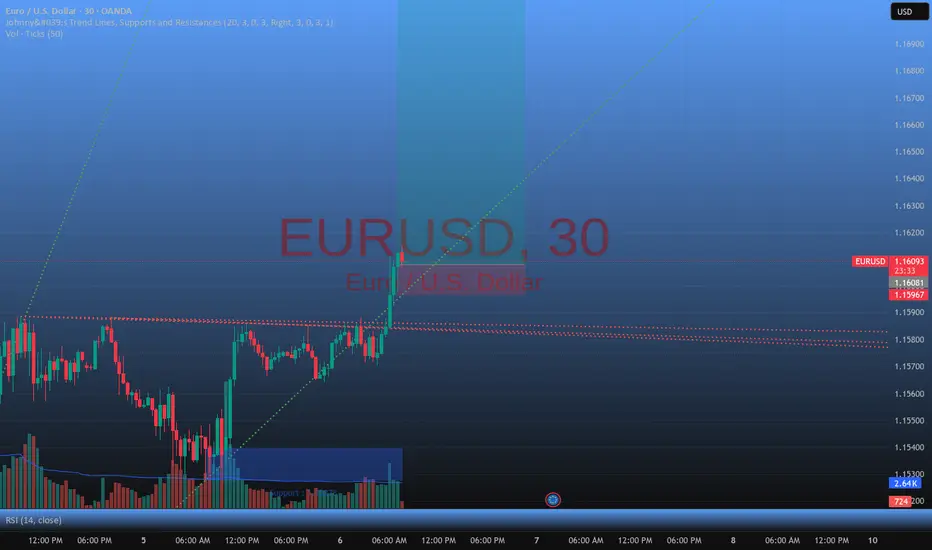
EUR/USDgoing to buy,pull back from the trend line . stop loss below the trend line just in case the price reverse.
EURUSD - approaching the Resistance ClusterFurther for my previous idea on EURUSD - we are getting to the Resistance cluster, which if respected will constitute the Bearish Validation for trend reversal to downtrend.
The level will most likely be reached on the today's session, then I need to see the price crossing down SMA20 (4H) to confirm the reaction.
Just my humble opinion.

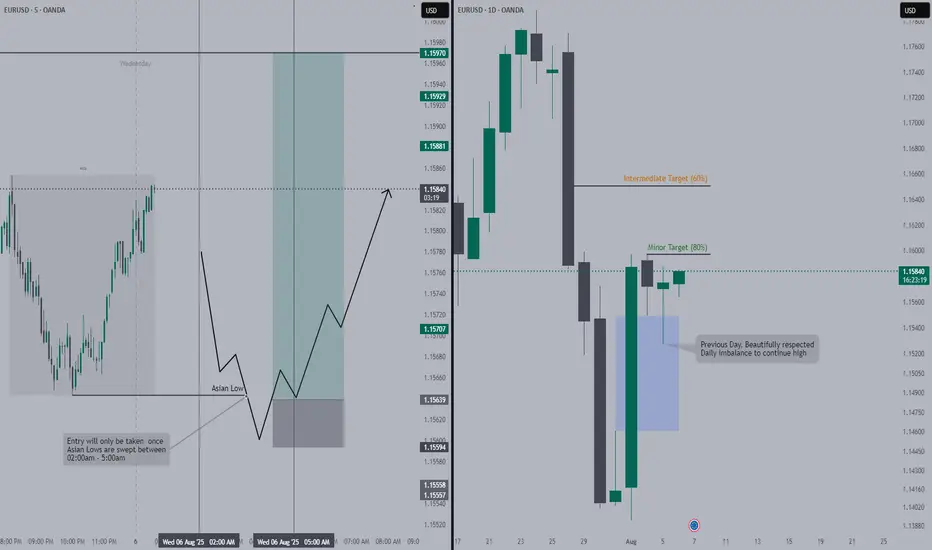
Waiting for EURUSD to Trap Short OrdersAs we can tell on high-time price respected the daily imbalance (bullish).
We want to see false breakout on London open to which we will be looking for longs.
Potential entry criteria has been outlined on the charts.
eurusd sell setupnot financial advice . follow at own risk.
possible 8rr at nearest daily swing low...16rr at target line

EURUSD live intraday trade with break down 6k profit EUR/USD remains offered near 1.1550 after US ISM data
EUR/USD is trading in negative territory on Tuesday, hovering around 1.1550 on the back of a decent comeback in the US Dollar. The data from the US showed that the ISM Services PMI edged lower to 50.1 in July from 50.8 in June, helping the pair limit its losses.

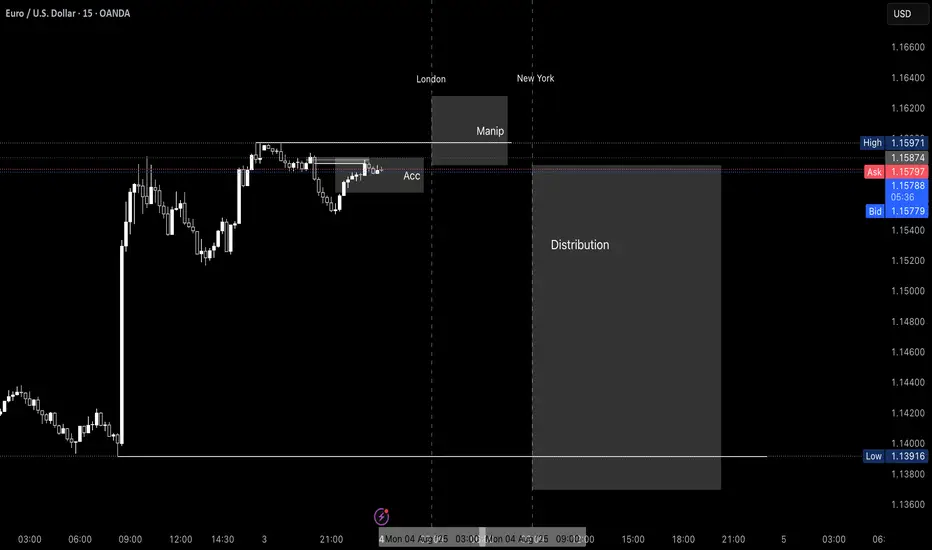
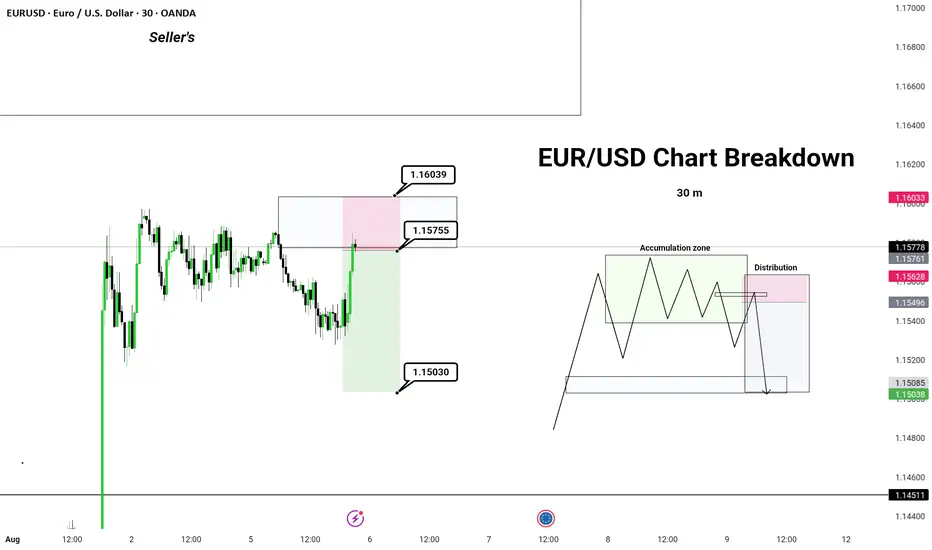
EUR/USD Chart Breakdown – Explained Like You're 5!📉 Big money doesn't move randomly – it follows patterns. In this short, I break down a real EUR/USD trade setup like a pro trader would explain it to a curious kid.
✅ Watch how institutional players trap retail traders
✅ Learn the psychology behind accumulation & distribution
✅ Find out why the market may drop toward 1.15030
✅ Explained in the simplest, most relatable way!
If you're tired of complicated chart talk — this one’s for YOU.
📍EUR/USD Forex Setup | Day 9 | Smart Money Concept | Price Action
🔔 Follow for daily breakdowns and market psychology
EUR/USD Technical Analysis:EUR/USD is currently trading near 1.1540, after failing to break through the 1.1600 resistance, creating a key decision zone.
🔹 Bearish Scenario:
If the price breaks below 1.1530 and holds, it may trigger a drop toward 1.1450, with further downside potential to 1.1400 if bearish momentum continues.
🔹 Bullish Scenario:
If the pair breaks above 1.1600 and holds, a move toward the 1.1650–1.1700 zone becomes likely.
⚠️ Disclaimer:
This analysis is not financial advice. It is recommended to monitor the markets and carefully analyze the data before making any investment decisions.
EURUSD: Strong Bullish Sentiment! Long!
My dear friends,
Today we will analyse EURUSD together☺️
The in-trend continuation seems likely as the current long-term trend appears to be strong, and price is holding above a key level of 1.15455 So a bullish continuation seems plausible, targeting the next high. We should enter on confirmation, and place a stop-loss beyond the recent swing level.
❤️Sending you lots of Love and Hugs❤️
The Day AheadTuesday, August 5 – Market Summary
Key Data Releases:
US:
ISM Services (July) – A key gauge of the services sector's health.
Trade Balance (June) – Provides insight into export/import dynamics and GDP impact.
China:
Services PMI (July) – Measures activity and sentiment in the service sector.
UK:
Official Reserves Changes (July)
New Car Registrations – A proxy for consumer demand.
Europe:
France: Industrial production and budget balance (June)
Italy: Services PMI (July)
Eurozone: Producer Price Index (PPI) (June) – Tracks inflation at the wholesale level.
Canada:
International Merchandise Trade (June)
New Zealand:
Q2 Labour Force Survey – Key for RBNZ policy direction.
Central Banks:
Bank of Japan:
Minutes from June meeting – Market watches for clues on policy normalization.
Earnings Highlights:
A busy day with reports from several major global firms, including:
US: AMD, Caterpillar, Amgen, Pfizer, Arista Networks, Eaton, Marriott, Snap, DuPont, Zoetis, Super Micro Computer
Europe/Asia: BP, Diageo, Deutsche Post, Infineon, Recruit Holdings, Mitsubishi Heavy, Coupang, Apollo, Fidelity National
Auctions:
US: 3-year Treasury Note auction – Market-sensitive given recent shifts in yield expectations.
Conclusion:
Tuesday is dense with global economic data and earnings. The US ISM services index and China’s PMI will be key indicators of service sector resilience amid diverging monetary policies. Meanwhile, corporate results from major names across tech, industrials, and healthcare may drive sector-specific moves. Markets will also parse BoJ minutes for any policy shift signals and monitor bond auctions for rate sentiment.
This communication is for informational purposes only and should not be viewed as any form of recommendation as to a particular course of action or as investment advice. It is not intended as an offer or solicitation for the purchase or sale of any financial instrument or as an official confirmation of any transaction. Opinions, estimates and assumptions expressed herein are made as of the date of this communication and are subject to change without notice. This communication has been prepared based upon information, including market prices, data and other information, believed to be reliable; however, Trade Nation does not warrant its completeness or accuracy. All market prices and market data contained in or attached to this communication are indicative and subject to change without notice.

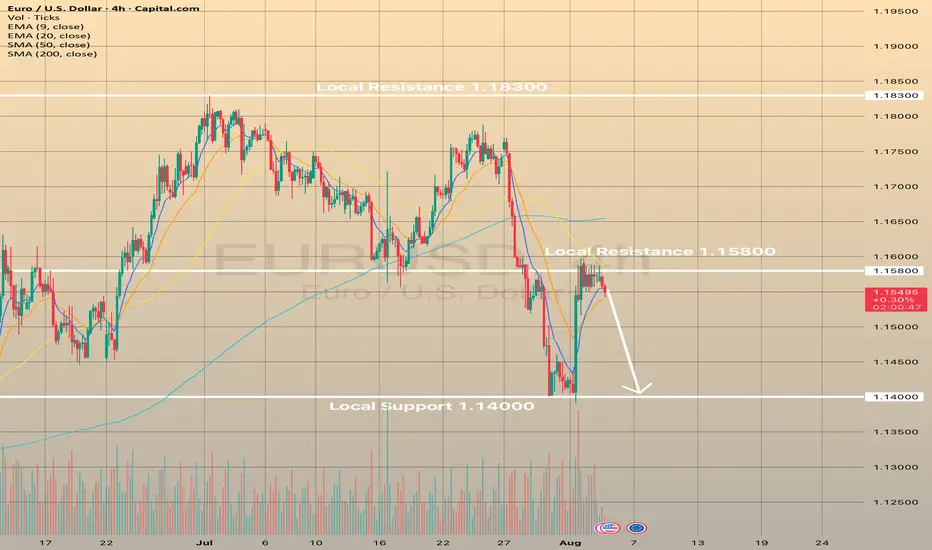
EURUSD fails to develop short-term bullish. Here is whyEURUSD fails to develop short-term bullish. Here is why
On August 1 the market received NFP report data. Numbers were so low that EURUSD has rocketed on 1.22% right immediately after publishing. The probability of a September reduction in interest rates is now estimated at approximately 94%, according to CME Fedwatch, up from 63% last week. Market analysts anticipate at least two quarter-point cuts by the end of the year. The odds increased following the release of disappointing non-farm payrolls data on August 1, which caused a decline in stock markets and led to Trump's reaction, firing the head of the Bureau of Labor Statistics and promising to replace her within a short timeframe.
Still, the pair has failed to develop on August 1 bullish momentum and is currently pulling back from the local resistance of 1.15800. If the price fails to hold the EMA20 on 4-h timeframe, then the decline towards 1.14000 is expected.
EURUSD – DAILY FORECAST Q3 | W32 | D5 | Y25📊 EURUSD – DAILY FORECAST
Q3 | W32 | D5 | Y25
Daily Forecast 🔍📅
Here’s a short diagnosis of the current chart setup 🧠📈
Higher time frame order blocks have been identified — these are our patient points of interest 🎯🧭.
It’s crucial to wait for a confirmed break of structure 🧱✅ before forming a directional bias.
This keeps us disciplined and aligned with what price action is truly telling us.
📈 Risk Management Protocols
🔑 Core principles:
Max 1% risk per trade
Only execute at pre-identified levels
Use alerts, not emotion
Stick to your RR plan — minimum 1:2
🧠 You’re not paid for how many trades you take, you’re paid for how well you manage risk.
🧠 Weekly FRGNT Insight
"Trade what the market gives, not what your ego wants."
Stay mechanical. Stay focused. Let the probabilities work.
FX:EURUSD
CHART UPDATE !!!!!

EURUSD POSSIBLE SELL OPPORTUNITY!Price is reacting at a major o key level of broken support turn resistance. I anticipate a sell off from the current market price with my target profit situated at 1.13962 A sell opportunity is envisaged.

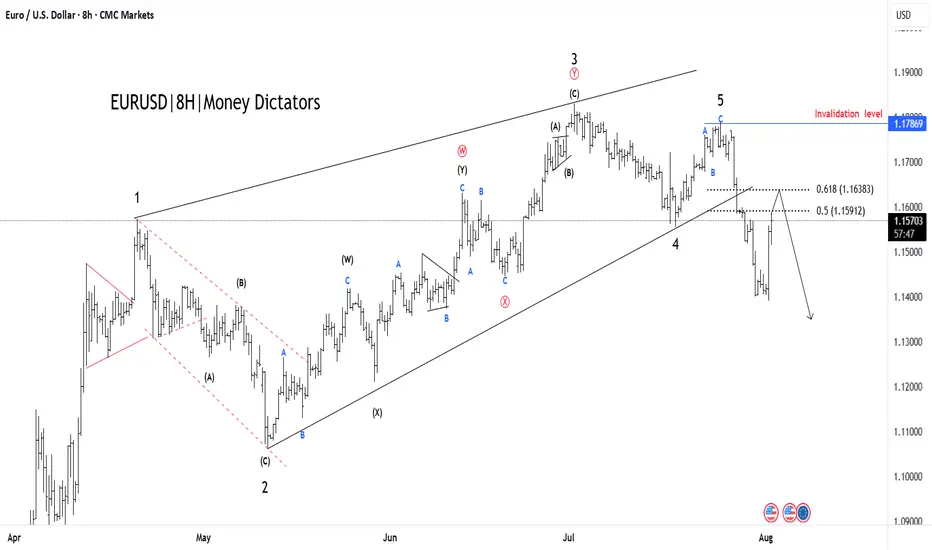
EUR/USD Elliott Wave Count Signals Downside TargetsThe EUR/USD chart is displaying a completed 5-wave Elliott impulse structure, suggesting the potential start of a larger corrective move to the downside. Wave 5 appears to have finished after a classic ending diagonal pattern, with price now breaking below the wave 4 support trendline — a strong confirmation of trend exhaustion.
Currently, price is retracing upward towards the 0.5–0.618 Fibonacci retracement zone of the last impulsive leg, around 1.15912–1.16383, which may serve as the final rejection zone for bears to re-enter. This area aligns perfectly with prior support-turned-resistance and is considered the potential reversal pocket.
If price holds below the 1.17869 invalidation level, the structure supports the beginning of an ABC correction or a larger bearish impulse.
Target 1 (T1): 1.14800
Target 2 (T2): 1.13915
Stop Loss (SL): 1.17869
This scenario remains valid as long as the price does not break above 1.17869. A clean break and close above this level would invalidate the bearish setup and suggest a possible wave extension.
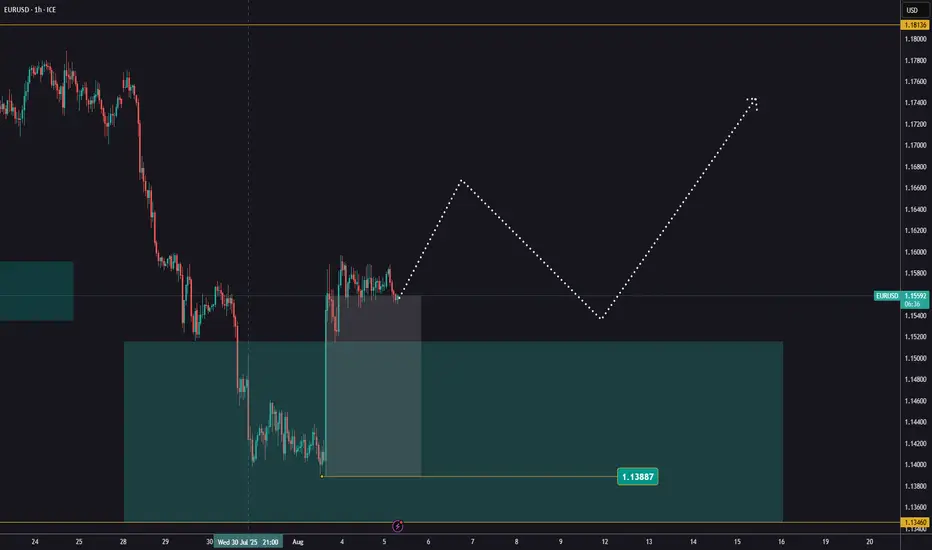
EURUSD awaiting its next moveEURUSD is still trading around the same levels as yesterday.
If you're looking for a trade opportunity, watch for a higher low forming above 1,1388.
This could happen after a pullback from the current levels, or from slightly higher if the price continues to push upward.
Use the Fibonacci tool during the correction to help identify potential entry points.
At the moment, the major currency pairs are offering the best trading setups.