EurUsd Scenario.This how i see eurusd for now .. Indeed Dxy is going Uppp !! While E/U is heading down .
I will see how it goes .
Hapii Trade'ing
EURUSD trade ideas
Eurusd Short-term bearish EUR/USD is showing bearish momentum, breaking below key support with lower highs forming. Selling pressure is increasing amid a stronger USD outlook, favoring a short position.
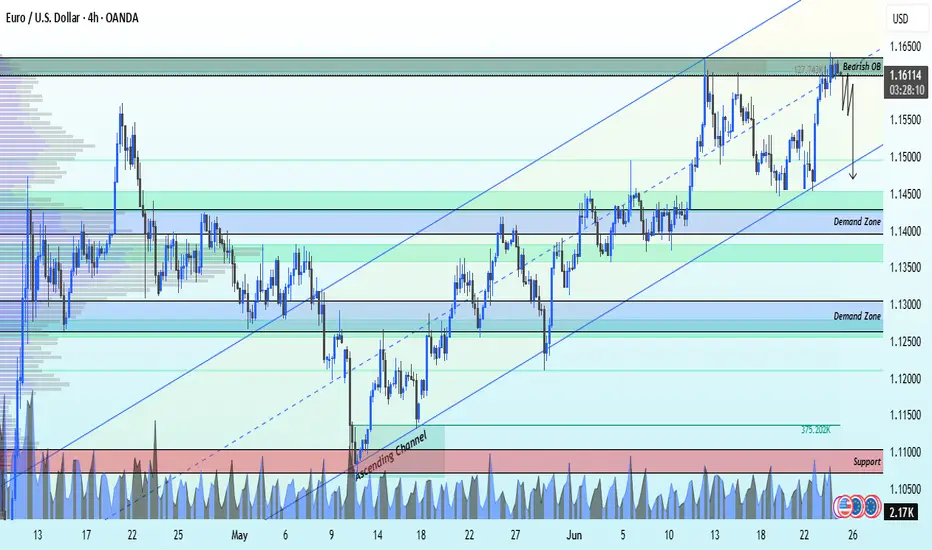
EURUSD Selling From bearish ob at 1.16100 strong sell📉 EURUSD Analysis – 4H Timeframe 📉
The pair is currently respecting an ascending channel, but we’re eyeing a potential reversal from the bearish Order Block (OB) around 1.16100 – a prime sell zone.
🎯 Technical Targets:
1st Target: 1.14500 – Demand Zone
2nd Target: 1.13000 – Demand Zone
3rd Target: 1.11000 – Key Support Level
This setup offers clean risk-reward with price action confirming supply pressure at the top.
🚨 Watch for confirmations before entering – smart entries win the game.
💬 Like, follow, comment your thoughts, and join the team for more real-time updates and insights!
With love,
Livia 😜💹
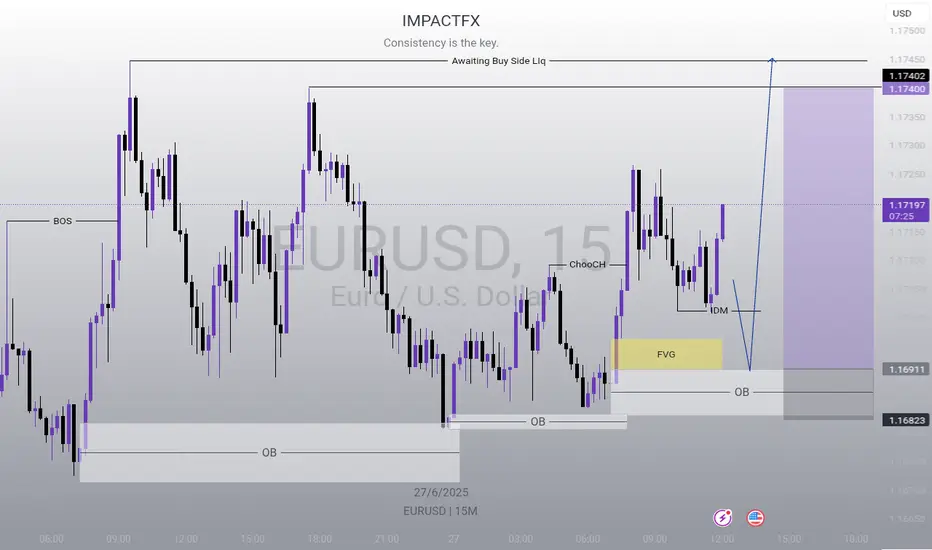
EURUSD Buy SetupI'm expecting a buy from that zone, all other zones are mitigated except from that zone marked on my chart to move price to the buy side LIq.
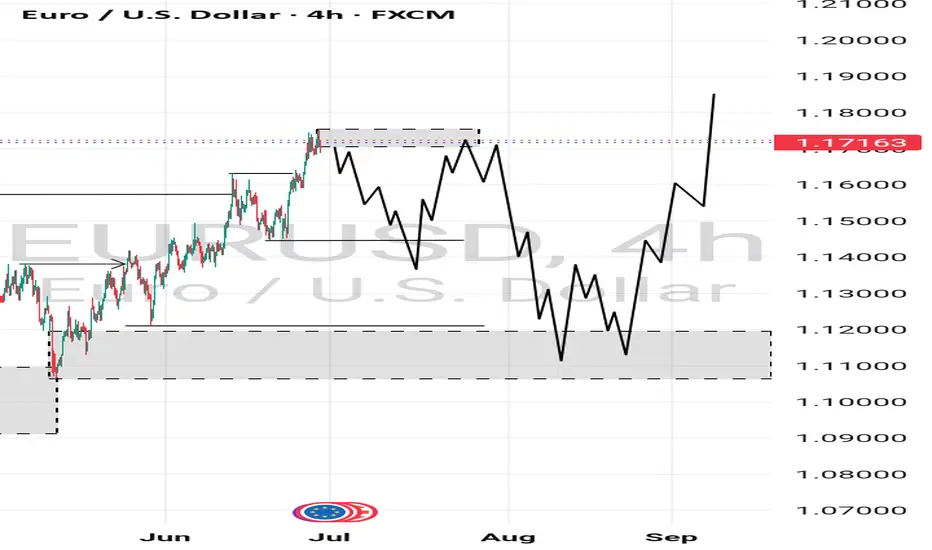
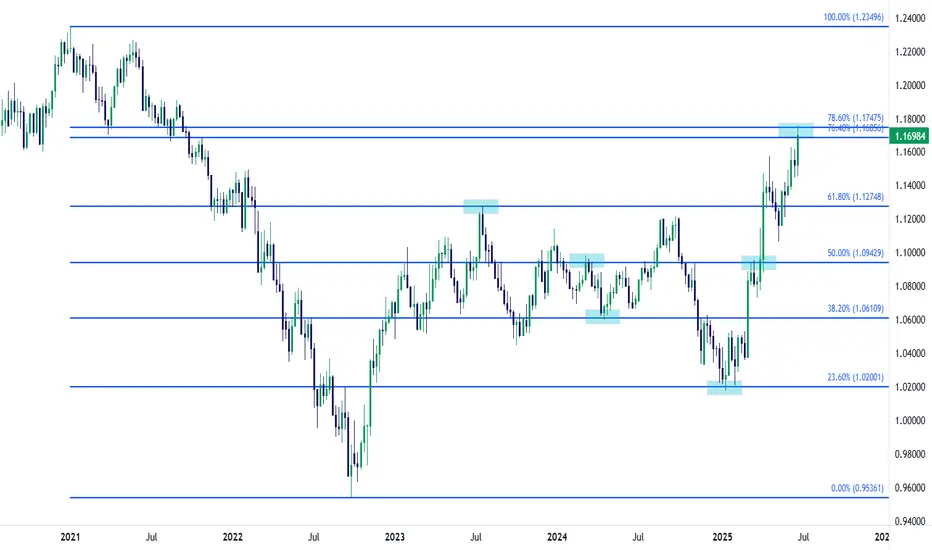
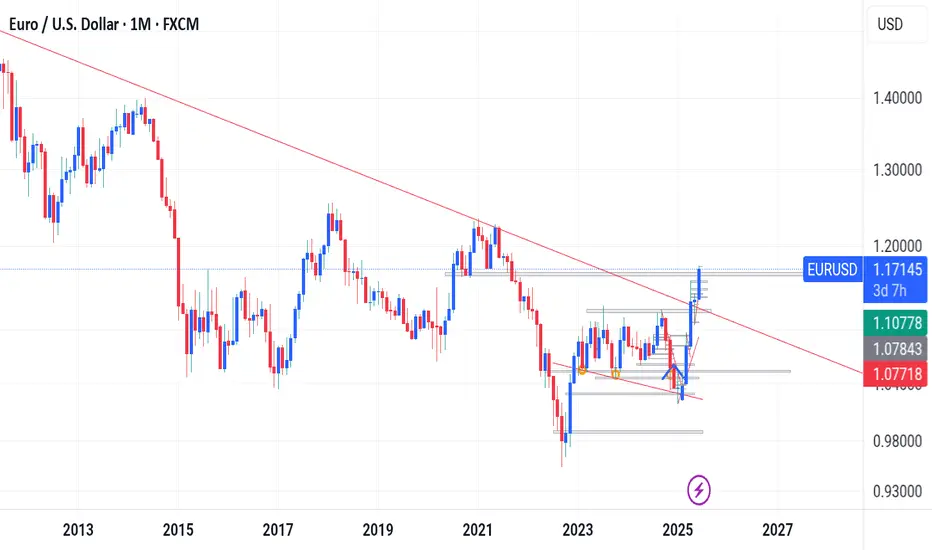
EUR/USD Key Fibonacci Resistance into Q3 OpenIt's been a strong first-half of the year for EUR/USD.
As we came into 2025 it seemed a story of doom and gloom for the Euro, and calls for parity were practically everywhere. But the pair found support in January, held that support in February - and then broke out in a big way in March.
As we wind down Q2 that breakout remains in-play and EUR/USD is pushing fresh three-year highs as the USD sets its own fresh three-year lows.
Of interest is a simple Fibonacci retracement drawn from the 2021-2022 major move in the pair.
The 61.8% retracement is what caught the highs in 2023, and the 38.2% marker is what caught the low in April of last year, which held until that late-year breakdown. Along the way, the 50% mark at 1.0943 came into play as support and resistance multiple times.
And as the breakdown took hold through the 2025 open, it was the 23.6% retracement that showed up to catch the lows, right around the 1.0200 handle. As prices has posed a strong recovery over the past four months and change, the levels as taken from that Fibonacci retracement have exhibited a number of inflection points.
And now we have the 78.6% retracement coming into play to mark this week's highs. Notably - the pair is currently overbought on both the daily and weekly charts. And while it's difficult to justify strength in a USD that's been beaten down over the past four months, if looking for a turn - whether it's a simple pullback or perhaps the start of something larger, this resistance in EUR/USD remains a big spot to follow on the chart.
Quarterly cuts can be interesting junctures to investigate for turn potential, especially considering the bearish reversal in EUR/USD around the Q4 open last year. - js
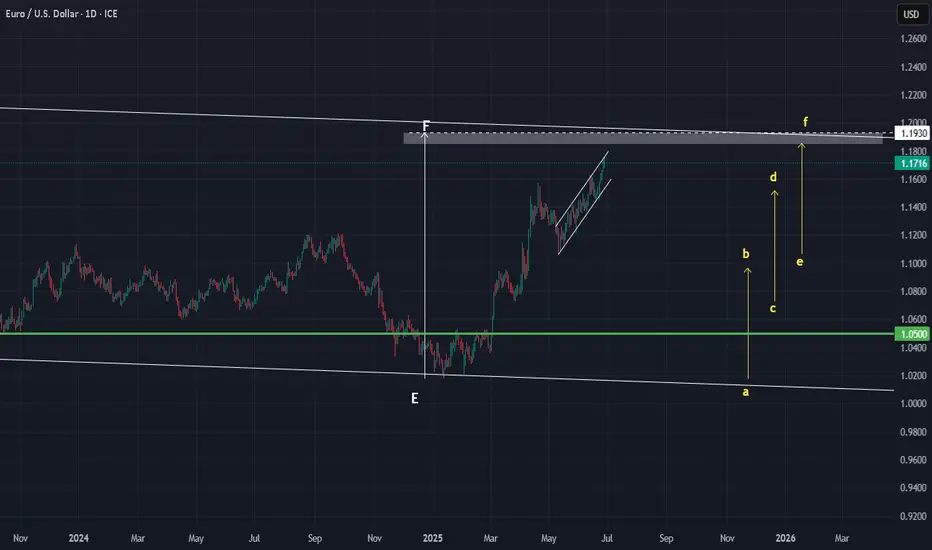
ERUSUD: BookMost of us read books on FX trading, hopefully, we can pick up something new, something useful. All the books I had read to date are not useful. I think common sense tells me to forget about them.
But lucky me, I think one book stands out. Written by a nobody. But the method is quite original. His name is Gabriele Fabris. I bet none of you have heard of him or his method.
If I had applied his method to trading EURUSD, the win rate would not be favourable, but his core argument is to make use of time when it matters the most. This provides the basis to understand price movement better. With a bit of research and refinement, it is indeed very useful. Much better than the usual ABCD.
ABCD tells us WHERE and WHEN. It does not tell us the WHY. Which is why when the price reaches the 'D', we can only hope it bounces instead of pushing through.
WHY is the key - I think knowing the intention of the MARKET is crucial - better to let the market reveal itself, then trade along with it. I think the back testing looks good.
Let's see if this method can correctly 'predict' the WHEN, WHERE, and WHY price will pivot this time. It is a long way down.
Good luck.
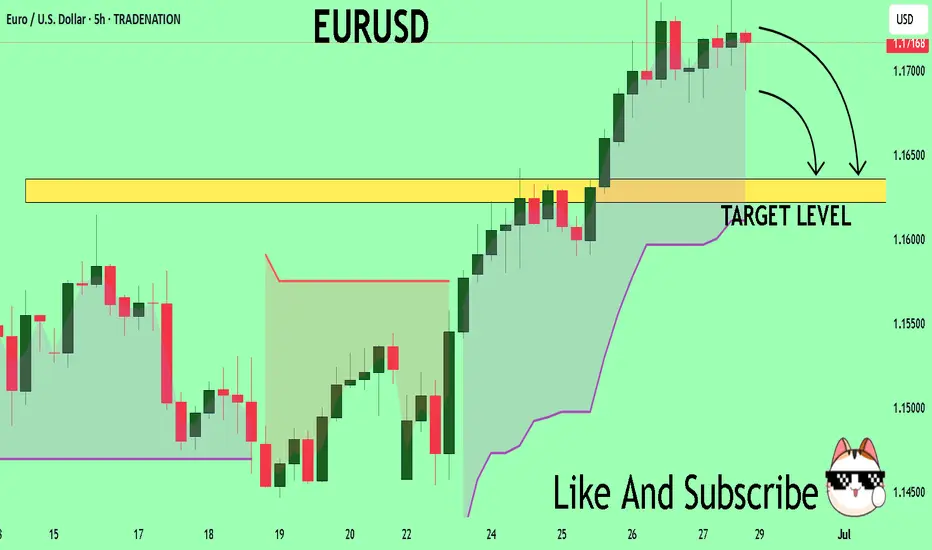
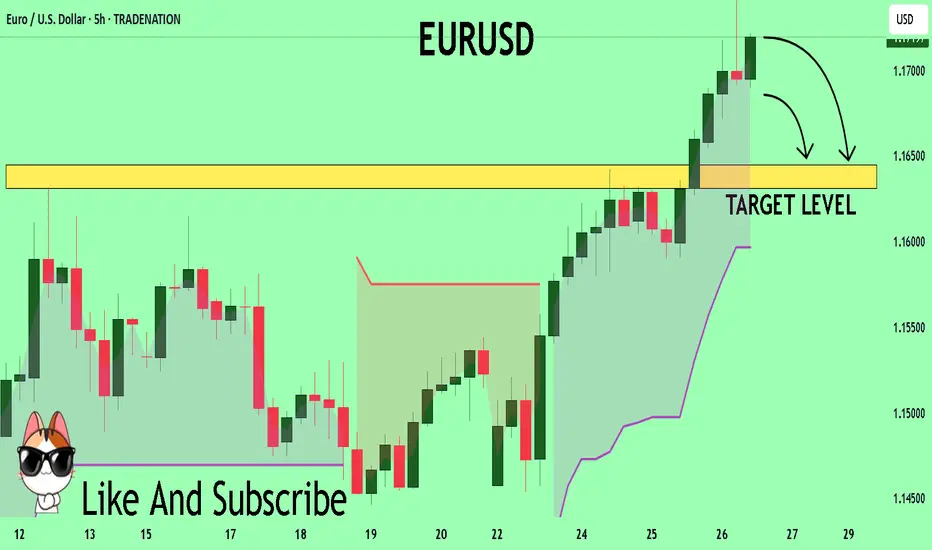
EURUSD What Next? SELL!
My dear friends,
My technical analysis for EURUSD is below:
The market is trading on 1.1716 pivot level.
Bias - Bearish
Technical Indicators: Both Super Trend & Pivot HL indicate a highly probable Bearish continuation.
Target - 1.1635
About Used Indicators:
A pivot point is a technical analysis indicator, or calculations, used to determine the overall trend of the market over different time frames.
Disclosure: I am part of Trade Nation's Influencer program and receive a monthly fee for using their TradingView charts in my analysis.
———————————
WISH YOU ALL LUCK
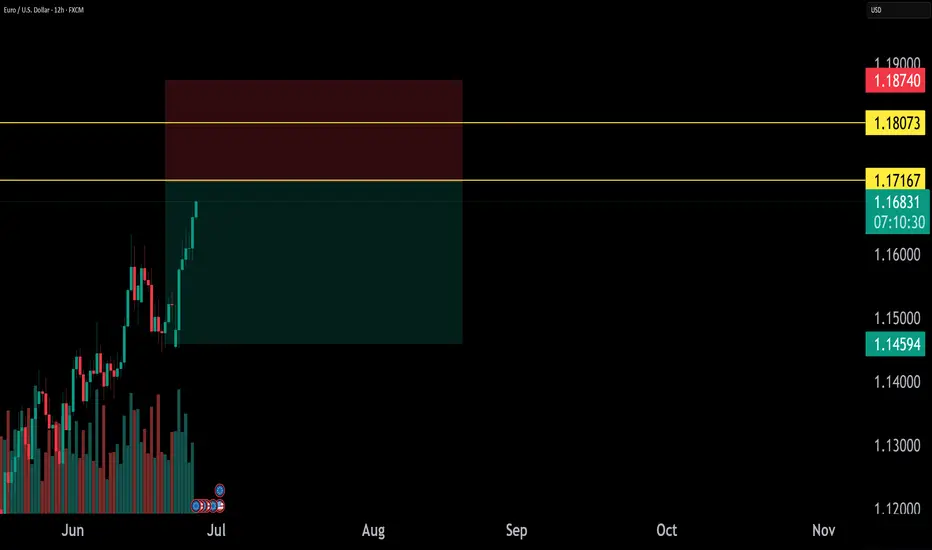
EUR/USD Short Idea Analysis EUR/USD exhibits bearish potential on the daily timeframe, with the 1.17160–1.18070 zone acting as a key resistance area for a short setup.
Technical Analysis:
Price Action: Price is testing the 1.17160–1.18070 resistance zone, which aligns with prior highs and a rejection area. A bearish reversal pattern (e.g., shooting star or engulfing) could confirm the short.
Support/Target: Initial support at 1.1600, with a deeper target at 1.1500 if selling pressure accelerates.
Indicators: RSI is nearing overbought levels (above 65), suggesting a potential reversal. MACD shows weakening bullish momentum, supporting a bearish bias.
Fibonacci: The 1.17160–1.18070 zone aligns with the 78.6% Fibonacci retracement of the prior downmove, reinforcing resistance.
Risks: A break above 1.1820 could invalidate the setup. Watch for ECB policy updates or unexpected US data shifts.
Conclusion: The 1.17160–1.18070 resistance zone offers a compelling short opportunity for EUR/USD, backed by technical and fundamental factors. Use tight risk management due to potential volatility.
Eurusd M_Tf analysis Eurusd - MTF Analysis
Test of support : @ 1.16642, a slight breakout occurred, which could be interpreted as a stop-loss hunt. Additionally, there was a trendline breakout.
Expectation : A potential pullback to around 1.11873, which is a resistance level that coincides with a double top pattern. This could also serve as a retest of the previously broken trendline.
Continuation : After the pullback and retest, the uptrend could potentially resume, with a target of approximately 1.218628.
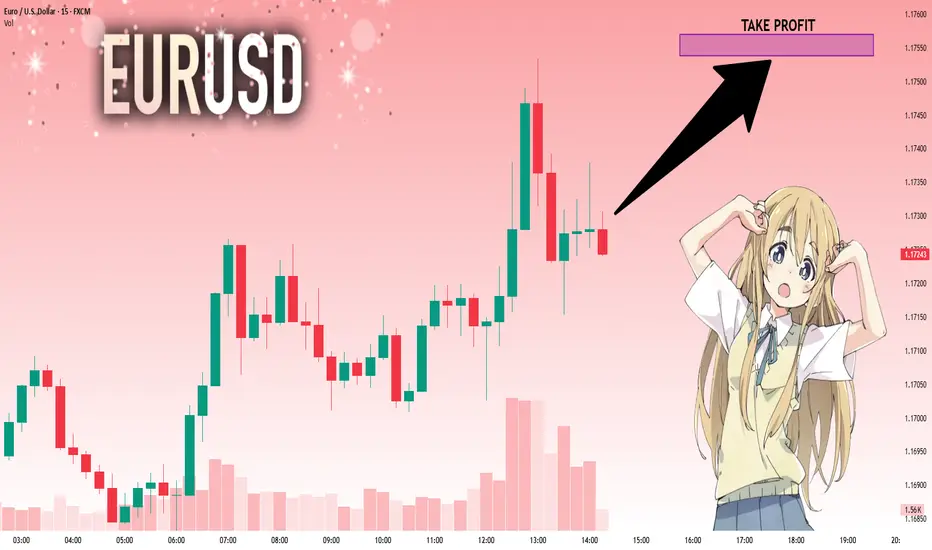
EURUSD: Strong Growth Ahead! Long!
My dear friends,
Today we will analyse EURUSD together☺️
The recent price action suggests a shift in mid-term momentum. A break above the current local range around 1.17284 will confirm the new direction upwards with the target being the next key level of 1.17538 and a reconvened placement of a stop-loss beyond the range.
❤️Sending you lots of Love and Hugs❤️
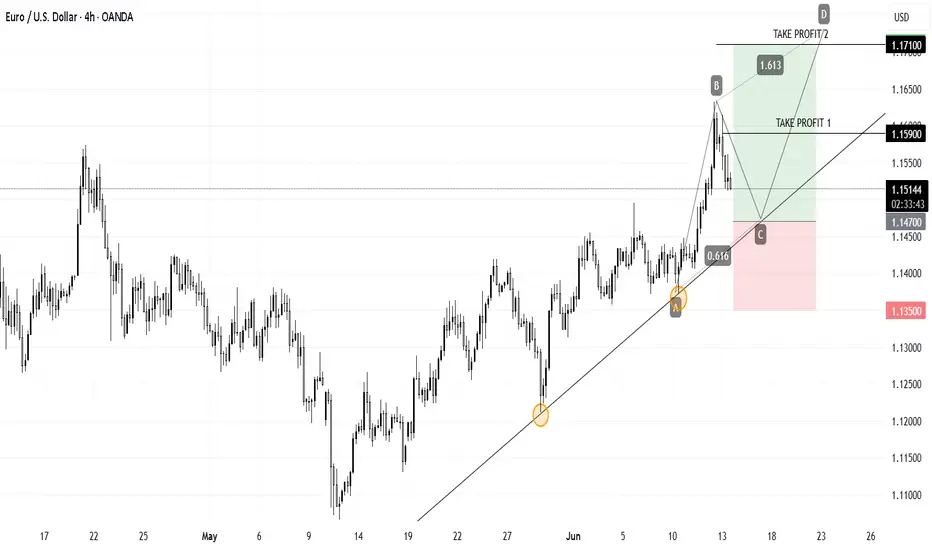
EUR/USD Bullish Setup: Long from Fib & Trendline SupportEUR/USD is in a bullish continuation. We’re now looking for a long entry between the 0.618 Fibonacci level and trendline support, with the stop-loss placed below recent lows. Targeting current highs and potential new highs.
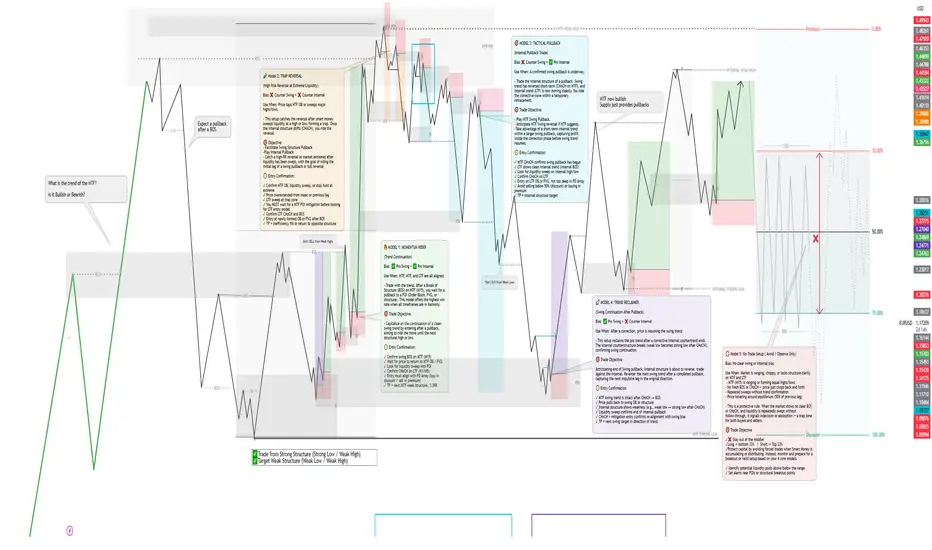
SMC Entry Models Cheatsheet✅ Smart Money Concepts & Liquidity Checklist
1. Market Structure
🔹 Identify HTF Trend (H4 or H1): bullish, bearish, or range
🔹 Confirm Break of Structure (BOS) or Change of Character (CHoCH) on M15–M5
🔹 Look for lower highs/lows (downtrend) or higher highs/lows (uptrend)
2. Liquidity Zones
🔹 Look for equal highs/lows (liquidity pools)
🔹 Asian highs/lows — common targets during London/NY session
🔹 Recent internal range liquidity
🔹 Trendline liquidity — fakeouts often occur here
3. Premium & Discount Zones (PD Arrays)
🔹 Use Fibonacci from recent swing high to low
🔹 Look for entries at Discount (Longs) or Premium (Shorts) pricing
🔹 Ideal entries happen between 0.62–0.79 retracement
4. Supply & Demand Zones
🔹 Find fresh OBs (Order Blocks) that caused a break of structure
🔹 Use last bullish candle before strong drop (for short) or last bearish candle before strong rally (for long)
🔹 Confirm zone isn’t mitigated yet
5. Imbalance / Fair Value Gaps (FVG)
🔹 Identify large imbalanced candles (no wick overlap)
🔹 Ideal entries are inside the FVG aligned with direction
🔹 High probability if FVG is within OB or confluence with structure/liquidity
6. Confluences for Entry
🔹 Entry aligns with liquidity sweep or FVG/OB tap
🔹 Volume spike or rejection wick confirms interest
🔹 RSI divergence or exhaustion = bonus confirmation
🔹 Use M1/M5 for entry trigger after setup is formed on M15–H1
7. Entry Trigger
🔹 CHoCH or BOS on lower timeframe (M1-M5)
🔹 Confirmation with engulfing candle, FVG fill, or break/retest
🔹 SL below/above recent swing or OB boundary
8. TP/Exit Zones
🔹 TP1: After BOS/structure shift + partial
🔹 TP2: Next liquidity level (equal high/low or OB)
🔹 TP3: Opposite OB or major FVG
🔹 Adjust SL to breakeven after reaching TP1
9. Session Timing (Important)
🔹 Asian range → look for liquidity setup
🔹 London Open (3PM–6PM PH))→ manipulative move (liquidity grab)
🔹 NY Open (8PM–11PM PH) → continuation or reversal opportunity
🔹 Avoid high-impact news releases unless breakout
🔹 Use Forex Factory / MyFXBook for news calendar
10. Post-Trade Journaling:
🔹Screenshot HTF → LTF Setup (H4 > M15 > M1)
🔹Don’t skip journaling — it’s your #1 improvement tool.
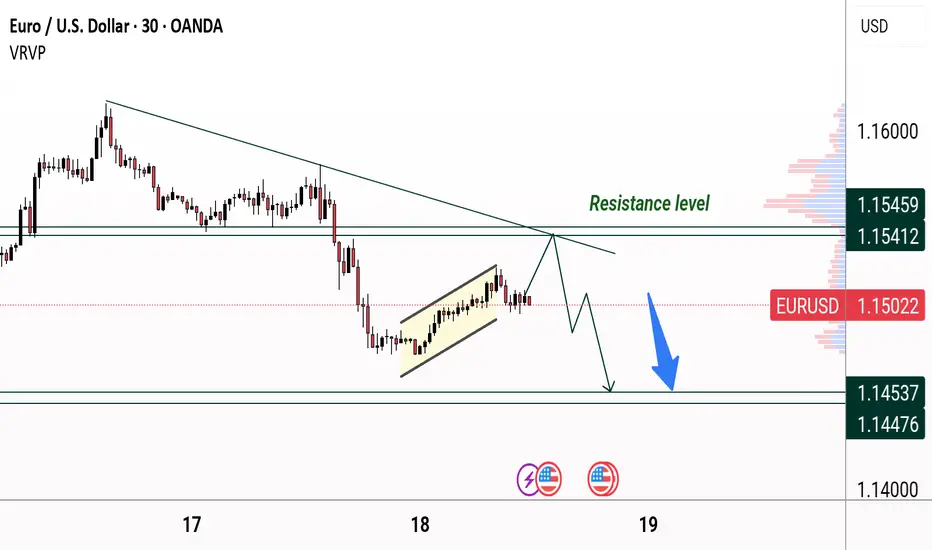
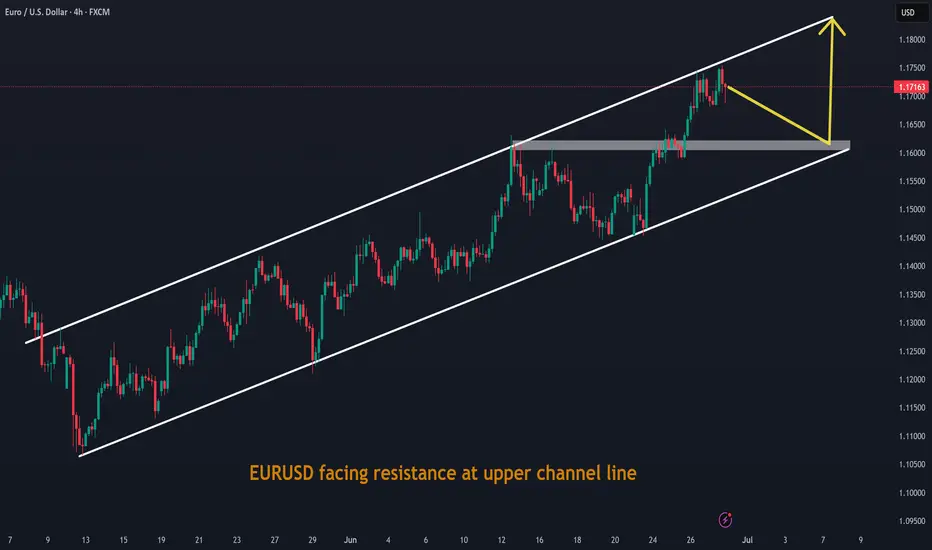
EURUSD facing resistance at upper channel lineEURUSD facing resistance at upper channel line. It may retrace from here before upward momentum continues.
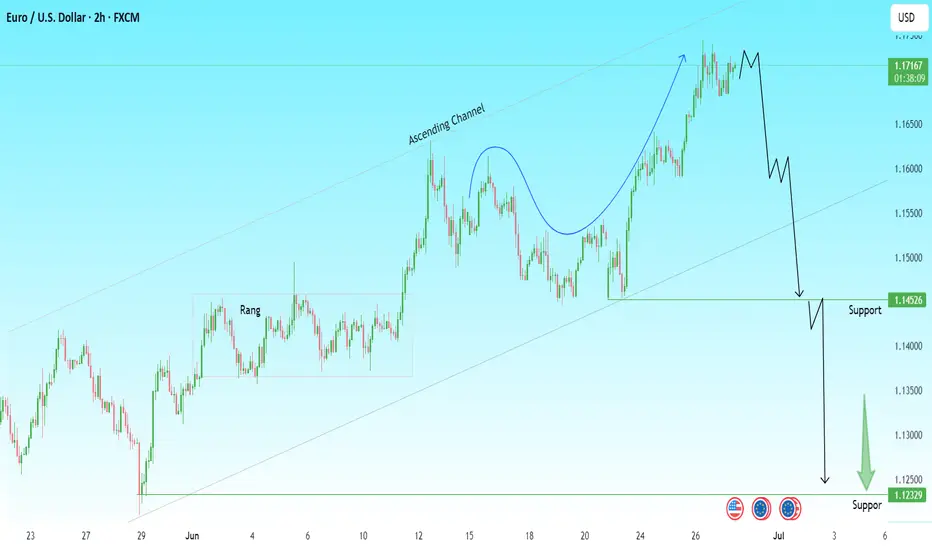
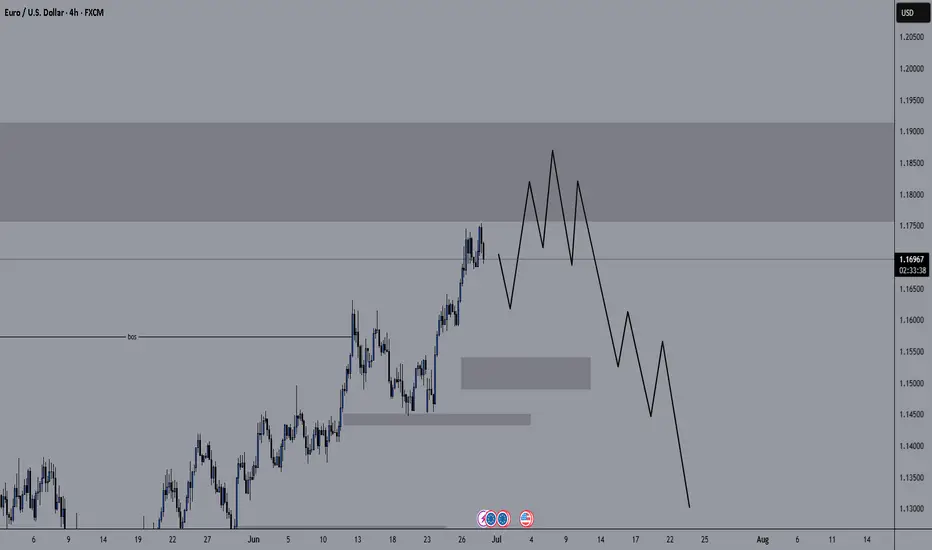
EURUSD Technical Breakdown | Bearish Reversal Ahead?The Euro is showing signs of a potential major trend reversal after completing a strong rally within an ascending channel.
🔎 Chart Analysis:
Price surged out of a long consolidation range and followed a parabolic curve.
The pair reached the upper boundary of the ascending channel and started stalling.
Early signs of a distribution phase are visible, hinting at possible downside momentum.
📉 Bearish Scenario In Play:
A break below 1.1600 could accelerate the sell-off.
Key support zone at 1.14526 — potential first reaction level.
If momentum continues, next major support rests at 1.12329.
Short-Term Outlook:
Watch for breakdown confirmation below the channel.
Risk management is key; consider short entries on bearish candle confirmation.
💬 What’s your view? Are the bears finally taking over EUR/USD? Drop your thoughts below! 👇
#EURUSD #Forex #TechnicalAnalysis #PriceAction
EURUSD short to 1.56Currently testing 1M resistance area and 1D downtrend line.
Expecting retracement to 1D up trendline.
DXY is also testing 1W uptrend line
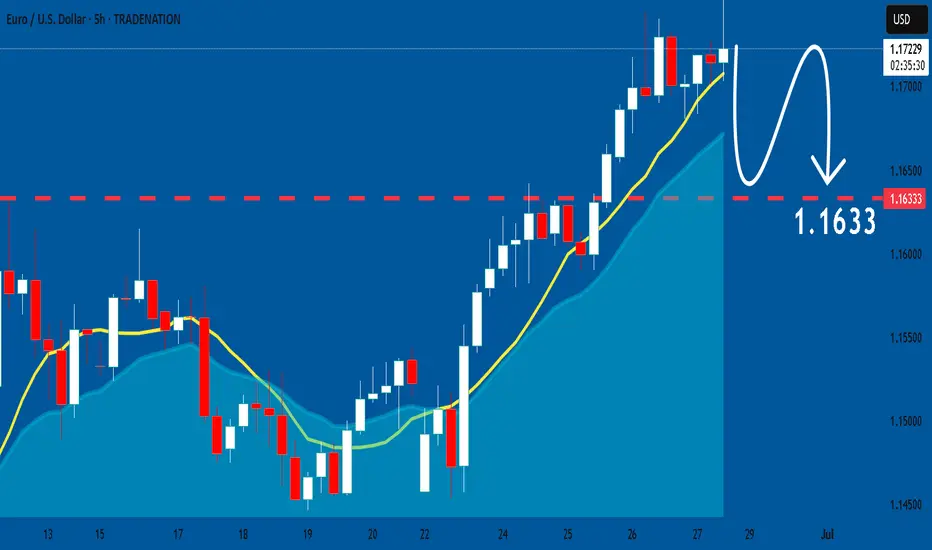
EURUSD Will Collapse! SELL!
My dear subscribers,
My technical analysis for EURUSD is below:
The price is coiling around a solid key level - 1.1716
Bias - Bearish
Technical Indicators: Pivot Points Low anticipates a potential price reversal.
Super trend shows a clear sell, giving a perfect indicators' convergence.
Goal - 1.1644
About Used Indicators:
By the very nature of the supertrend indicator, it offers firm support and resistance levels for traders to enter and exit trades. Additionally, it also provides signals for setting stop losses
Disclosure: I am part of Trade Nation's Influencer program and receive a monthly fee for using their TradingView charts in my analysis.
———————————
WISH YOU ALL LUCK
Should we wait for a drop?Hello friends...
In the currency pair (EUR to USD), the price has experienced good growth.
As you can see, this growth has been sharp and there has been no significant correction to continue the trend. Perhaps we can expect the price to start correcting itself from the range specified in the image.
But due to the trend change, the price has to correct and continue its upward trend again (the trend is still upward in the upper time frame).
So in the coming weeks, you should expect a decline in the lower time frame.
.
I hope you have used our team's analysis well.
You can follow our page to see more analysis.
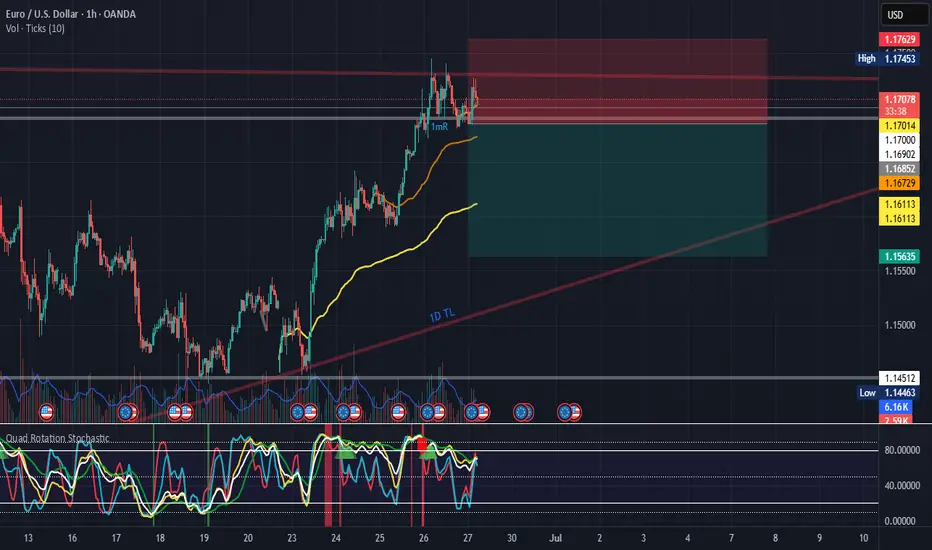
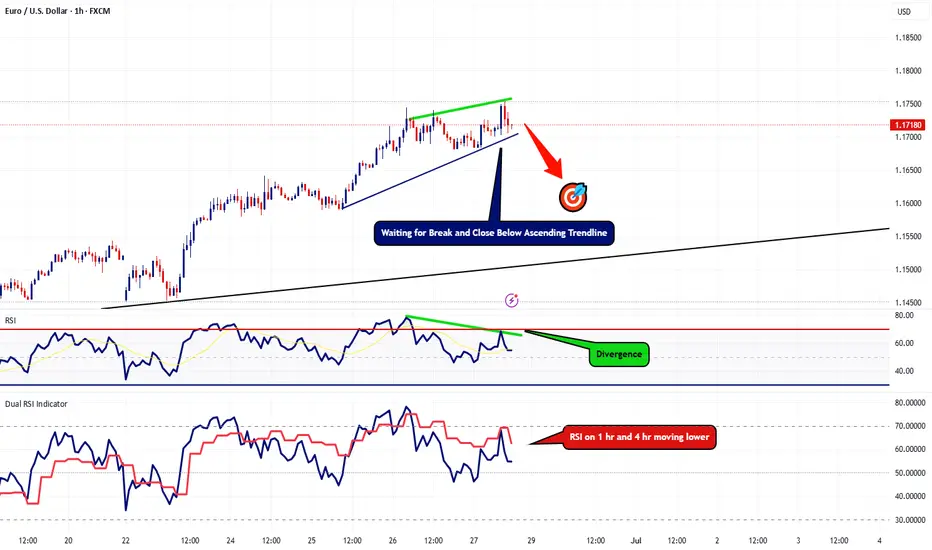
EURUSD Lots of Bearish Clues Popping UpThis is an update to my last post, I'm still waiting for that 4hr candle to close below the last. However, now I'm starting to spot more bearish indications on the 1hr timeframe.
First thing I'm noticing is the RSI divergence show that the bullish strength is weakening. RSI on the 4hr + the 1hr are heading lower. Now I'm still waiting for that 4 hour to close below the last but I also want to see this ascending trendline break and hold below as well.
In the event we break below this trendline, I'll be looking to go short with my target plotted on the chart.
EURUSD: Will Keep Falling! Here is Why:
Balance of buyers and sellers on the EURUSD pair, that is best felt when all the timeframes are analyzed properly is shifting in favor of the sellers, therefore is it only natural that we go short on the pair.
Disclosure: I am part of Trade Nation's Influencer program and receive a monthly fee for using their TradingView charts in my analysis.
❤️ Please, support our work with like & comment! ❤️
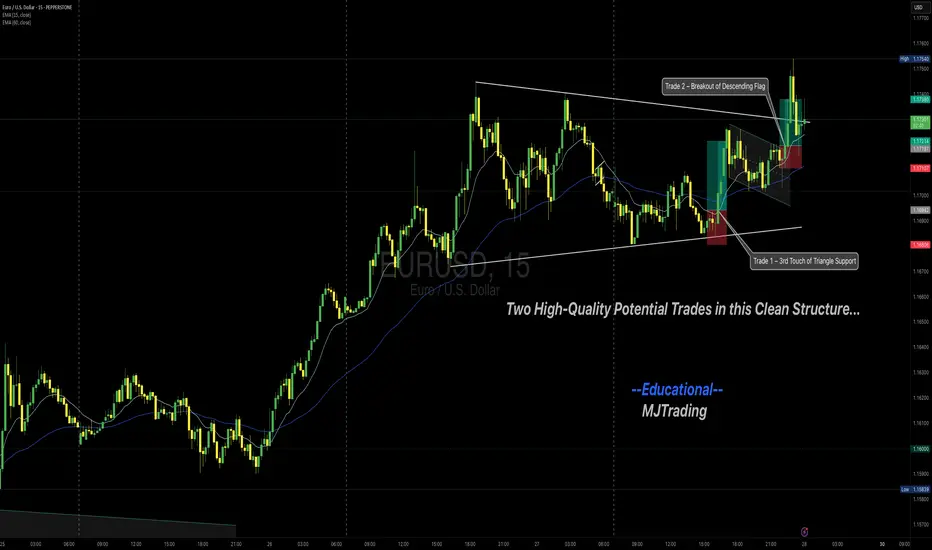
EURUSD – 2 Potential Intraday Setups (5-Min Chart)Chart Overview:
This 5-min EURUSD chart shows two example trade setups aligned with the main uptrend. These are shared purely for learning how to recognize and plan structured entries.
(Details are being shown in m5 chart- if this in not working for you please follow to be able to see it- as it is a private idea)
🔹 Example Trade 1 – 3rd Touch of Triangle Support
✅ Context:
Price retested the lower boundary of a broad triangle/wedge for the third time—often a strong area for reactive buys in an uptrend.
✅ Plan Concept:
Entry: Reversal signal on the 3rd touch.
Stop: Below the signal bar low.
Target: Mid to upper wedge area (or TP2).
🔹 Example Trade 2 – Breakout of Descending Flag
✅ Context:
After bouncing off trendline support, price formed a descending flag consolidation.
✅ Plan Concept:
Entry: Break and close above flag resistance.
Stop: Below the strong breakout candle.
Target: Extension toward recent highs (or TP2).
💡 Important:
These examples are not signals and not executed trades—they illustrate a possible planning process for traders studying price action strategies.
💡 Why These Matter:
Both setups align with the primary uptrend, use clear structure for risk placement, and rely on confirmation before entry.
🔹 Note:
These are educational examples only, not trade signals.
💬 Do you study similar setups? Share your charts and thoughts!
Thanks for your attention and your time...
Follow for more setups
#EURUSD #Forex #TradingEducation #PriceAction #IntradayTrading #BreakoutTrading #TechnicalAnalysis #LearnTrading #TradingView
#AN011: NATO Summit, 5% for Defense
Hello, I am Forex Trader Andrea Russo and after the NATO Summit meeting, I want to analyze the situation a bit. Remember that my opinions are strictly personal and what I say may not reflect your thoughts. I do not write with a political or personal ideology. I analyze the situation objectively.
I thank in advance our Official Partner Broker PEPPERSTONE for the support in creating this article.
🔍 Key points of the NATO Summit
Yesterday's NATO Summit in The Hague attracted global attention, with the 32 member countries committing to a strong increase in defense spending, with the goal of 5% of GDP by 2035, of which 3.5% for basic military spending and 1.5% for broader security measures, such as strengthening cybersecurity and infrastructure.
US President Trump praised the outcome as a "major victory" and stressed that increased spending would likely benefit US defense contractors, while reaffirming NATO's commitment to Article 5.
However, countries such as Spain have expressed concern, indicating that it could include military aid rather than pure budget increases.
📈 Financial Market Reaction
🔹 Defense & Aerospace Stocks
Major defense companies across Europe posted immediate gains:
Babcock (UK) +10.7%,
Rheinmetall (Germany) +3.1%,
Thales (France) +2%+,
Leonardo (Italy) +2.6%
🔹 Bond & Currency Action
According to KBC Bank market commentary:
The bond market steepened bearishly, particularly in Europe, as governments are reassessing their fiscal balances to accommodate defense budgets.
The US dollar remained strong, supported by dovish Fed expectations, countering the spike in bond yields.
🌍 Currency Market Implications
EUR/USD:
The momentum of a dovish Fed and US fiscal pressure could support the dollar. However, divergence in bond yields could support moderate euro strength if the ECB remains cautious.
EUR-linked currencies (e.g. SEK, NOK):
These could come under pressure from rising risk premia and possible increase in government bond issuance.
JPY and CHF:
Likely to benefit from high volatility and safe-haven flows amid geopolitical tensions.
🧭 Strategic Outlook
Theme Market Impact
Increased defense spending Supports government bonds, increases government bond yields.
Fiscal tightening Increases credit risk premia.
US defense dominance Strengthens the USD in the short to medium term.
Geopolitical unity Strengthens investor confidence, mitigates risk-off tendencies.
📝 Conclusion
NATO summit signals a geopolitical shift that extends to currency and credit markets. Forex traders should pay attention to:
Yield changes in the US versus Europe due to increased deficit financing.
Currency inflows into the US dollar on defense and risk themes.
Safe-haven demand if tensions in Russia-Ukraine or the Middle East flare up again.
Thanks a lot for making it this far. Stay tuned for more analysis.
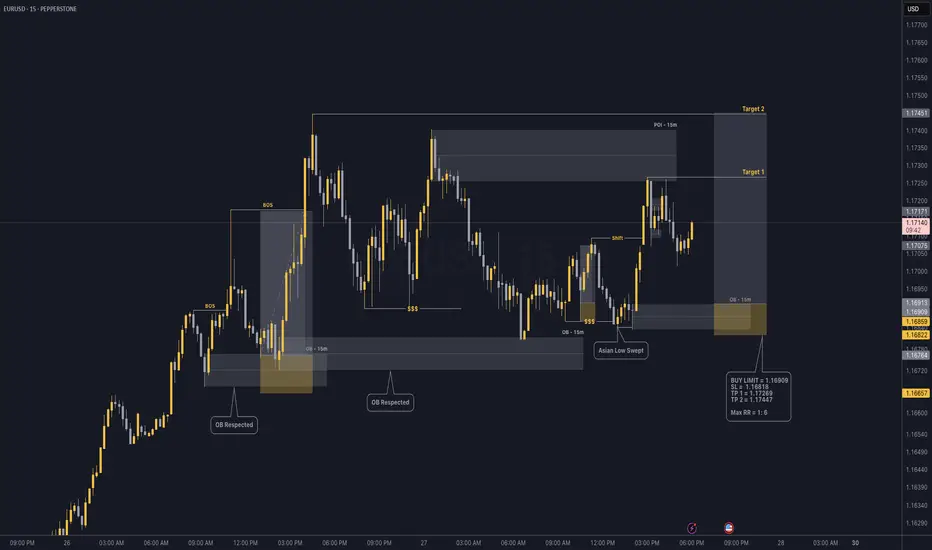
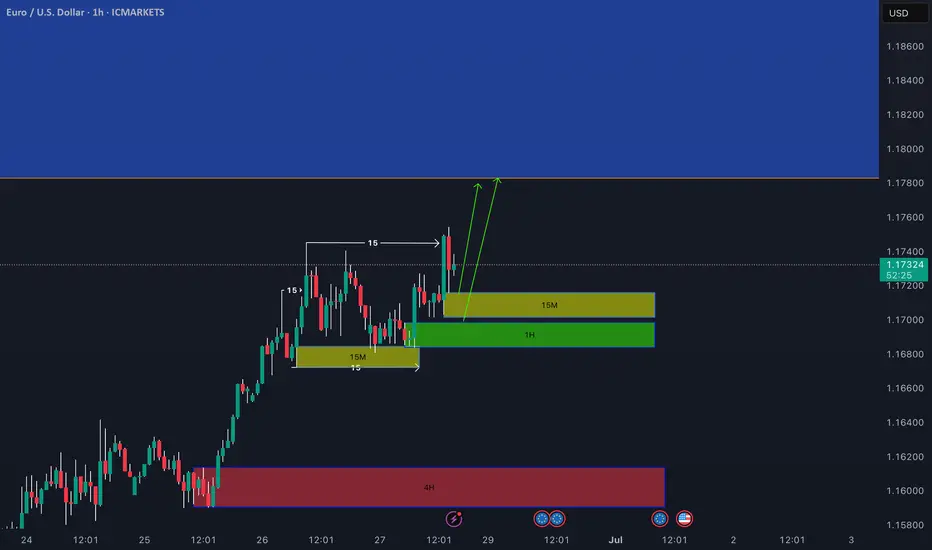
EUR/USD - Potential Long Continuation.Most of the OB are being respected in the 15 minute time frame.
Now price is retracing to the downside after touching the bearish POI (15m) and I am anticipationg that price will retrace back to the bullish OB (15m) and start pushing higher during NY Session.
I believe the latest OB created should be a high probability OB as it has swept Asian Low and start displacing further , showing sign of bullish momentum.