EURUSD: The Market Is Looking Up! Long!
My dear friends,
Today we will analyse EURUSD together☺️
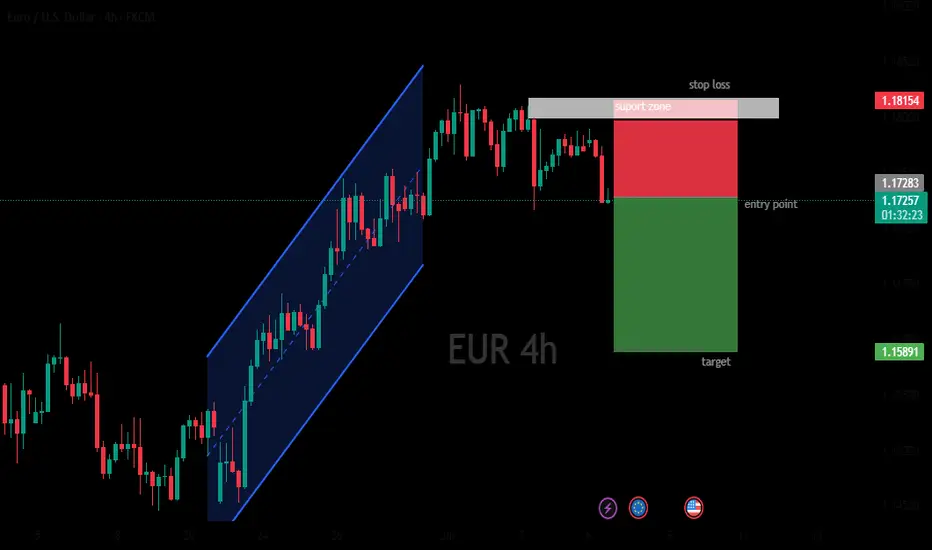
The market is at an inflection zone and price has now reached an area around 1.17341 where previous reversals or breakouts have occurred.And a price reaction that we are seeing on multiple timeframes here could signal the next move up so we can enter on confirmation, and target the next key level of 1.17512.Stop-loss is recommended beyond the inflection zone.
❤️Sending you lots of Love and Hugs❤️
EURUSD trade ideas
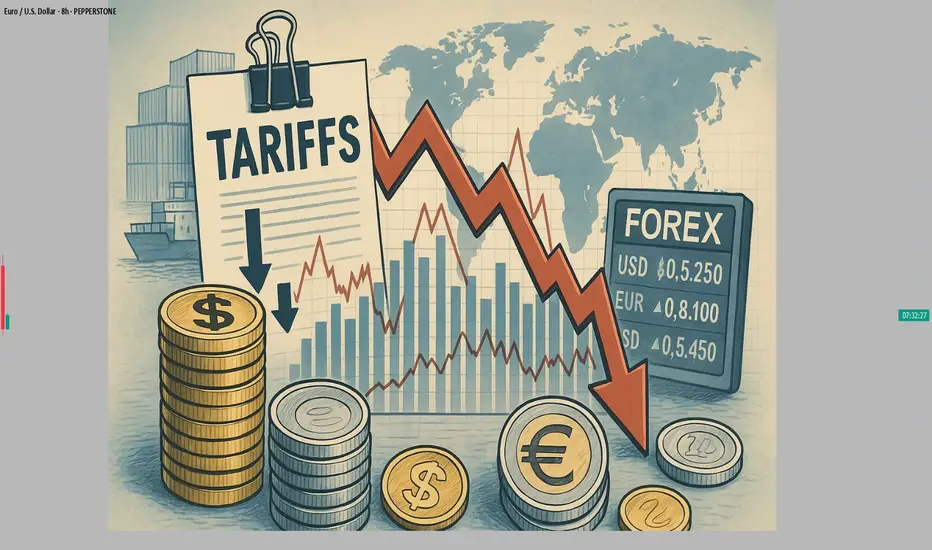
#AN016: Markets Brace for Tariffs, Forex Reaction
Markets have taken a cautious tone this week, as investors digest new developments on global trade and central bank prospects. A mix of US tariff threats, higher OPEC+ oil production and surprisingly strong eurozone investor sentiment is shaping currency flows.
I'm Forex Trader Andrea Russo, and I want to thank our Official Broker Partner PEPPERSTONE in advance for helping me put this article together.
Investor confidence in the eurozone surged to a three-year high in July. This positive sentiment is reducing the European Central Bank's room to cut rates further, even as inflation remains subdued.
Meanwhile, US President Trump has ordered letters threatening tariffs of up to 70% for nations that fail to conclude trade deals by August 1, creating fresh uncertainty in diplomatic and trade circles.
Asian markets and BRICS currencies have already shown signs of weakness, while US futures have weakened on the threat.
Oil markets have also reacted sharply to OPEC+’s announcement of a higher-than-expected production increase of around 550,000 barrels per day from August, which has pushed Brent below $68 and US crude below $66.
On the European inflation front, the ECB is opting to postpone further rate cuts. Estonian Minister Madis Müller confirmed that the ECB can afford to put monetary easing on hold, given stable inflation and solid growth.
reuters.com
Forex Impact – What Traders Should Watch
The combination of strong eurozone sentiment and looming trade tensions is driving significant currency dynamics this week:
EUR/USD: The euro has room to strengthen further. Optimistic sentiment and a pause from the ECB reinforce the bullish bias, but tariff uncertainty could trigger safe-haven demand for USD.
USD/JPY and CHF: The dollar could find support amid global risk aversion, pushing JPY and CHF higher.
Commodity currencies (CAD, AUD, NOK): Under double pressure: higher oil supply and rising trade risks could weigh on crude-related currencies.
Emerging market currencies: BRICS currencies could remain under pressure due to threats of additional US tariffs; Indian rupee and other currencies could depreciate further.
US Jobs Data Supports Fed Dovish SignalsThe EUR/USD stayed in a narrow range around 1.1760 during Friday’s Asian session, with limited movement as US markets were closed for Independence Day.
The US dollar gained modestly after Thursday’s NFP data showed 147,000 new jobs in June, beating the expected 110,000.
However, private sector job growth slowed, adding only 74,000 jobs in June versus a three-month average of 115,000. This trend supports Fed officials like Vice Chair Bowman, who recently called for rate cuts due to labor market risks.
Resistance for the pair is at 1.1830, while support is at 1.1730.
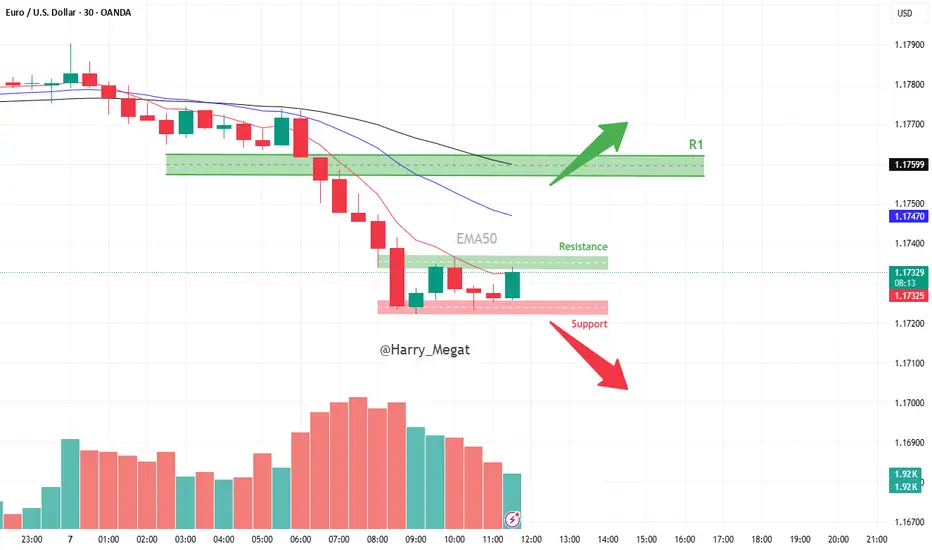
EURUSD Setup Scenario A – Bearish Continuation:
🔻 Sell near 1.17300–1.17340 (Resistance Zone)
🎯 Target: 1.17200 or lower
📉 Stop Loss: Above 1.17350
Scenario B – Bullish Breakout:
🔼 Buy if price breaks above 1.17350 with volume
🎯 Target: Next resistance zone (e.g., 1.17450 or more)
📉 Stop Loss: Below 1.17280
🧠 Summary:
Market is consolidating after a drop.
Watching for breakout above resistance or breakdown below support for next move.
Currently, the bias is slightly bearish, but breakout scenarios must be monitored.
EUEu short based on the simple analysis and targeting the liquidity and the FVG price is tring to return back
EUR/USD 4 HOURS BEARISH ANALYSISThe image depicts a computer screen displaying a trading platform, specifically the Euro/U.S. Dollar currency pair on a 4-hour chart from FXCM. The chart features a black background with a blue trend line and a blue shaded area, indicating an upward trend. The price action is represented by red and green bars, with the current price at 1.17283.
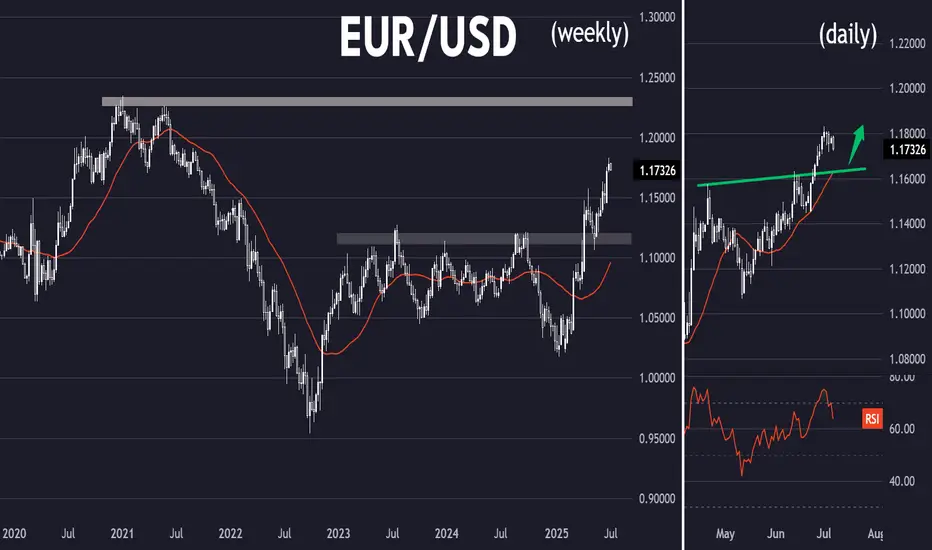
Where the coffee is strong (EUR/USD)Setup
EUR/USD is in a strong uptrend and recently broke above multi-year resistance just under 1.16. The pair looks to be targeting long term resistance at 1.23.
Signal
RSI is dropping back from overbought territory on the daily chart, offering a possible dip-buying opportunity above resistance-turned-support at 1.16.
Check the trend It is expected that the correction will end at the current support level and we will see the start of an uptrend. Otherwise, the correction may continue to the specified support levels. Then there is a possibility of a trend change.

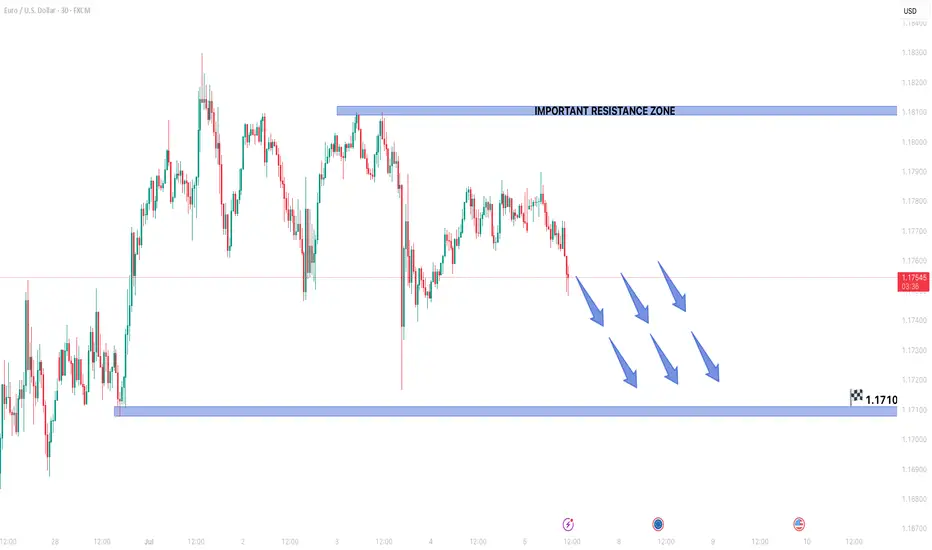
EURUSD FORMING BEARISH TREND STRUCTURE IN 15 MINUTES TIME FRAMEEURUSD is forming lower lows and lower highs.
Sellers are maintaining selling pressure from late few sessions.
Market is expected to remain bearish in upcoming trading sessions.
On lower side market may hit the target level of 1.17100
On higher side 1.18100 can act as an important resistance zone.
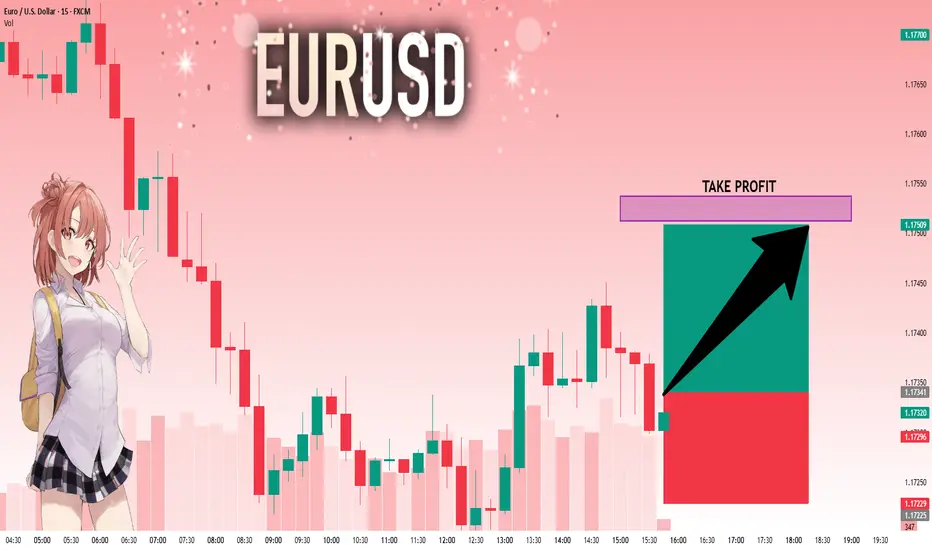
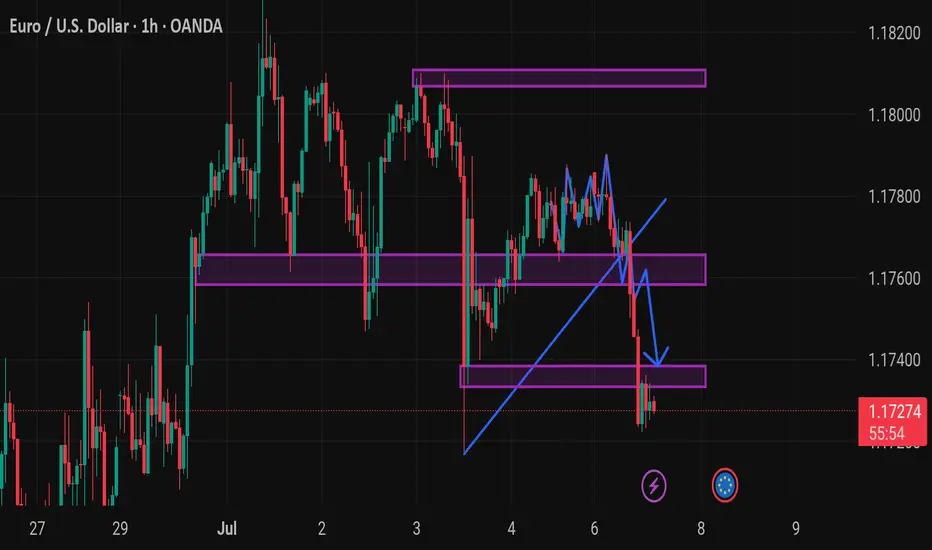
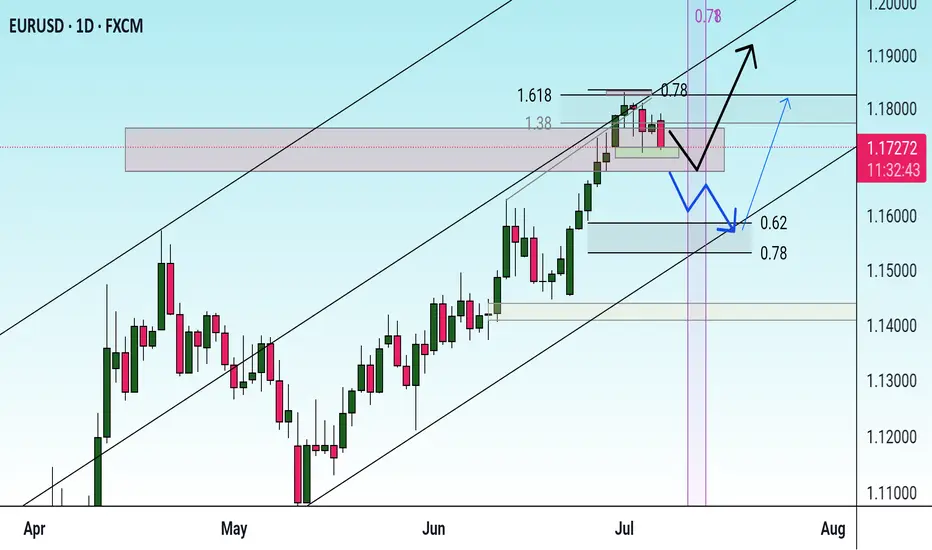
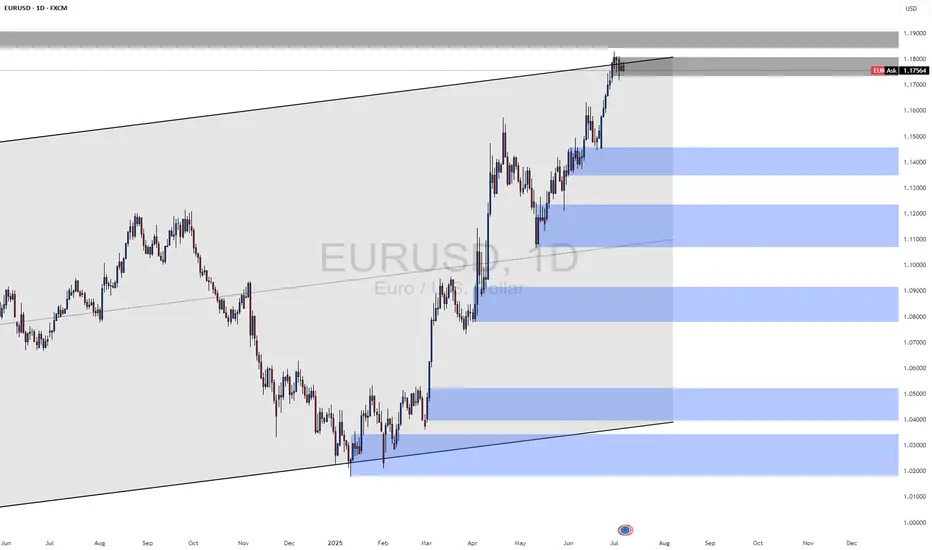
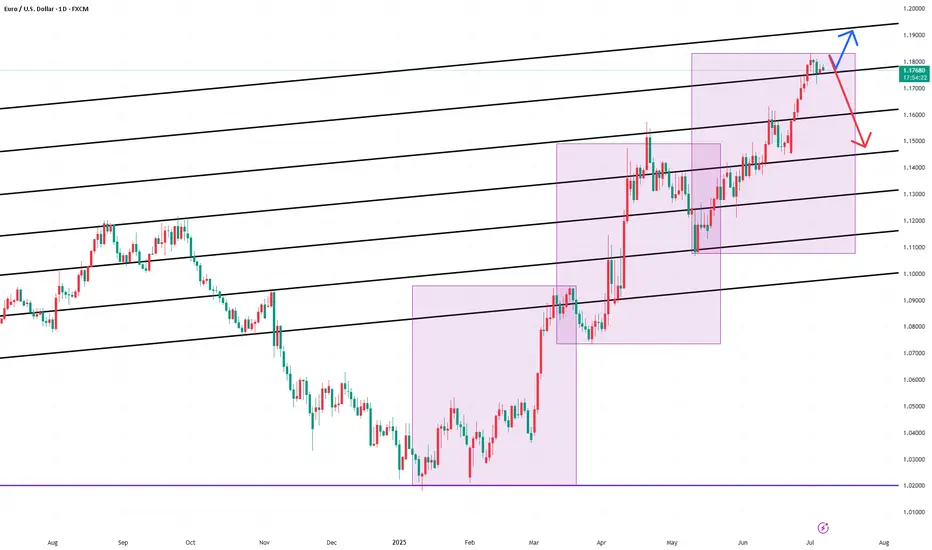
EUR/USD Pair Analysis📉 EUR/USD Pair Analysis – Monday, July 7, 2025
1️⃣ A clear ascending price channel on the daily chart defines the overall trend of the pair.
2️⃣ The price is currently touching the upper boundary of the channel, indicating a potential downward correction from the designated areas (in gray).
3️⃣ Strong demand areas have emerged at lower levels, which may support a subsequent upside move.
📌 Summary and Recommendation:
🔻 In the short term:
An opportunity to quickly sell the pair using scalping from the current areas, targeting nearby points.
🔺 In the medium to long term:
We prefer to wait for a decline to the lower boundary of the price channel, as we plan to buy from there, in line with the general uptrend.
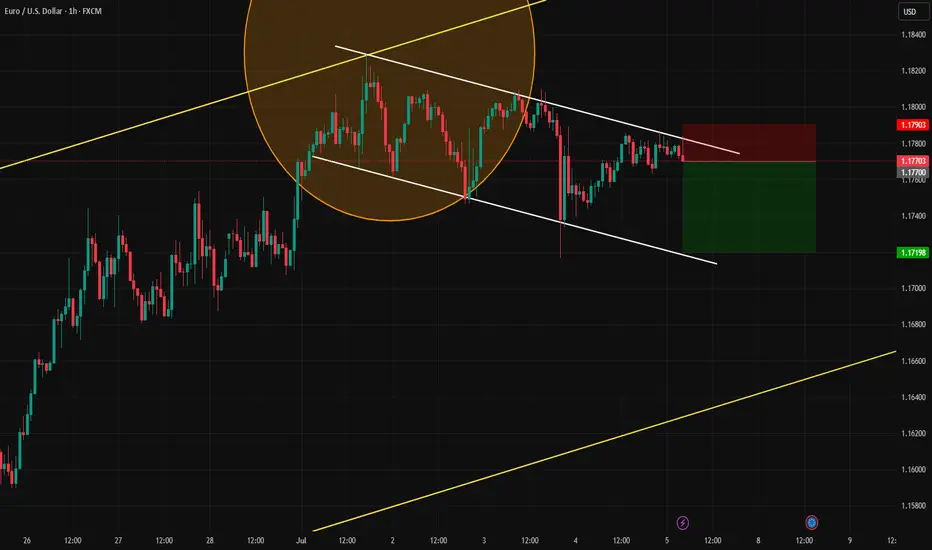
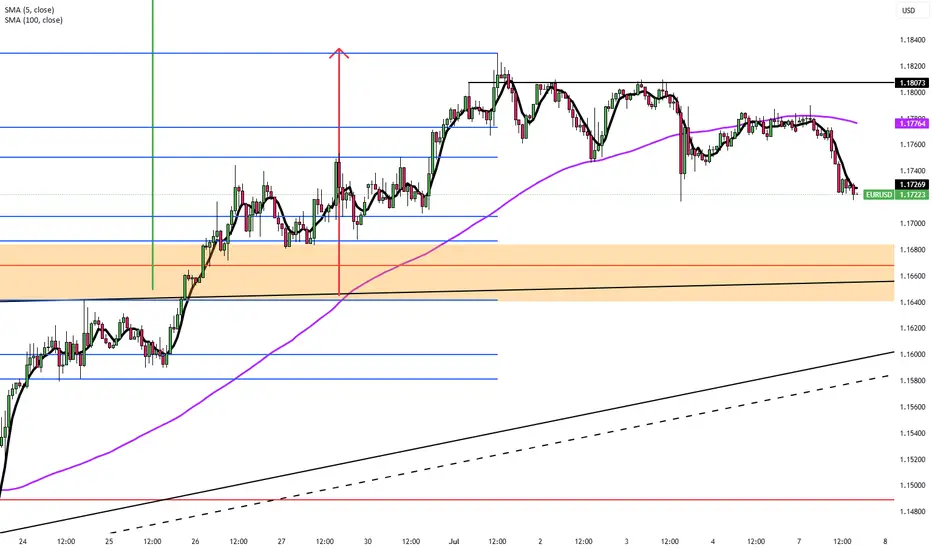
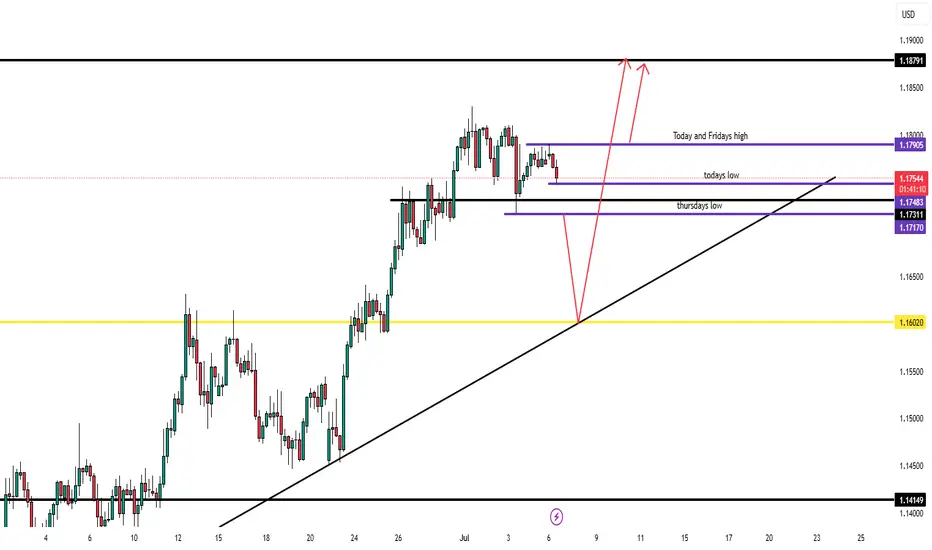
EURUSD – Monday July 7th Outlook - 4hr chartPrice action confirms resistance at 1.17905, now tapped on both Friday and today.
Current View:
Bullish bias remains intact long-term
Short-term: Expecting a deeper pullback
Range forming between 1.17170 – 1.17905
Scenarios:
Break below 1.17170 = Likely move to 1.16020 (previous swing low)
Break + close above 1.17905 = Clean continuation to 1.18791
While inside range → No trade
Key Buy Zones:
✅ 1.16020 rejection
✅ Break + retest above 1.17905
Patience until direction confirms.
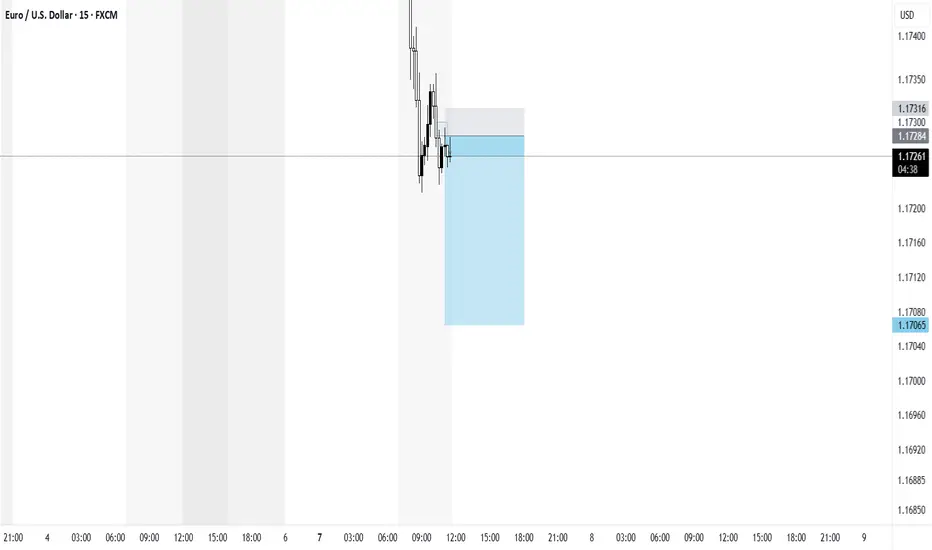
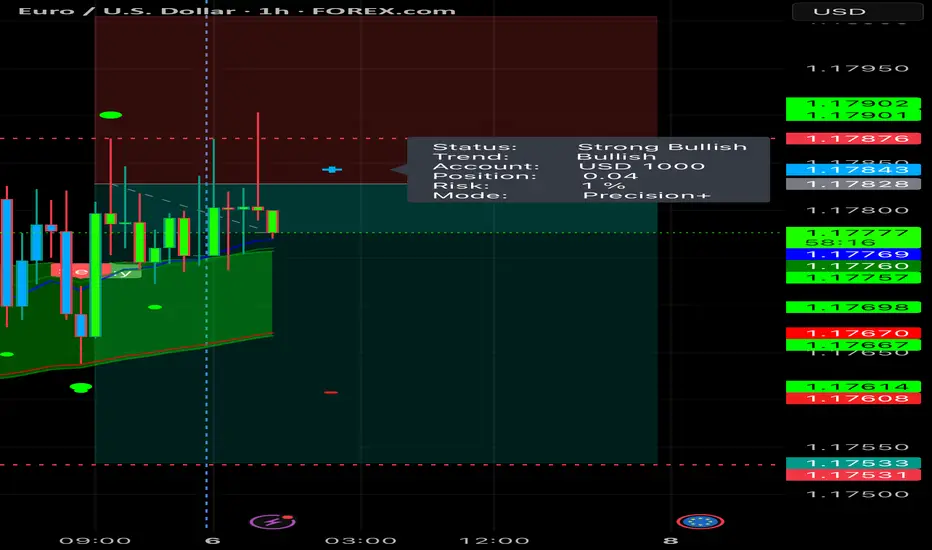
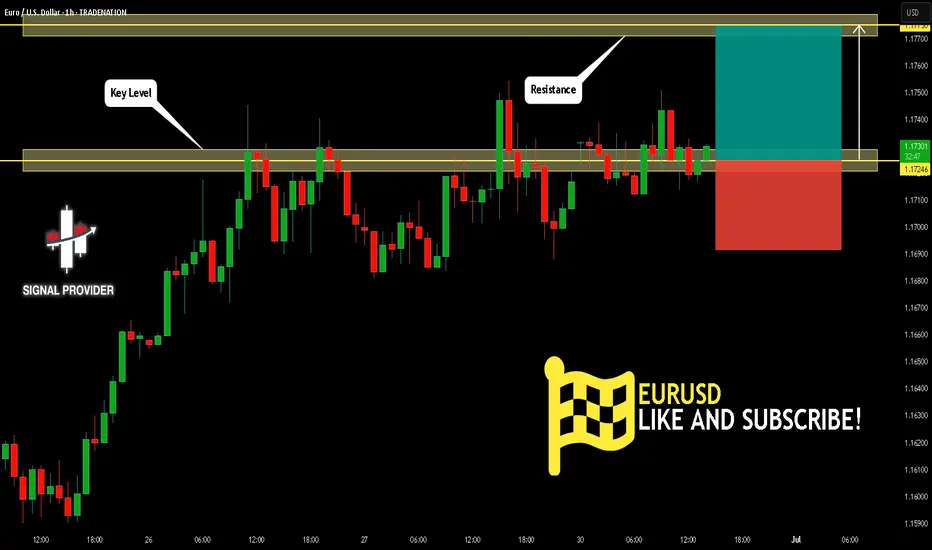
EURUSD Will Go Higher From Support! Long!
Take a look at our analysis for EURUSD.
Time Frame: 1h
Current Trend: Bullish
Sentiment: Oversold (based on 7-period RSI)
Forecast: Bullish
The market is on a crucial zone of demand 1.172.
The oversold market condition in a combination with key structure gives us a relatively strong bullish signal with goal 1.177 level.
P.S
We determine oversold/overbought condition with RSI indicator.
When it drops below 30 - the market is considered to be oversold.
When it bounces above 70 - the market is considered to be overbought.
Disclosure: I am part of Trade Nation's Influencer program and receive a monthly fee for using their TradingView charts in my analysis.
Like and subscribe and comment my ideas if you enjoy them!
Decisive Week: Duties, Oil and Flight from the Dollar
Hello, I am Forex trader Andrea Russo and today I want to talk to you about the week full of tensions and opportunities in global currency markets. The new tariff threats from the United States, the strategic moves of OPEC + and the growing instability in the British government bond market are shaking up the entire Forex landscape, with direct implications on USD, AUD, CAD, GBP and JPY. I thank in advance the Official Broker Partner PEPPERSTONE for the support in the creation of this article.
The most explosive news concerns the possible imposition of new duties by the United States, with a deadline set for July 9. The American administration, according to Reuters sources, is ready to activate tariffs of up to 70% on some categories of strategic imports if new bilateral agreements are not signed by the end of the month. The market has reacted cautiously, but signs of systemic risk are starting to filter through: US futures are falling, capital is moving into safe havens, and the dollar is starting to lose ground structurally.
The decline in oil has added further pressure. OPEC+ announced the start of an increase in production from August, with about 550 thousand barrels per day more than the current level. This has hit Brent and WTI hard, which are now both below $68. Currencies that are highly correlated to commodities, such as CAD and NOK, are weakening, especially in the absence of a monetary response from their respective central banks.
Meanwhile, the UK is facing a delicate moment. Yields on 10-year gilts have risen to their highest since April, with a sell-off that has forced the Bank of England to review the pace of its asset disposal. The instability of the British debt is putting pressure on the pound, already tested by inflation that is struggling to recover and a stagnant housing market. The GBP/USD pair remains extremely volatile, while EUR/GBP is moving sideways waiting for a clearer direction.
But the star of the week is Australia. The AUD has scored the eighth consecutive week of gains, taking advantage of both the weakness of the dollar and the expectations of a more gradual future rate cut by the RBA. The AUD/USD cross has broken the highs of November 2024 and is now targeting levels of 0.67-0.68. The same goes for NZD/USD, which is also in a phase of bullish consolidation. The US dollar, on the other hand, has recorded its worst start to the year since 1973: a combination of political uncertainty, fiscal instability and falling confidence is eroding global demand for the USD, pushing many managers to diversify into emerging or commodity-linked currencies.
Finally, the Federal Reserve is taking its time. Powell stated that the path of rates will be closely linked to the evolution of trade tensions. The Fed, therefore, appears more wait-and-see than expected, postponing a possible cut to the third quarter. This leaves the dollar exposed to downward pressure, especially if inflation were to slow further in the meantime.
In summary, this week offers extremely interesting scenarios for Forex traders. Institutional flows seem to favor alternative currencies to the dollar, while sentiment remains fragile on GBP and CAD. AUD, NZD and JPY emerge as potential winners, at least until new macro developments or significant technical breaks.
The watchword is: selection. With volatility on the rise and the geopolitical context rapidly evolving, only those who know how to read the movements of central banks and institutions in advance will be able to take full advantage of the opportunities offered by the markets.

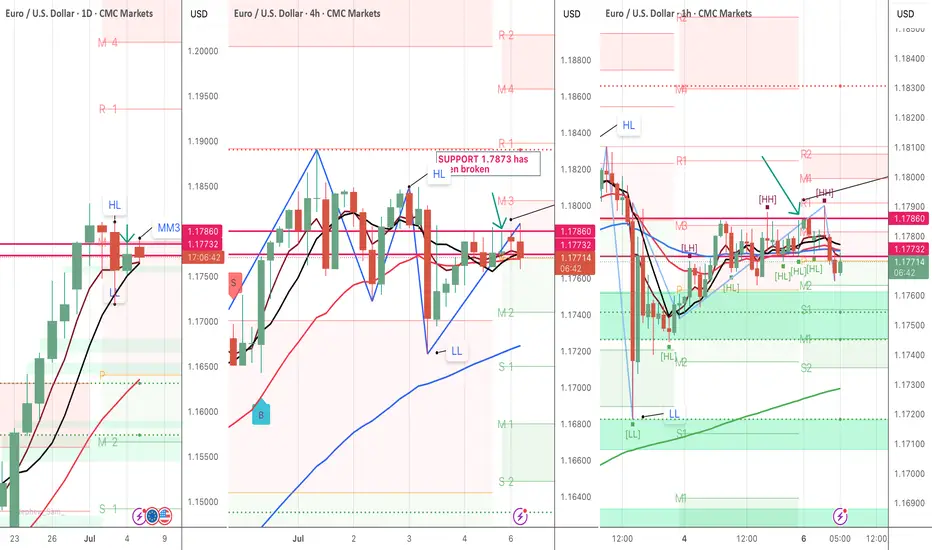
EURUSD- SHORT to SUPPORT (but I'm a BULL longterm)EURUSD- has seen a magnificant rise and long trend for several months since January.
Watching for a pullback to the 21EMA and Daily support to take this long again.
- At Monthly M3
-USD strength to resistance expected this week.
-Bearish candle LL after 3 touches of Resistance and a LL.
- the previous inside candle occurred on Friday but we did not make a HH or a LL.
-On the hourly we are bearish, having broken support and restesting.- 1.1774 & 21 EMA.
- Under 1.1717 price will turn bearish on daily.
-Watching the next possible support level of 1.1763 as a level that may hold.
Short-term bear target - 1.1623 - Support and Dly 21 EMA restest of channel bottom to take this long with confirmation.
EURUSD InsightHello to all our subscribers,
Please feel free to share your personal opinions in the comments. Don't forget to like and subscribe!
Key Points
- President Trump stated, “A letter will be sent on Monday, and it could be 12 countries, possibly even 15.” He added, “I think we’ll finalize negotiations with most countries by July 9 — either a letter or a deal.”
- U.S. Treasury Secretary Scott Besent said that “President Trump will send a letter stating that if negotiations with trade partners do not make real progress, tariff levels will revert to those announced on April 2, starting August 1.”
- The legislative process for the “One Big Beautiful Bill,” centered on making Trump’s tax cuts permanent, was completed on July 4. The U.S. Treasury is expected to significantly increase the issuance of Treasury securities soon.
Key Economic Events This Week
+ July 8: Reserve Bank of Australia (RBA) Interest Rate Decision
+ July 9: Release of FOMC Meeting Minutes
+ July 10: Germany June Consumer Price Index (CPI)
+ July 11: United Kingdom May GDP
EURUSD Chart Analysis
The pair recently broke above the 1.18000 level and appears to be approaching key resistance near the highs. There still seems to be some room for further upside. If the upward move continues, the 1.19000 level is the most likely target for the next peak. However, if the trend reverses downward, a pullback to the 1.15000 level remains a possibility.
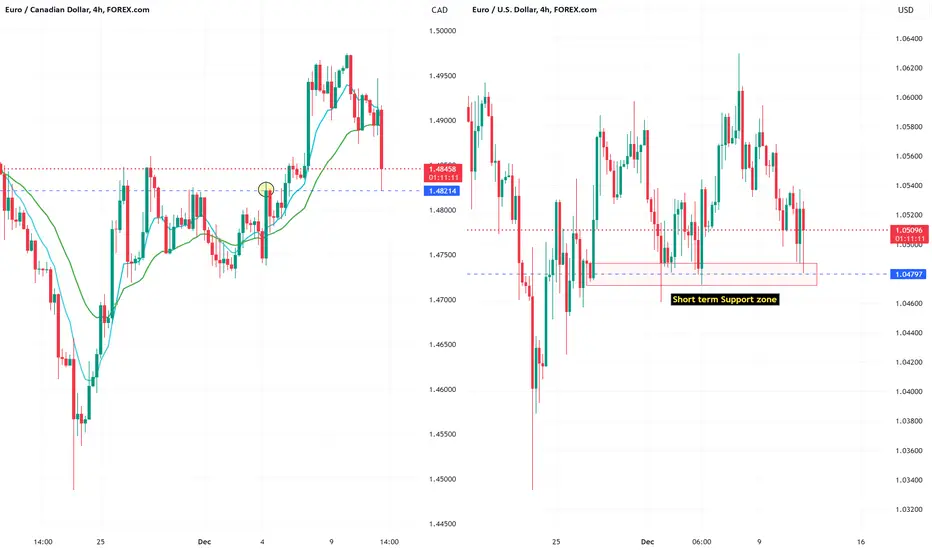
EUR/CAD: Long. Is this a "loonie" trade?Hello traders
Clarification: CAD is also referred to as the loonie, a former Canadian one dollar coin.
The 50 base point cut by the BoC was expected. The CAD strengthened against the USD and CAD immediately afterwards. Classic knee jerk reaction of buy the rumor, sell the news.
Both EUR/CAD and EUR/USD have found support on the 4H chart.
The EURO has been on the backfoot against the USD but with the ECB rate decision in less than 24 hours, I have taken a long EUR/CAD position.
The ECB is expected to cut by 25 base points which will still give the CAD a slight advantage. However, the Canadian forward guidance points to more rate cuts to stimulate consumer spending, albeit more gradually/25 points at a time.
This leaves the ECB's forward guidance to cement this idea.
IF Ms. Lagarde once again expresses concern about inflation moving forward, the EURO may appreciate across the board.
Fundamentally the Euro Zone needs this rate cut. The economic conditions are not great at the moment.
That leaves the FOMC next week and also the BOJ to provide us with more forward guidance. Once this is out of the way, we'll have a much better idea what to expect in 2025, bar some more geopolitical unrest or other major market moving event.
Best of luck, all.
The EUR/JPY is also some upside promise but keep in mind, the JPY marches to its own drummer.
DXY is also retreating
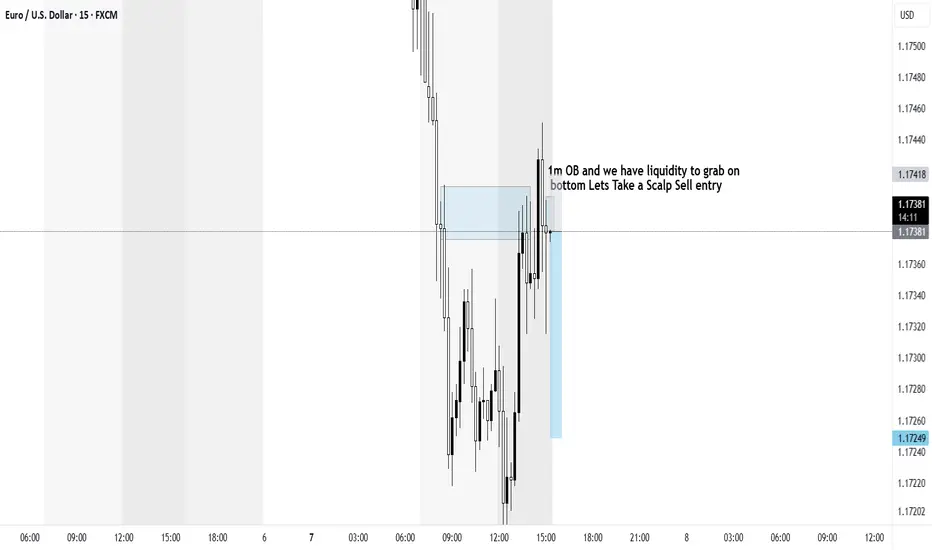
EUR/USD Trade Plan – Sell Limit StrategyEUR/USD has shown signs of completing a 5-wave bullish structure on the 4H chart, with price now re-testing a key supply zone. A Sell Limit has been positioned at 1.17962, anticipating a sharp reversal back toward the order block zone.
🔍 Technical Analysis
The chart shows a clear Elliott Wave formation, with wave V forming a weak new high, indicating buyer exhaustion.
Price is approaching the 1.17960–1.18013 supply zone, previously unmitigated.
This zone also holds an Order Block (OB) and liquidity above wave III, making it a prime area for institutional sell triggers.
📌 Entry: 1.17962
🛑 Stop Loss: 1.18113
🎯 Target Zone: 1.17122
📈 Risk–Reward: 3R – 6R - 10r potential (depending on trade management)
🧠 Fundamental Outlook
The upcoming trading week is filled with market-moving events from both the US and Eurozone:
🇺🇸 Key USD Events
Non-Farm Payrolls (Fri): Forecast 147K; strong print = bullish USD.
Unemployment Rate: Expected at 4.1%.
Powell Speech, ISM Services PMI: Will impact rate expectations and USD strength.
🇪🇺 Key EUR Events
CPI Flash Estimates: Any surprise may shift ECB tone.
Lagarde Speaks: Markets listening for any policy hints after soft data.
🧩 The combination of a potentially strong USD and weakened Euro fundamentals adds weight to a bearish EUR/USD outlook.
💡 Why This Setup Works
Perfect Liquidity Trap: The zone is designed to trigger late buyers before reversal.
Clean Risk–Reward: Defined SL with a high-probability downside path.
Macro + Technical Confluence: Both align toward downside potential.
Target OB: Strong institutional demand seen at 1.1712 offers a natural take-profit zone.
⚠️ Execution Guidance
Enter only if price hits the Sell Limit zone cleanly.
Avoid execution during red news releases.
Partial TP suggested near 1.1740 (around 2R–3R) to lock early profit.

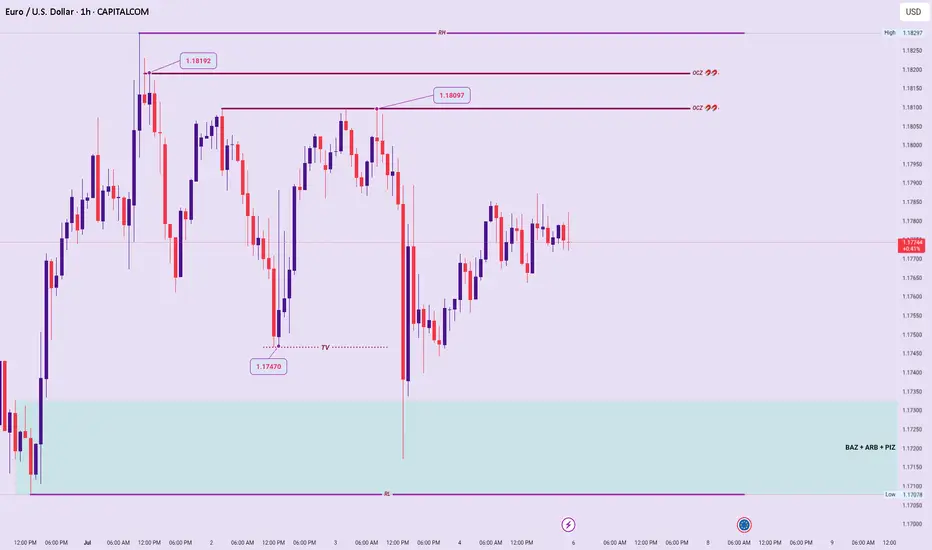
EURUSD: New-Week Technical Bias (Market Open)Multi-Timeframe Structural Outlook:
Higher Timeframes (Monthly, Weekly, Daily):
Market structure remains in a clear Ascend Sequence, reflecting an intact Buy-Side Bias Environment (BBE). Price action continues to build bullish structure, supporting an overall upward lean.
Lower Timeframe Technical Snapshot:
4H & 1H:
Current price consolidates within a well-defined Value Compression Phase (VCP) between 1.8297 – 1.7078, signaling temporary indecision and mixed short-term directional clarity.
Liquidity Mechanics & Trap Dynamics:
Recent Sweep Event targeting 1.7470 exploited a Trap Vector (TV), drawing price below perceived support to tap into underlying liquidity pockets within both a Price Inefficiency Zone (PIZ) and Bid Accumulation Zone (BAZ). Following this engineered sweep, price reversed, validating hidden bullish intent beneath the range.
Order Clustering Targets:
Expect clustered liquidity and potential price magnet zones at 1.8097 and 1.8192, representing logical upside attractions aligned with orderflow objectives.
Reaction Points:
VCP High (1.8297):
Break and sustained acceptance above signals potential Ascend Sequence continuation and broader bullish resumption.
VCP Low (1.7078):
Breakdown with intent below increases probability of a Trend Signature Shift (TSS), signaling bearish structure vulnerability and potential trend deterioration.
Summary:
Bullish on HT structures remains valid, but short-term bias is mixed pending confirmed resolution of the VCP range boundaries. Price behavior at the highs/lows of the compression zone will dictate next directional conviction.
Short EU next weekAs can see from chart EU is currently in a small down channel and now price rejected the upper channel with good pin bar formation. Sell this projected to the lower channel