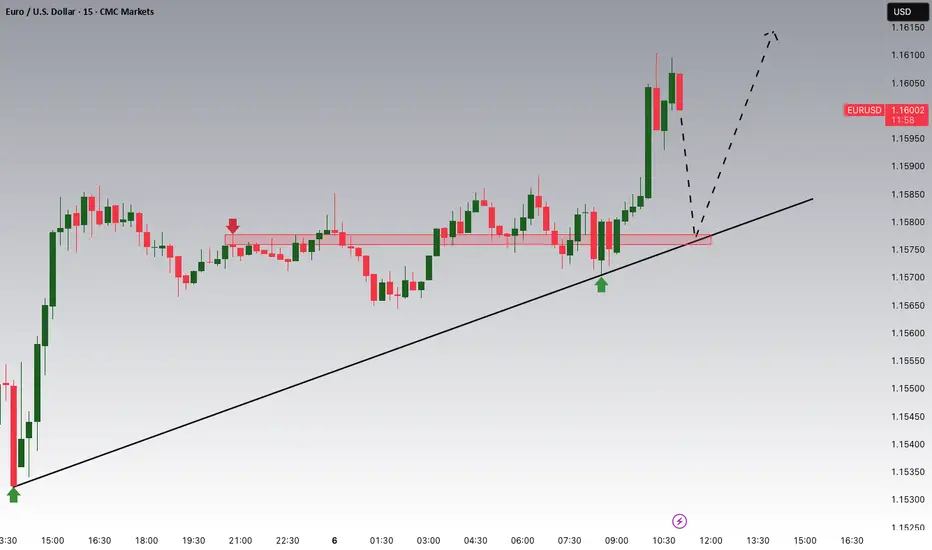
EURUSD Potential UpsidesHey Traders, in today's trading session we are monitoring EURUSD fora buying opportunity around 1.15800 zone, EURUSD is trading in an uptrend and currently is in a correction phase in which it is approaching the trend at 1.15800 support and resistance area.
Trade safe, Joe.
EURUSD trade ideas
EURUSD - One More Bearish Impulse Soon!Hello TradingView Family / Fellow Traders. This is Richard, also known as theSignalyst.
📈EURUSD has been overall bearish trading within the falling broadening wedge pattern marked in red and it is currently retesting the upper bound of the channel acting as a non-horizontal resistance.
Moreover, the blue zone is a strong supply.
📚 As per my trading style:
As #EURUSD retests the red circle zone, I will be looking for bearish reversal setups (like a double top pattern, trendline break , and so on...)
📚 Always follow your trading plan regarding entry, risk management, and trade management.
Good luck!
All Strategies Are Good; If Managed Properly!
~Rich
Disclosure: I am part of Trade Nation's Influencer program and receive a monthly fee for using their TradingView charts in my analysis.

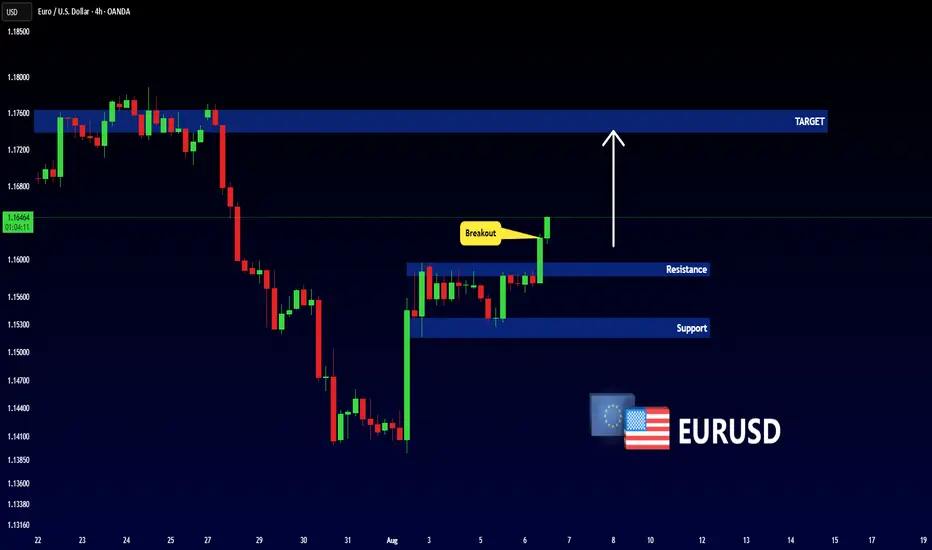
EURUSD - NEW BREAKOUT!Hello Traders!
The EURUSD price formed a rectangle pattern.
At the moment, the resistance level (1.15971 - 1.15830) is broken!
So, I expect a bullish move🚀
__________
TARGET: 1.17390🎯
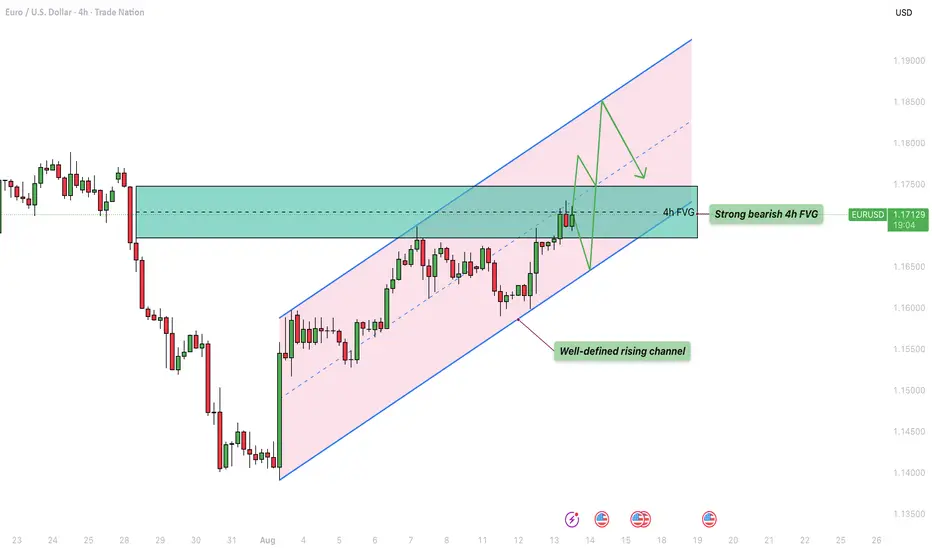
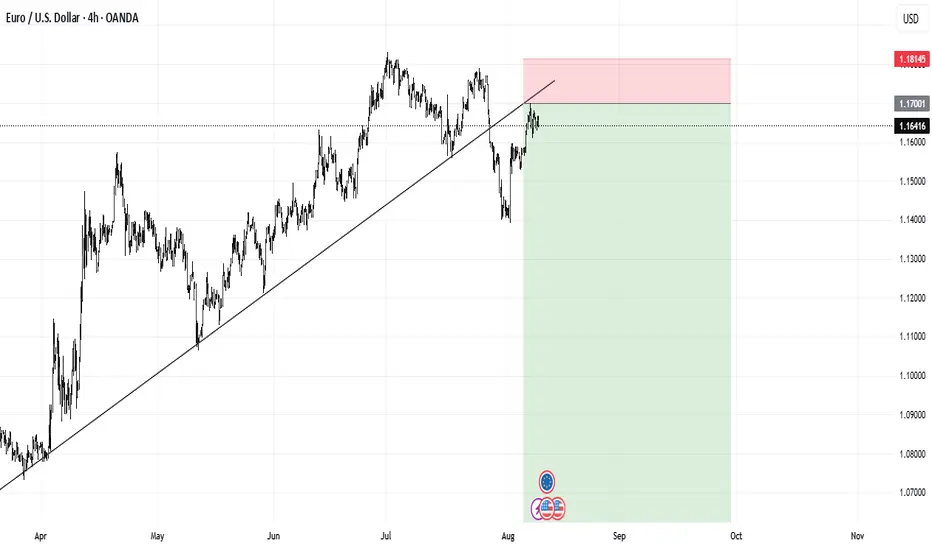
EURUSD - Moving towards the upper boundary in the rising channelSince reaching its recent low on August 1st, EUR/USD has been moving within a clear and consistent rising channel on the 4-hour chart. This upward structure has been well respected, with price action repeatedly reacting to both the upper resistance and lower support boundaries. The overall trajectory suggests that buyers have been steadily in control, but current market positioning shows the pair approaching a significant area that could determine the next directional move.
Rising channel
On the 4-hour timeframe, EUR/USD continues to trade inside this well-defined rising channel, with the slope indicating a healthy bullish trend. The price has been making higher highs and higher lows, consistently respecting the boundaries of the channel. At present, EUR/USD is hovering near the midline of this structure, which often acts as a pivot area where momentum can either accelerate toward the channel top or retrace toward its base.
4H FVG resistance
Currently, EUR/USD is facing a strong 4-hour Fair Value Gap (FVG) resistance zone, positioned around the 1.1720–1.1750 region. This supply area is from a sharp sell-off from late July and may act as a significant hurdle for buyers. If this resistance holds, price could be pushed back down toward the lower boundary of the rising channel, possibly testing the 1.1620–1.1650 area. However, if EUR/USD manages to decisively break above this 4H FVG, it would open the door for a continuation toward the upper channel trendline, which currently lies near the 1.1850 level.
Bullish support on the rising channel
Should the 4H bearish FVG remain unbroken, the lower boundary of the rising channel becomes an important support to watch. A pullback toward this zone could provide buyers with a favorable opportunity to re-enter the market. A strong bounce from this support would reinforce the bullish structure and potentially set the stage for another attempt to breach the resistance area, with the aim of resuming the climb toward the channel’s upper limits.
Final thoughts
EUR/USD is in a critical position within its well-structured rising channel. The outcome at the current 4H FVG resistance will likely dictate the next swing. A break above could fuel a run toward the upper channel boundary near 1.1850, while rejection here may see a retracement to the lower channel support before another push higher.
-------------------------
Disclosure: I am part of Trade Nation's Influencer program and receive a monthly fee for using their TradingView charts in my analysis.
Thanks for your support. If you enjoyed this analysis, make sure to follow me so you don't miss the next one. And if you found it helpful, feel free to drop a like 👍 and leave a comment 💬, I’d love to hear your thoughts!
2 Ways to Trade Breakouts - Horizontal vs. Slanted StructureFX:EURUSD has put in a bullish pennant pattern. Normally with this pattern we would expect a breakout to the upside, but because we are sandwiched between two levels of previous structure, we just don't know.
Because that is the case, the best plan of action in my opinion is to wait for confirmation of the breakout & then look to get involved after the fact.
In this video we talk about 2 types of confirmation. 1) Horizontal levels of structure and 2) slanted levels of structure.
Which you use isn't as important as the consistency in which you use them.
Please leave any questions or comments below!
Akil

EURUSD Bears Ready to Take ControlEURUSD( FX:EURUSD ) is currently trading in a Heavy resistance zone($1.1815-$1.1602) and near the Resistance lines and Potential Reversal Zone(PRZ) .
In terms of Elliott Wave theory , it seems that EURUSD has completed a corrective wave. The corrective wave has a Zigzag Correction(ABC/5-3-5) structure .
Also, we can see the Regular Divergence(RD-) between Consecutive Peaks .
I expect EURUSD to decline at least to the Support zone($1.1642-$1.1578) .
Second Target: Monthly Pivot Point = $1.15491
Note: Stop Loss(SL)= $1.1803
Please respect each other's ideas and express them politely if you agree or disagree.
Euro/U.S. Dollar Analyze (EURUSD), 1-hour time frame.
Be sure to follow the updated ideas.
Do not forget to put a Stop loss for your positions (For every position you want to open).
Please follow your strategy and updates; this is just my Idea, and I will gladly see your ideas in this post.
Please do not forget the ✅' like '✅ button 🙏😊 & Share it with your friends; thanks, and Trade safe.

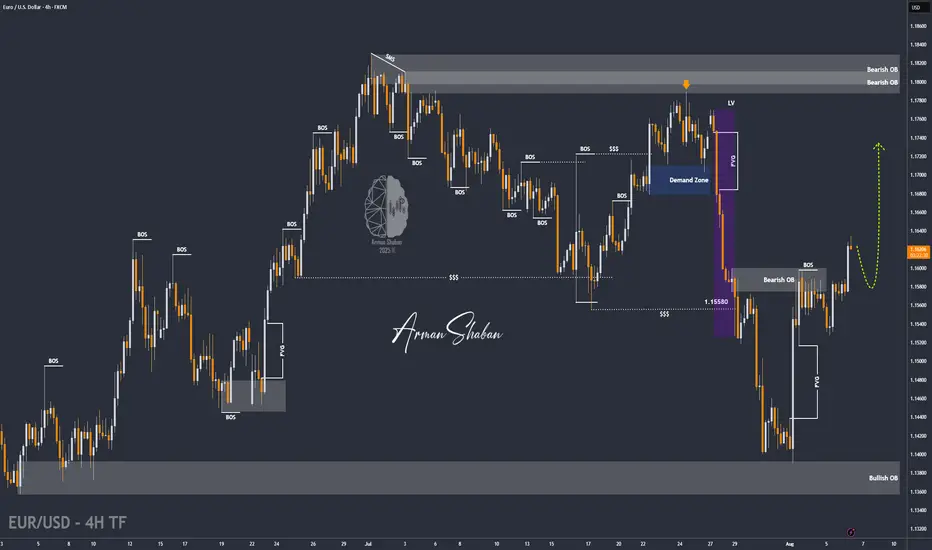
EUR/USD | Holding Above 1.16 Could Unlock More Upside! (READ IT)By analyzing the EURUSD chart on the 4-hour timeframe, we can see that the price reacted beautifully to all the marked zones on the chart. Especially after reaching the 1.14 demand area, it experienced a strong bullish move, rallying over 200 pips to hit 1.16. Currently, EURUSD is trading around 1.16220, and if it holds above the 1.16 level, we can expect further upside. The next bullish targets are 1.16435, 1.16780, 1.17100, and 1.17500.
Please support me with your likes and comments to motivate me to share more analysis with you and share your opinion about the possible trend of this chart with me !
Best Regards , Arman Shaban
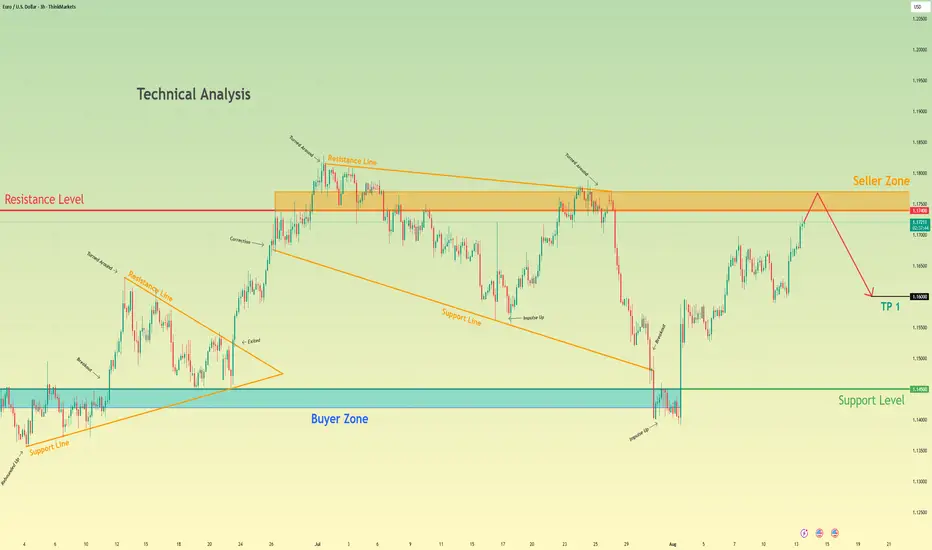
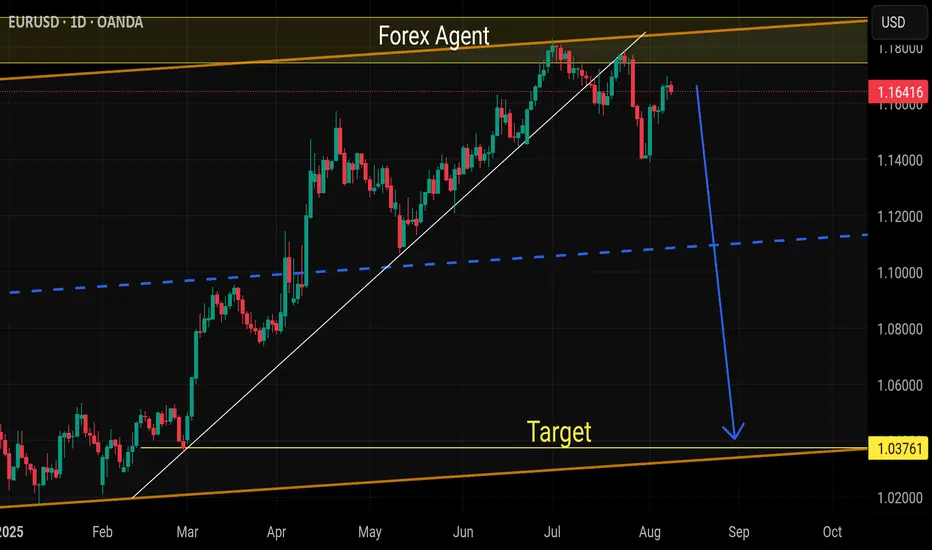
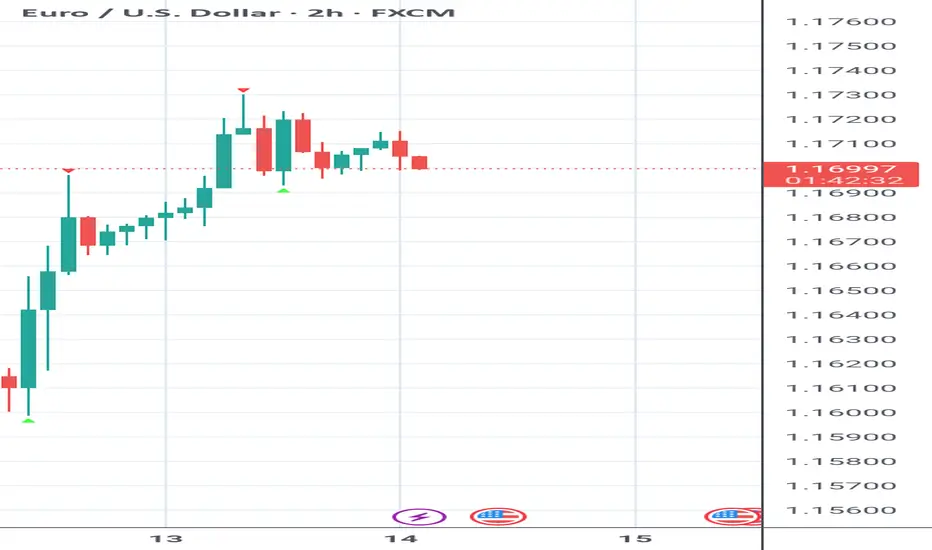
Euro may reach seller zone and then start to decline to 1.1600Hello traders, I want share with you my opinion about Euro. The historical price action for the Euro began with a period of contracting volatility, where the market consolidated within a triangle formation. A decisive breakout from this triangle unleashed a strong upward impulse, which marked a shift into the current market environment characterised by expanding volatility. This new phase is captured by a large broadening wedge, which has since been defining the trading range between the major buyer zone around 1.1450 and a significant seller zone near the 1.1740 resistance. After a powerful impulse down from the top of this wedge was absorbed by the buyer zone, the asset has entered a corrective rally back towards the upper boundary. Currently, the price is approaching this critical confluence of resistance. The primary working hypothesis is a short scenario, predicated on the expectation that the seller zone will once again cap the rally. A confirmed rejection from this area would validate the integrity of the broadening pattern and suggest that another major downward rotation is imminent. Therefore, the TP for this anticipated decline is logically placed at the 1.1600 points, representing a key area of prior price interaction and a prudent first objective. Please share this idea with your friends and click Boost 🚀
Disclaimer: As part of ThinkMarkets’ Influencer Program, I am sponsored to share and publish their charts in my analysis.
My Bias On EURUSD Dollar gains momentum and the pair is expected to fall as it has broken a higher time frame trendline, weekly and daily trendline. A long term is expected to continue the montly momentum(selling)
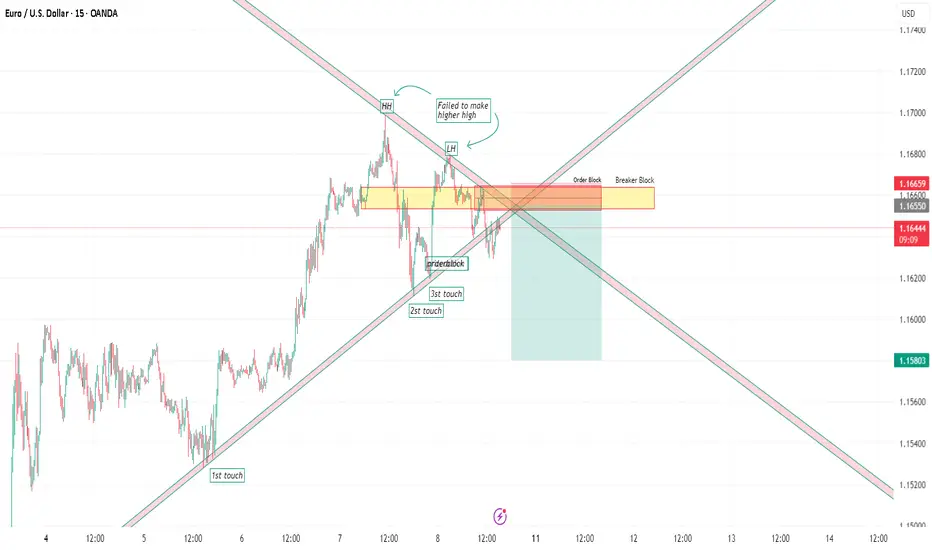
EURUSD – Watching Trendline + Resistance Zone for Short🧩 Setup Overview :
Price recently broke below a well-respected ascending trendline
It’s now approaching that same trendline from underneath
The area also aligns with a prior resistance zone and potential lower high
If price retests this zone and shows clear rejection, I’ll consider a short entry
🎯 Trade Plan (If Triggered) :
Short on confirmed rejection (not entering blindly)
Stop Loss: Above the recent high / invalidation point
Target: Next support level — clean structure, favorable R:R
💬 How are you approaching EURUSD here?
Always open to hearing different views. Drop your thoughts below 👇
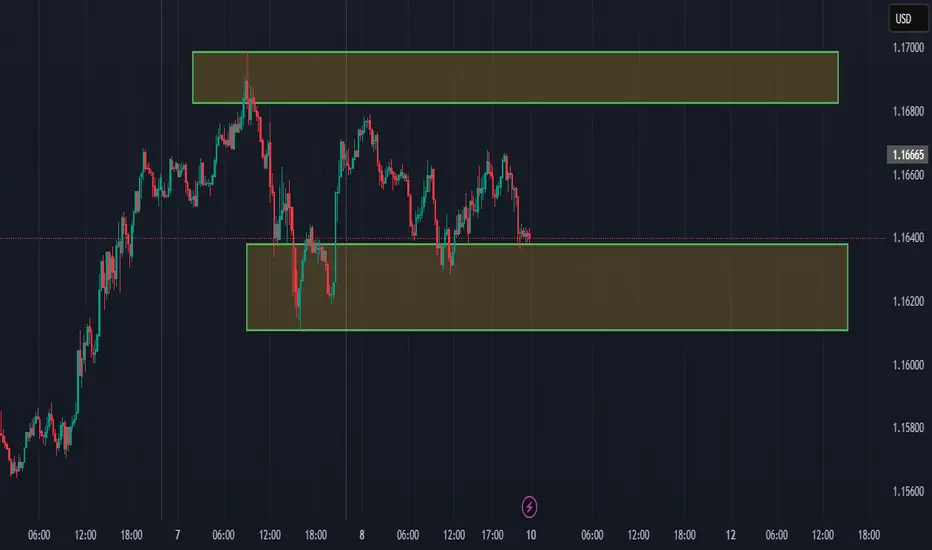
EUR/USD 1H Bearish Reversal SetupEUR/USD 1H Analysis:
Price is currently testing resistance near 1.16767. Bearish projection indicates potential reversal with target near 1.16173–1.16040 zone. Key level to watch: 1.16276.

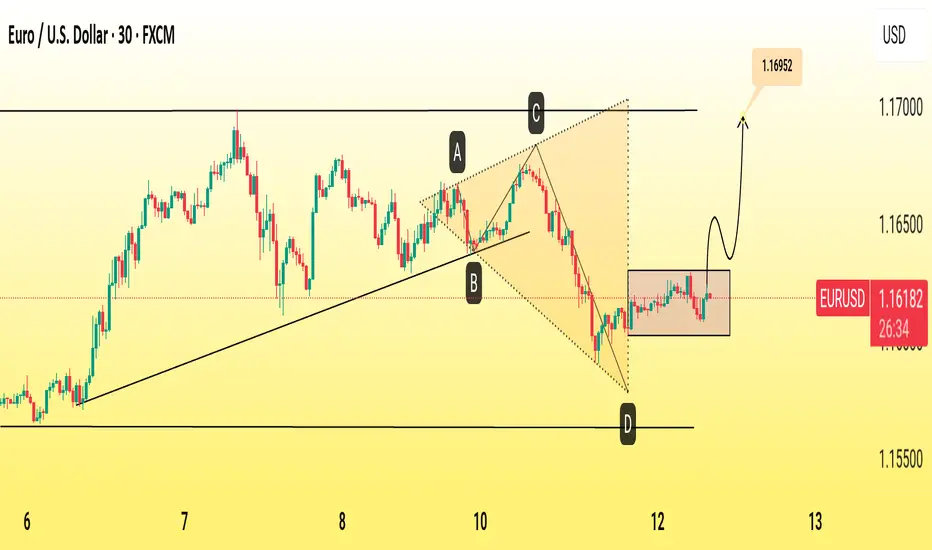
EUR/USD Bullish Reversal Pattern Targets 1.1695The EUR/USD 30-minute chart shows a completed ABCD harmonic pattern with a sharp bounce from the 1.1600 support zone. Price action suggests a bullish reversal toward the projected target of 1.1695, supported by strong demand at point D and a break above minor resistance. Traders may watch for confirmation on pullbacks before continuation.
1. Pattern Structure – ABCD Harmonic
The chart outlines an ABCD harmonic pattern, with points labeled A, B, C, and D.
Point D aligns with a strong horizontal support level around 1.1600, suggesting a potential reversal zone.
2. Trend Context
The pair had been in an uptrend from August 6–8, followed by a correction forming the ABCD structure.
The correction ended with a sharp drop from point C to D, creating an oversold condition.
3. Support & Reversal Zone
Point D is positioned at a confluence of prior lows and trendline support, increasing the probability of a bounce.
The recent candles show stabilization and early bullish pressure.
4. Projection & Target
The pattern projects a potential upward move toward 1.16952.
This aligns with previous swing highs and offers a realistic short-term bullish target.
5. Trade Implication
A break above minor consolidation near 1.1625 would add confirmation.
Risk management should place stops below 1.1600 in case of a false breakout.
SIMPLE MARKET STRUCTURENot taking too many data from the past.
Technical analysis using candlesticks
Daily timeframe = Last five (5) candles... Market is bullish
H4 = sub structure of D1 last Friday candle is bearish. Marked current LH and Last LL.
Market currently finding it hard to form a new LL
WILL THERE BE ACONTINUATION TO THE DOWNSIDE OR WILL MARKET START FORMING HL AND GET A NEW HH.
DeGRAM | EURUSD returned to the channel📊 Technical Analysis
● EURUSD broke above the descending channel resistance and reclaimed the 1.1567 level, signaling a potential reversal after defending 1.1446 support.
● The price is forming a bullish sequence of higher lows, and a breakout above 1.1592 could open the path toward the 1.1765 resistance zone.
💡 Fundamental Analysis
● A weaker-than-expected US ISM Services report triggered USD selling, while hawkish ECB remarks from Nagel supported euro recovery.
● Markets are pricing in fewer Fed hikes as job data cools, reducing dollar appeal and favoring EUR upside.
✨ Summary
Long bias above 1.1446. Breakout targets 1.1592 ➜ 1.1765. Setup valid while structure holds above prior resistance-turned-support.
-------------------
Share your opinion in the comments and support the idea with a like. Thanks for your support!

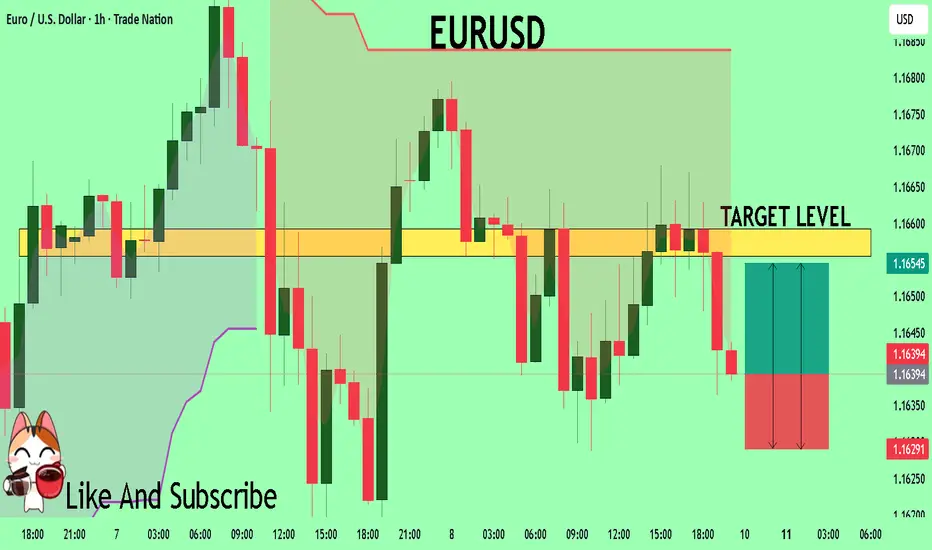
EURUSD Massive Long! BUY!
My dear followers,
This is my opinion on the EURUSD next move:
The asset is approaching an important pivot point 1.1639
Bias - Bullish
Safe Stop Loss - 1.1629
Technical Indicators: Supper Trend generates a clear long signal while Pivot Point HL is currently determining the overall Bullish trend of the market.
Goal - 1.1655
About Used Indicators:
For more efficient signals, super-trend is used in combination with other indicators like Pivot Points.
Disclosure: I am part of Trade Nation's Influencer program and receive a monthly fee for using their TradingView charts in my analysis.
———————————
WISH YOU ALL LUCK
EURUSD BreakthroughBuy Setup on FOREXCOM:EURUSD , EURUSD team bullish are so aggressive, so im expecting a very big gain on EURO against the weakens dollar.

EURUSD - Major resistance ahead with the fair value gaps!The EUR/USD pair remains firmly within a prevailing downtrend, characterized by a consistent pattern of lower highs and lower lows. This bearish momentum has resulted in the formation of several significant Fair Value Gaps (FVGs) on the 4-hour chart, which now act as potential resistance zones on any pullbacks. These FVGs not only coincide with important technical structures, but also align with key Fibonacci retracement levels, adding confluence to their strength. In the analysis below, we’ll walk through these zones and discuss the most probable scenarios based on the current price action.
First resistance zone
The first major resistance lies within the 4-hour FVG in the 1.1600 to 1.1650 region. This zone coincides with the golden pocket, which is formed between the 0.618 and 0.65 Fibonacci retracement levels. This overlap strengthens the likelihood of price reacting bearishly here, should the market manage to retrace upwards into this area. Given the strong downward momentum, this level may be enough to trigger a continuation to the downside, making it a critical area to monitor for rejection signals.
Second resistance zone
The second key resistance is found in the upper 4-hour FVG, ranging from 1.1690 to 1.1750. This zone aligns closely with the 0.786 Fibonacci retracement level and marks a former support zone that has now been broken, indicating a potential structure break. Price returning to this level would be retesting the underside of broken market structure, which often acts as a powerful resistance area. Given this, a deeper pullback into this region may serve as a trap for late buyers and potentially offer a high-probability short setup.
Bullish bounce area
On the bullish side, the most relevant support is currently found within the 1-hour FVG that was formed last Friday, during the release of the U.S. unemployment rate data. This zone is positioned below current price levels and is likely to act as a strong short-term demand area. It is reasonable to anticipate a bullish reaction from this zone if the market retraces downward, making it a favorable area to seek long opportunities for a potential move into the higher resistance levels described above.
Final thoughts
While the broader trend remains bearish, short-term bullish bounces are likely within defined fair value gaps. Traders should keep a close eye on the 1-hour FVG for possible long entries, while watching the 4-hour FVGs, particularly those aligning with key Fibonacci levels, for signs of bearish continuation. If resistance holds firm, the EUR/USD could resume its downtrend, but any structural breaks or sustained closes above these levels would challenge that view. As always, price action around these zones should guide the final decision-making.
-------------------------
Disclosure: I am part of Trade Nation's Influencer program and receive a monthly fee for using their TradingView charts in my analysis.
Thanks for your support. If you enjoyed this analysis, make sure to follow me so you don't miss the next one. And if you found it helpful, feel free to drop a like 👍 and leave a comment 💬, I’d love to hear your thoughts!

Sell eurusdStrong sell expected already daily support trend broken
We are expecting weakening of the euro among all cross pair
Bearish wave not completed yet
EURUSD: The Market Is Looking Down! Short!
My dear friends,
Today we will analyse EURUSD together☺️
The in-trend continuation seems likely as the current long-term trend appears to be strong, and price is holding below a key level of 1.16741 So a bearish continuation seems plausible, targeting the next low. We should enter on confirmation, and place a stop-loss beyond the recent swing level.
❤️Sending you lots of Love and Hugs❤️
13.08.25 Morning ForecastPairs on Watch -
FX:GBPAUD
FX:EURCAD
FX:EURUSD
A short overview of the instruments I am looking at for today, multi-timeframe analysis down to what I will be looking at for an entry. Enjoy!

EURUSD: Bullish Trend ContinuesThe EURUSD is gaining momentum following a test of a key demand zone,
The bullish breakout from a resistance line of a bullish flag pattern signals a strong trend-following signal.
The target is set at 1.1772.

It bstargey that's use fractals and rsiI want to use fractal that give me signal alwys whre is apreart of 15 minutes pluse rsi period 1 with 90 sell 50 take profit 10 buy plus moving average 5 inside rsi
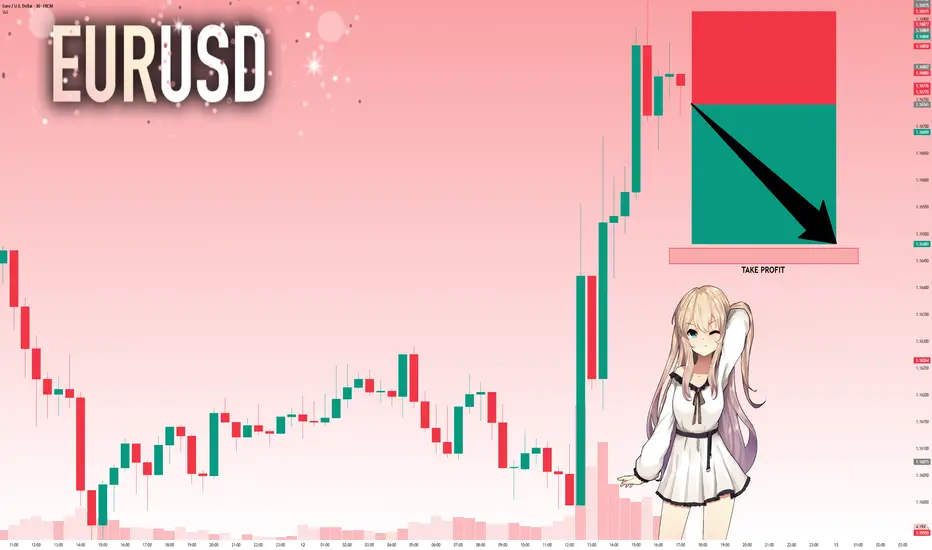
EURUSD: Time For PullbackThe 📉EURUSD pair reacted significantly to the highlighted intraday resistance zone following the market's opening on Monday.
After testing this blue structure, the market began to consolidate, creating a horizontal trading range on the hourly chart.
A bearish breakout below its support level signals a strong downward trend, suggesting a potential pullback from the resistance level, with a target of 1.1473.
