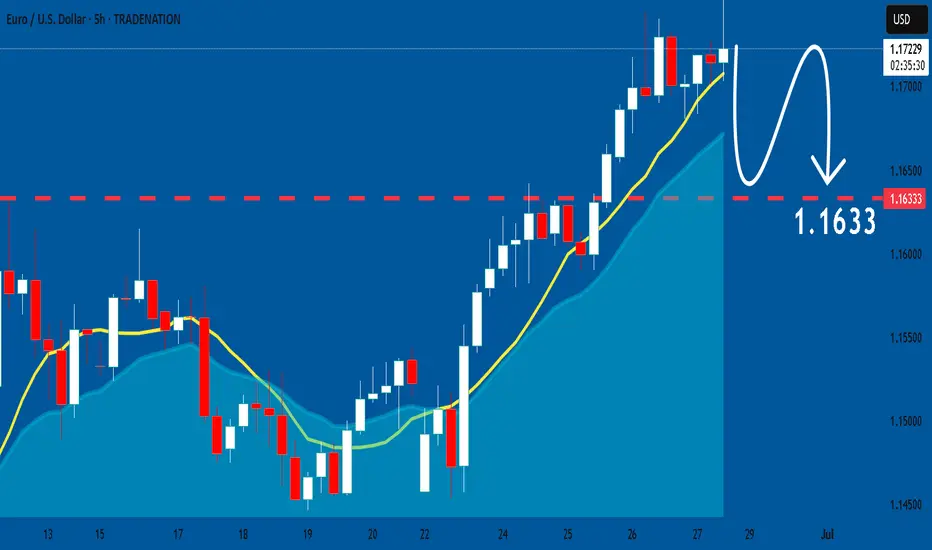
EURUSD: Will Keep Falling! Here is Why:
Balance of buyers and sellers on the EURUSD pair, that is best felt when all the timeframes are analyzed properly is shifting in favor of the sellers, therefore is it only natural that we go short on the pair.
Disclosure: I am part of Trade Nation's Influencer program and receive a monthly fee for using their TradingView charts in my analysis.
❤️ Please, support our work with like & comment! ❤️
EURUSD trade ideas
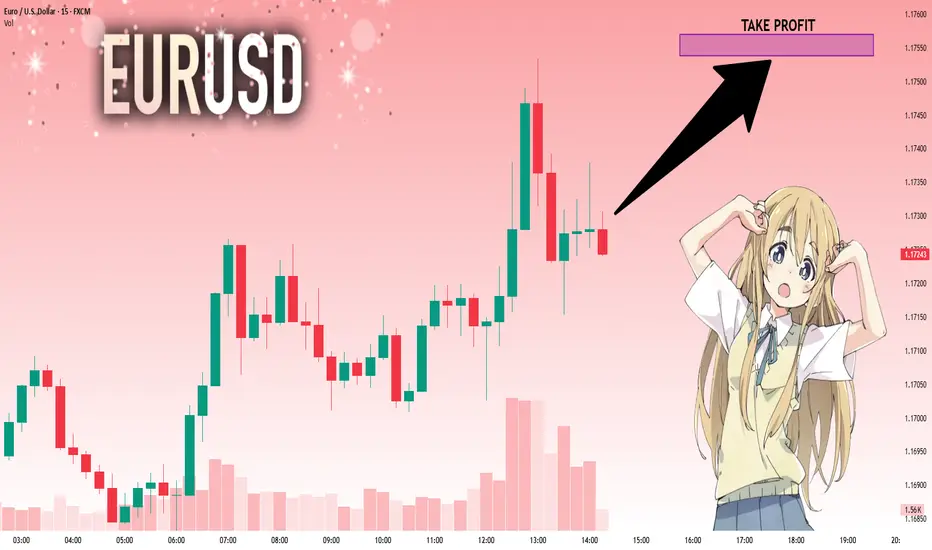
EURUSD: Strong Growth Ahead! Long!
My dear friends,
Today we will analyse EURUSD together☺️
The recent price action suggests a shift in mid-term momentum. A break above the current local range around 1.17284 will confirm the new direction upwards with the target being the next key level of 1.17538 and a reconvened placement of a stop-loss beyond the range.
❤️Sending you lots of Love and Hugs❤️
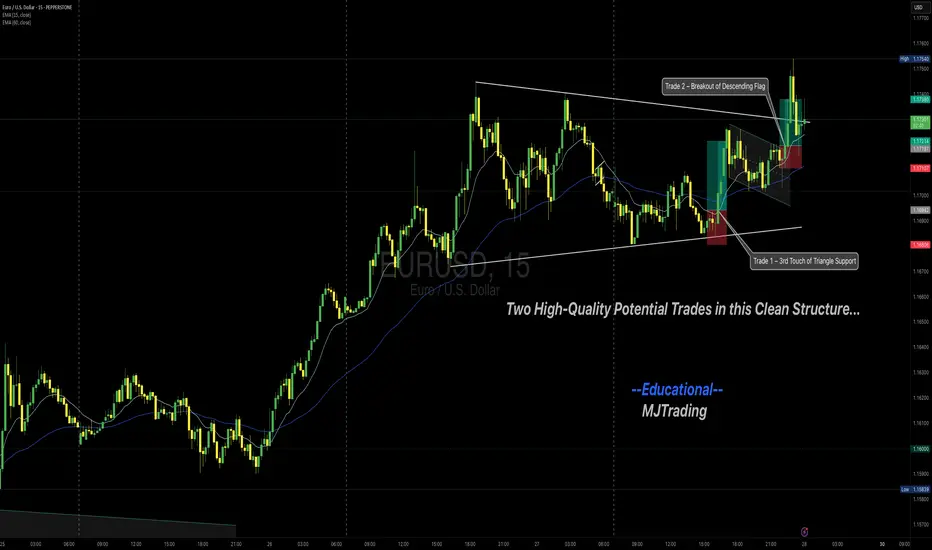
EURUSD – 2 Potential Intraday Setups (5-Min Chart)Chart Overview:
This 5-min EURUSD chart shows two example trade setups aligned with the main uptrend. These are shared purely for learning how to recognize and plan structured entries.
(Details are being shown in m5 chart- if this in not working for you please follow to be able to see it- as it is a private idea)
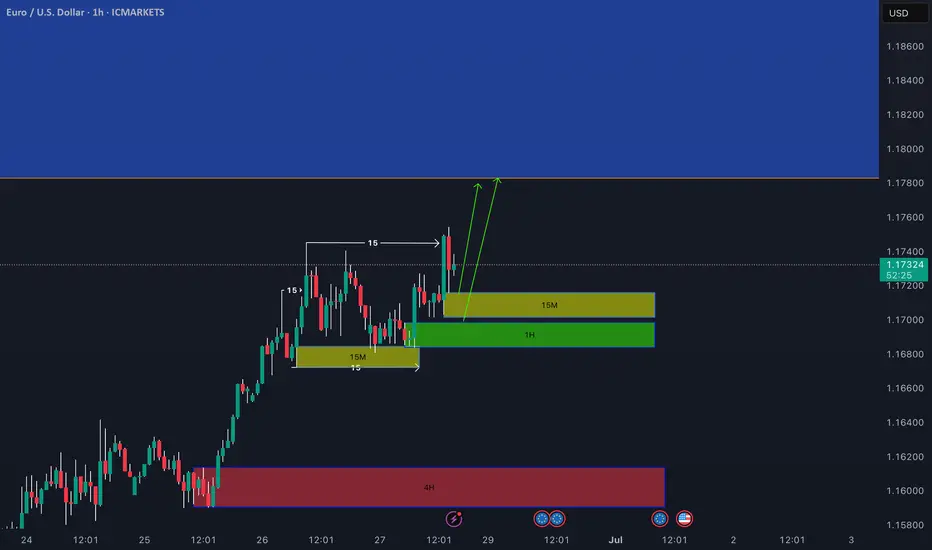
🔹 Example Trade 1 – 3rd Touch of Triangle Support
✅ Context:
Price retested the lower boundary of a broad triangle/wedge for the third time—often a strong area for reactive buys in an uptrend.
✅ Plan Concept:
Entry: Reversal signal on the 3rd touch.
Stop: Below the signal bar low.
Target: Mid to upper wedge area (or TP2).
🔹 Example Trade 2 – Breakout of Descending Flag
✅ Context:
After bouncing off trendline support, price formed a descending flag consolidation.
✅ Plan Concept:
Entry: Break and close above flag resistance.
Stop: Below the strong breakout candle.
Target: Extension toward recent highs (or TP2).
💡 Important:
These examples are not signals and not executed trades—they illustrate a possible planning process for traders studying price action strategies.
💡 Why These Matter:
Both setups align with the primary uptrend, use clear structure for risk placement, and rely on confirmation before entry.
🔹 Note:
These are educational examples only, not trade signals.
💬 Do you study similar setups? Share your charts and thoughts!
Thanks for your attention and your time...
Follow for more setups
#EURUSD #Forex #TradingEducation #PriceAction #IntradayTrading #BreakoutTrading #TechnicalAnalysis #LearnTrading #TradingView
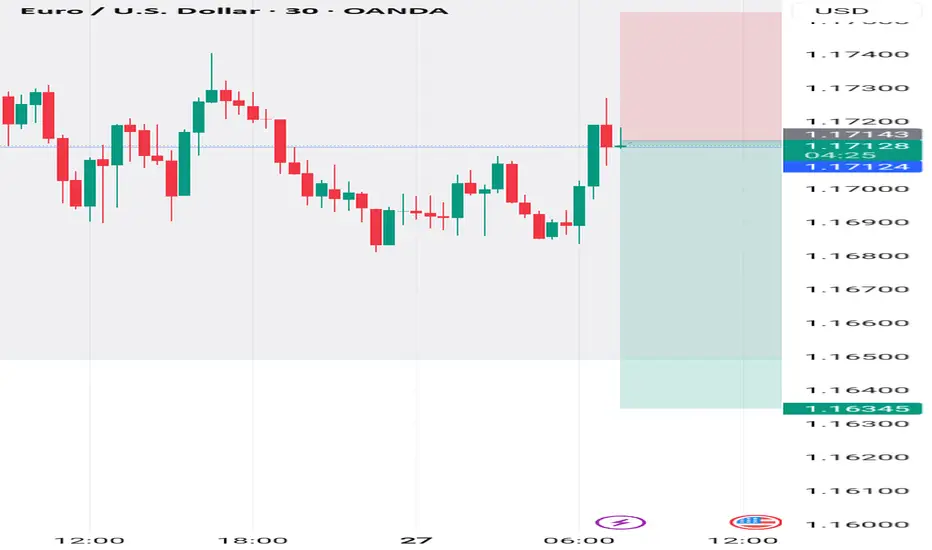
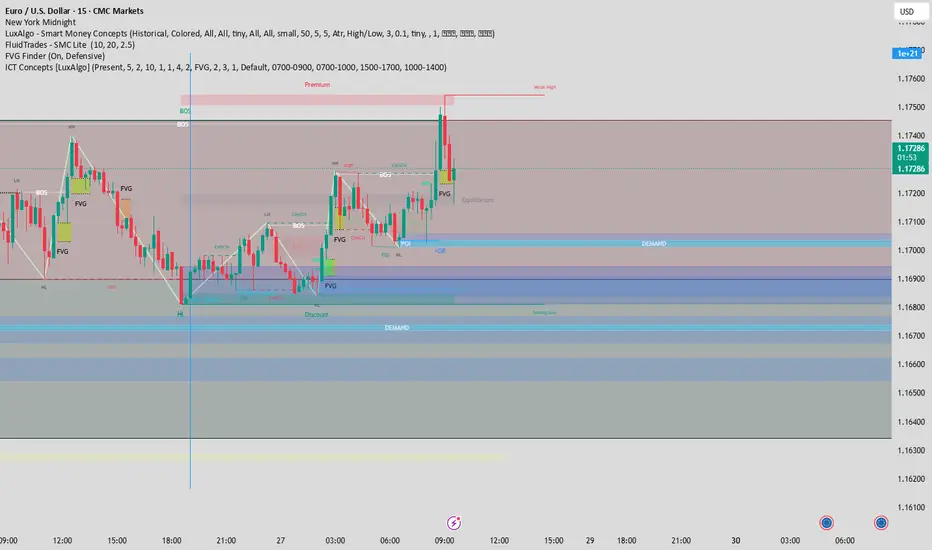
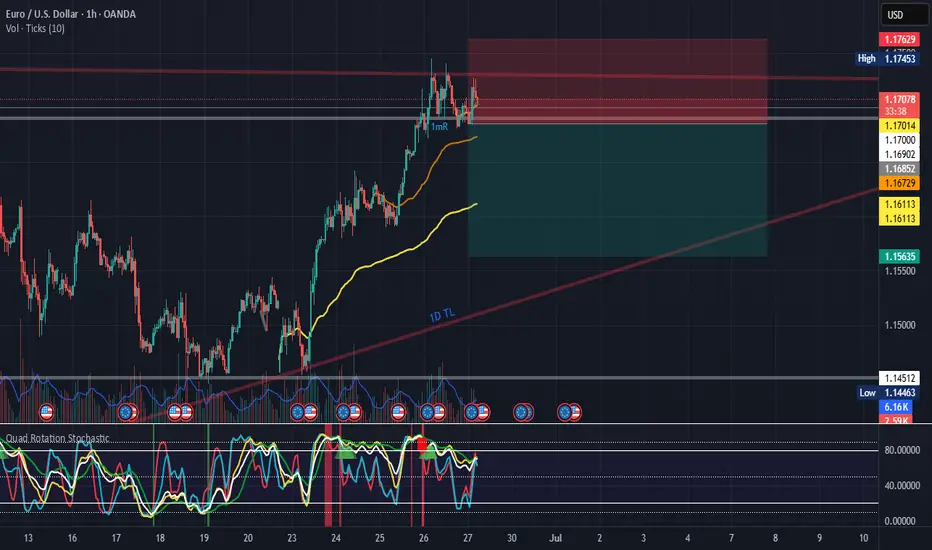
PO3 (Manipulation spike into Premium → Distribution)Price swept liquidity above the recent high → tapped into FVG at a premium
BOS and CHOCH are already present earlier → confirming the reversal structure
Expecting a bearish reaction from this imbalance zone
📉 EUR/USD Short Setup – June 27
🔹 Entry: 1.17380
🔹 SL: 1.17510
🔹 TP1: 1.17080 | TP2: 1.16800
🔻 PO3 bearish reaction from FVG at Premium zone + prior liquidity sweep
pls let me know your opinion am open to let from anyone and everyone, pls
#AN011: NATO Summit, 5% for Defense
Hello, I am Forex Trader Andrea Russo and after the NATO Summit meeting, I want to analyze the situation a bit. Remember that my opinions are strictly personal and what I say may not reflect your thoughts. I do not write with a political or personal ideology. I analyze the situation objectively.
I thank in advance our Official Partner Broker PEPPERSTONE for the support in creating this article.
🔍 Key points of the NATO Summit
Yesterday's NATO Summit in The Hague attracted global attention, with the 32 member countries committing to a strong increase in defense spending, with the goal of 5% of GDP by 2035, of which 3.5% for basic military spending and 1.5% for broader security measures, such as strengthening cybersecurity and infrastructure.
US President Trump praised the outcome as a "major victory" and stressed that increased spending would likely benefit US defense contractors, while reaffirming NATO's commitment to Article 5.
However, countries such as Spain have expressed concern, indicating that it could include military aid rather than pure budget increases.
📈 Financial Market Reaction
🔹 Defense & Aerospace Stocks
Major defense companies across Europe posted immediate gains:
Babcock (UK) +10.7%,
Rheinmetall (Germany) +3.1%,
Thales (France) +2%+,
Leonardo (Italy) +2.6%
🔹 Bond & Currency Action
According to KBC Bank market commentary:
The bond market steepened bearishly, particularly in Europe, as governments are reassessing their fiscal balances to accommodate defense budgets.
The US dollar remained strong, supported by dovish Fed expectations, countering the spike in bond yields.
🌍 Currency Market Implications
EUR/USD:
The momentum of a dovish Fed and US fiscal pressure could support the dollar. However, divergence in bond yields could support moderate euro strength if the ECB remains cautious.
EUR-linked currencies (e.g. SEK, NOK):
These could come under pressure from rising risk premia and possible increase in government bond issuance.
JPY and CHF:
Likely to benefit from high volatility and safe-haven flows amid geopolitical tensions.
🧭 Strategic Outlook
Theme Market Impact
Increased defense spending Supports government bonds, increases government bond yields.
Fiscal tightening Increases credit risk premia.
US defense dominance Strengthens the USD in the short to medium term.
Geopolitical unity Strengthens investor confidence, mitigates risk-off tendencies.
📝 Conclusion
NATO summit signals a geopolitical shift that extends to currency and credit markets. Forex traders should pay attention to:
Yield changes in the US versus Europe due to increased deficit financing.
Currency inflows into the US dollar on defense and risk themes.
Safe-haven demand if tensions in Russia-Ukraine or the Middle East flare up again.
Thanks a lot for making it this far. Stay tuned for more analysis.
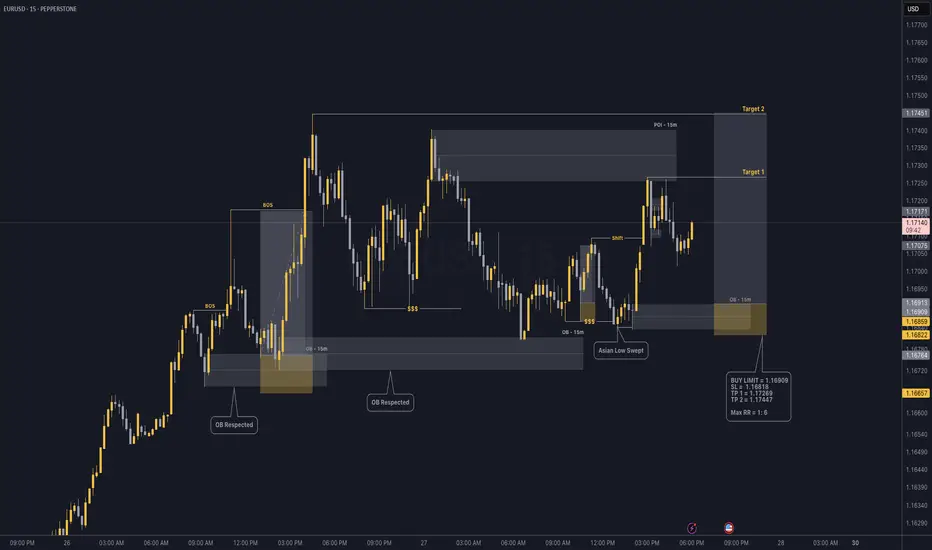
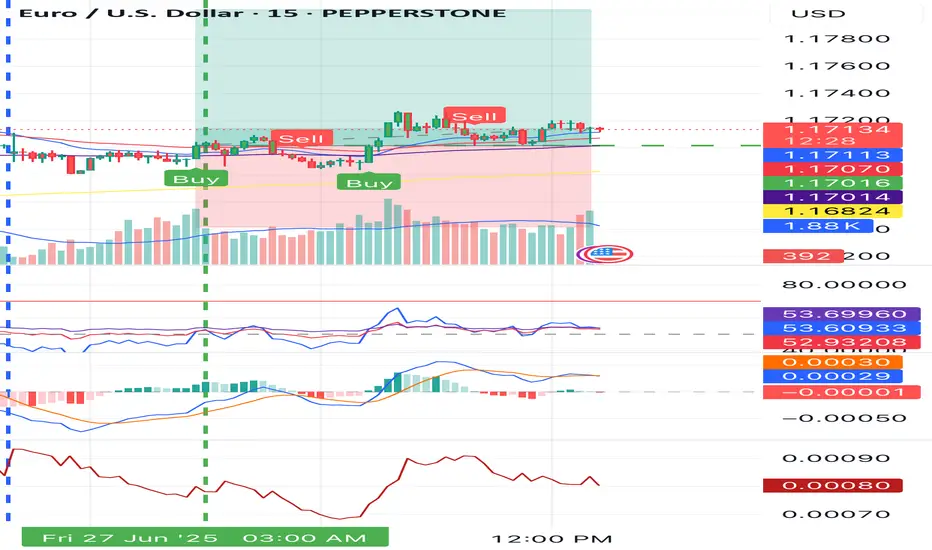
EUR/USD - Potential Long Continuation.Most of the OB are being respected in the 15 minute time frame.
Now price is retracing to the downside after touching the bearish POI (15m) and I am anticipationg that price will retrace back to the bullish OB (15m) and start pushing higher during NY Session.
I believe the latest OB created should be a high probability OB as it has swept Asian Low and start displacing further , showing sign of bullish momentum.
#EURUSD Buy 1.17016#EURUSD Buy 1.17016
SL 1.16416
TP 1.17216
TP 1.18016
TP 1.19416
Trade at your own risk
Protect your capital
The Wizard 🧙♂️ SWFX
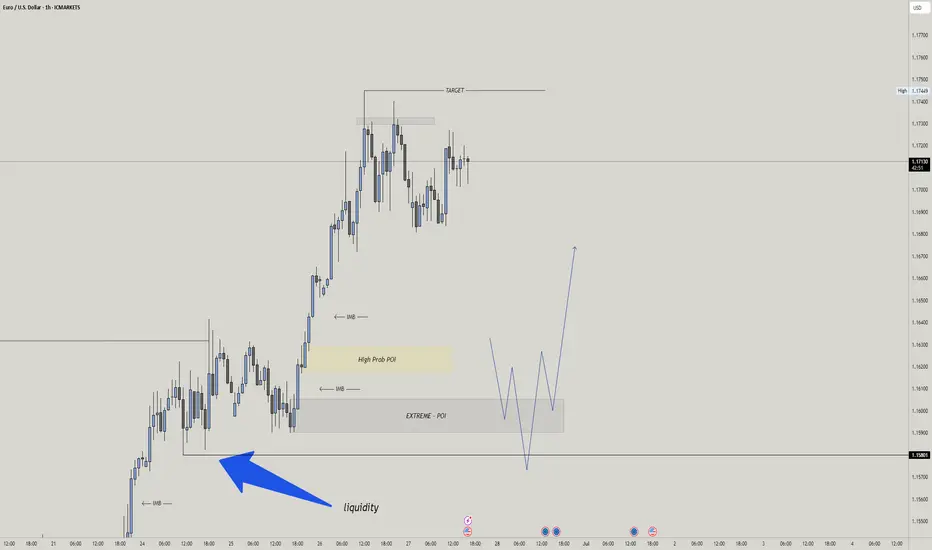
EURUSD – Waiting for Deeper Liquidity Sweep into Extreme POIExpecting EURUSD to sweep liquidity below 1.1660 and drop into the Extreme POI (~1.1600–1.1640). Watching for lower timeframe reversal signals to go long. Targeting 1.1732 initially, extended target near 1.1790. Invalidation below 1.1580.
EURUSD : Not yetSeems like it is very tempted to SELL now.
I do not think today is the day.
Maybe next Monday.
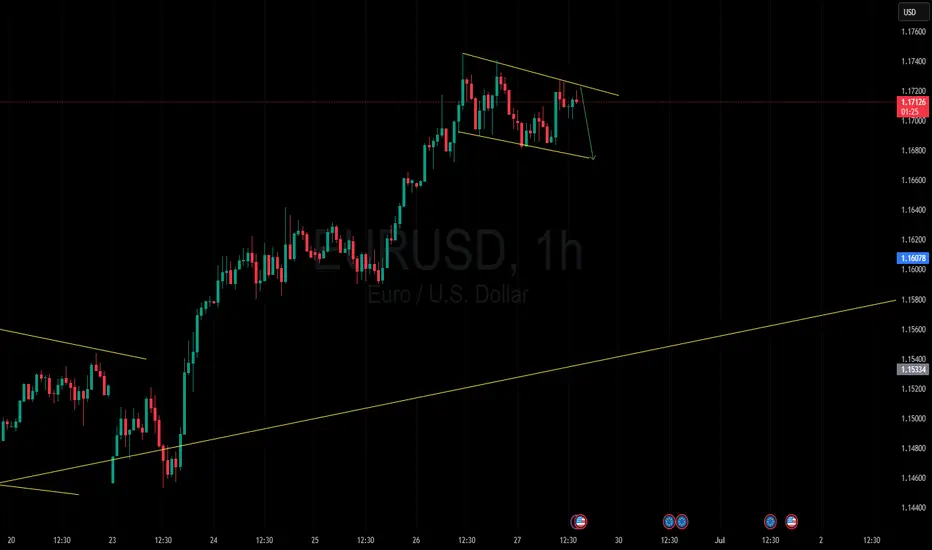
Expecting a pullback to test the channel’s floorA strong candle without follow-through is a sign of trend weakness, and from where the channel has formed, a pullback to the channel’s floor is logical
OANDA:EURUSD
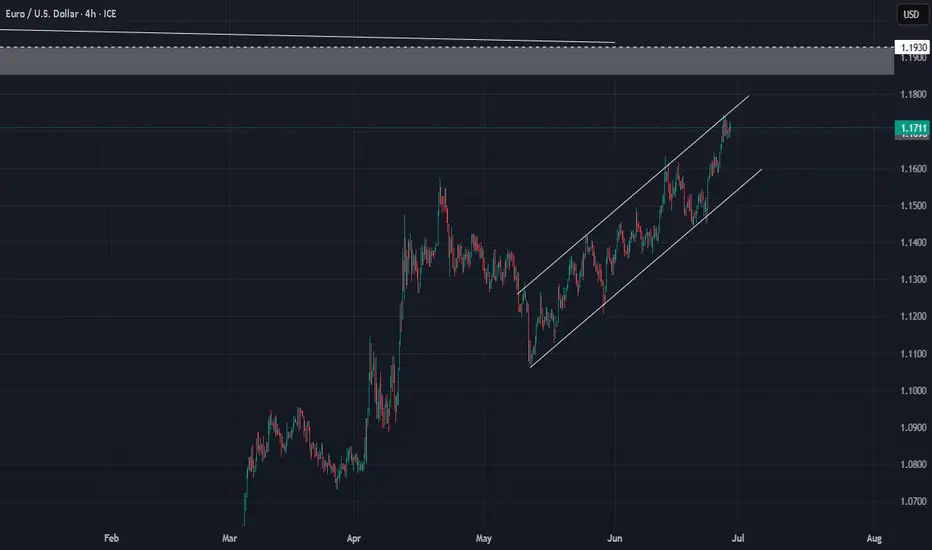
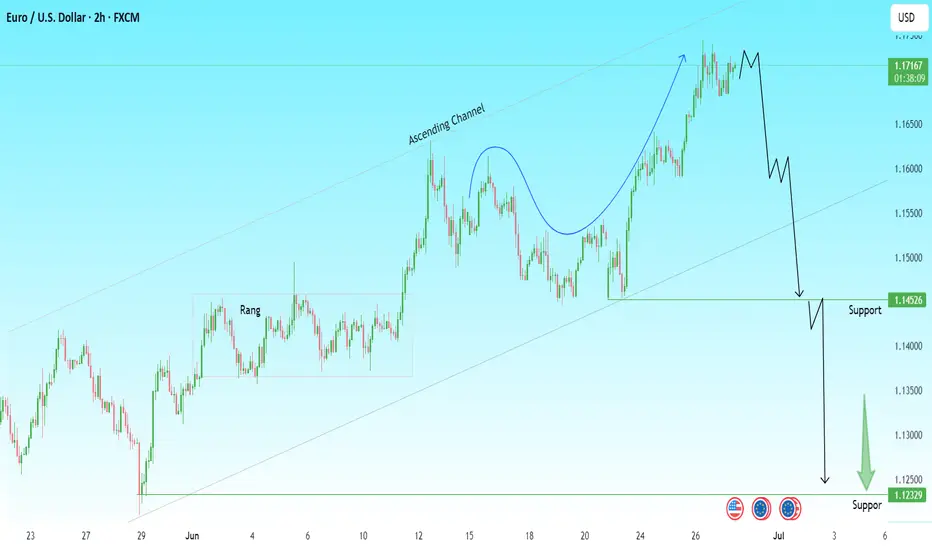
EURUSD Technical Breakdown | Bearish Reversal Ahead?The Euro is showing signs of a potential major trend reversal after completing a strong rally within an ascending channel.
🔎 Chart Analysis:
Price surged out of a long consolidation range and followed a parabolic curve.
The pair reached the upper boundary of the ascending channel and started stalling.
Early signs of a distribution phase are visible, hinting at possible downside momentum.
📉 Bearish Scenario In Play:
A break below 1.1600 could accelerate the sell-off.
Key support zone at 1.14526 — potential first reaction level.
If momentum continues, next major support rests at 1.12329.
Short-Term Outlook:
Watch for breakdown confirmation below the channel.
Risk management is key; consider short entries on bearish candle confirmation.
💬 What’s your view? Are the bears finally taking over EUR/USD? Drop your thoughts below! 👇
#EURUSD #Forex #TechnicalAnalysis #PriceAction
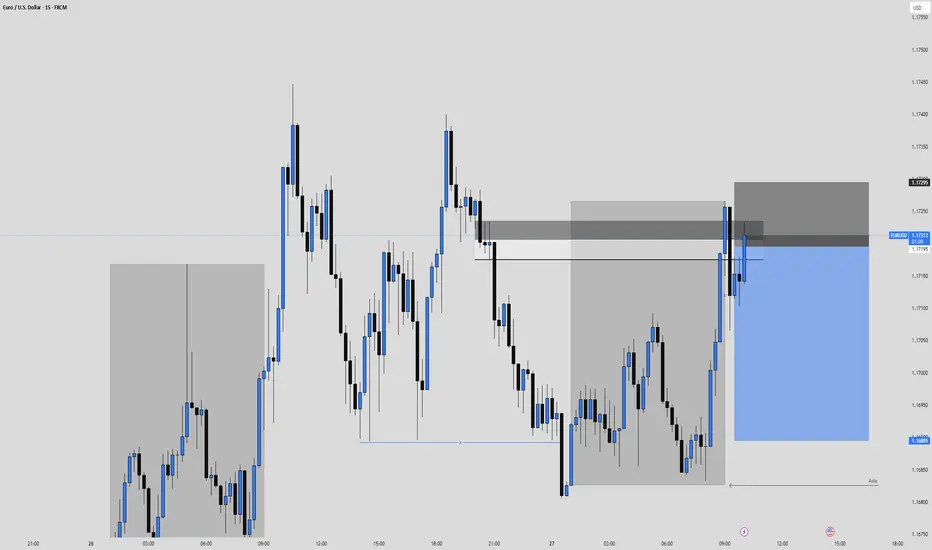
EURUSD Sell, June 27HTF shows reaction from W/D Orderblocks with multiple Daily imbalances below as downside targets. While GBPUSD is also at a valid D OB, EU gives clearer confirmation on LTF.
On LTF, price opened London above Asia highs (ideal for short setups) and showed 15m BOS into a 15m POI.
We've tapped into a 5m Orderblock inside the 15m zone, followed by a clean 1m BOS.
📍Entry: 5m OB with SL above highs (tight 10 pip risk)
🎯 TP1: 1:3 (75% off)
🎯 Final TP: Below Asia low & Daily imbalance
📉 Risk: 0.25% (reduced it for more consistency)
Confident setup — but if price rallies to the upper 5m OB and leaves without us, that’s part of the plan. No chasing.
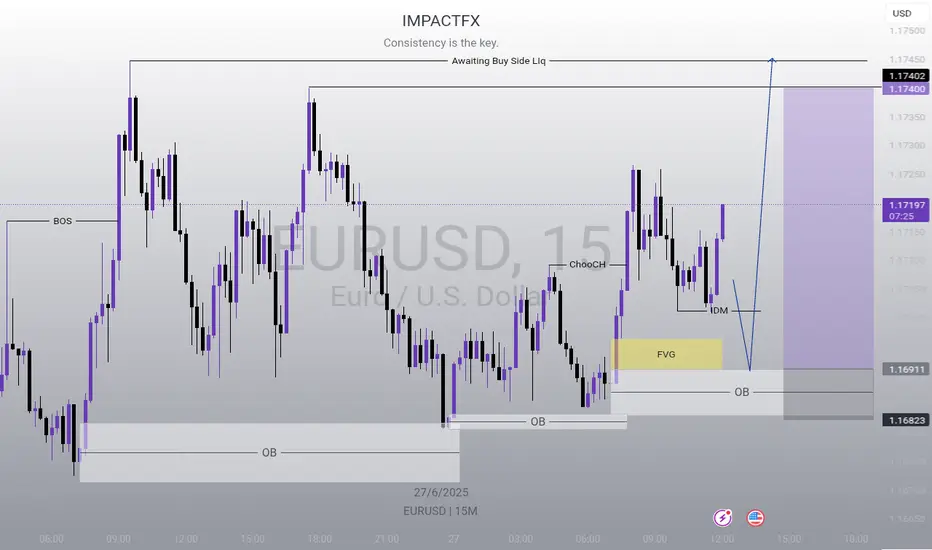
EURUSD Buy SetupI'm expecting a buy from that zone, all other zones are mitigated except from that zone marked on my chart to move price to the buy side LIq.
EURUSD Upbrake of the trend will confirm buy target.i have made several analysis of this in recent weeks and it moves excatly i predicted so far. soon with the upbrake of the trend will confirm our 1.1890 target
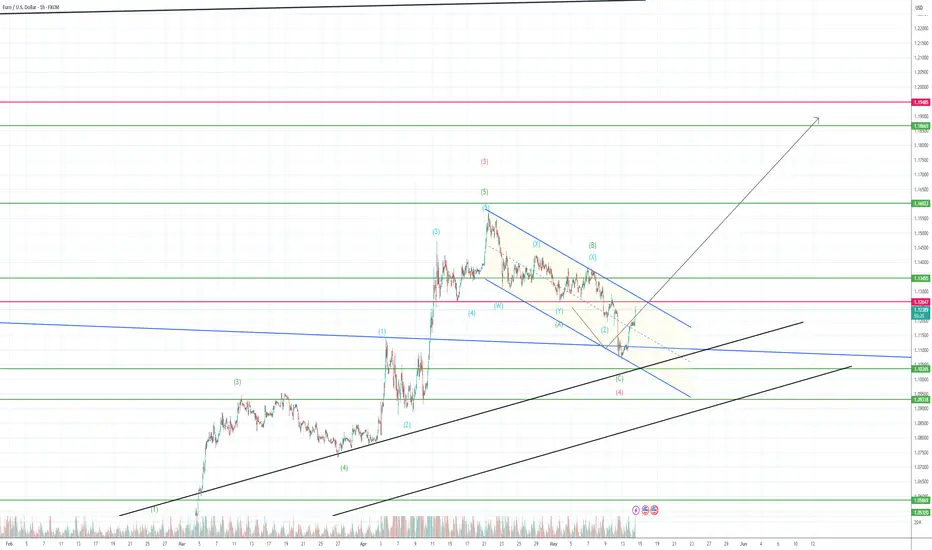
should be going up after correction ends.cant be certain when it comes down to correction waves, it might be here 1.1211 it might go little bit more down around 1.1152 or 1.10 but when it ends it will go for higher than 1.17 also correction wave lenght will give us a better idea where the tp should be so i will keep my first buy position and will add when i am certain when next impulse wave started.

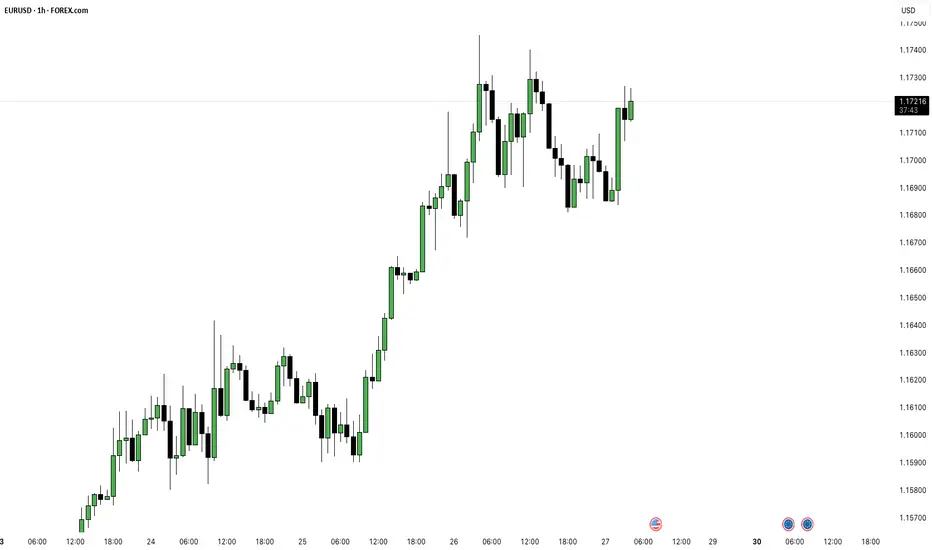
EUR/USD Pair Hits Yearly HighEUR/USD Pair Hits Yearly High
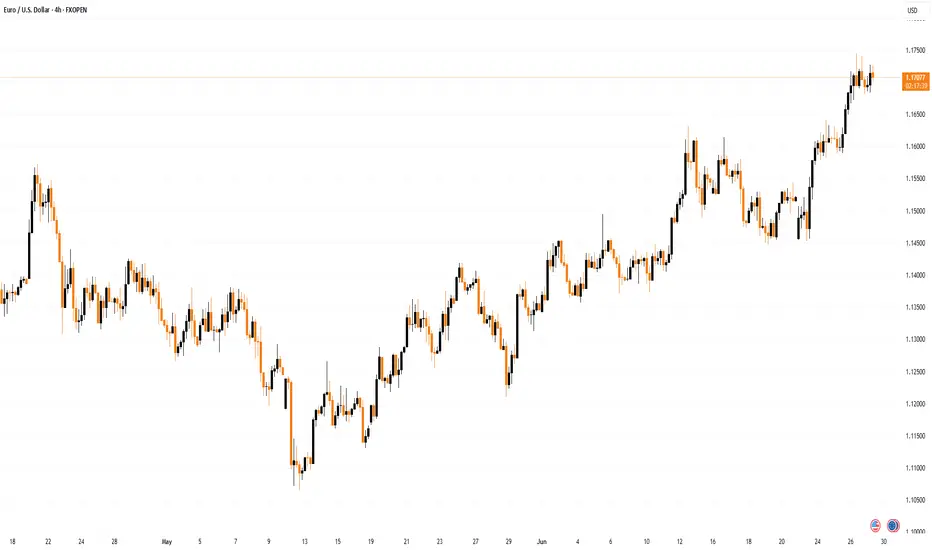
Yesterday, the EUR/USD exchange rate rose above the 1.1700 level for the first time this year. The last time one euro was worth more than 1.70 US dollars was in autumn 2019.
The main driver behind the euro’s rise is the weakening dollar, largely due to decisions made by the Trump administration. This week alone, the EUR/USD pair has gained more than 2%, partly as a result of escalating tensions between the US President and the Chair of the Federal Reserve.
According to Reuters, Trump called Powell “terrible” and said he had three or four candidates in mind for the top job at the Fed. It was also reported that Trump had considered selecting and announcing a replacement for Powell by September or October (his current term officially runs until May 2026).
Technical Analysis of the EUR/USD Chart
Price movements are forming an upward channel (highlighted in blue), with the following observations:
→ Midweek, the price consolidated around the channel’s median line (as indicated by arrow 1);
→ It then broke through the 1.6300 level with strong bullish momentum (shown by arrow 2), a level that had acted as resistance earlier in the month;
→ The long upper wicks on the candles forming yesterday’s highs (circled) suggest increased selling pressure near the upper boundary of the channel.
Given this, we could assume that in the short term, the price might form a new consolidation zone around the median line above the 1.6300 level. Significant fundamental catalysts would be required to break the developing upward trend.
This article represents the opinion of the Companies operating under the FXOpen brand only. It is not to be construed as an offer, solicitation, or recommendation with respect to products and services provided by the Companies operating under the FXOpen brand, nor is it to be considered financial advice.
EURUSD short to 1.56Currently testing 1M resistance area and 1D downtrend line.
Expecting retracement to 1D up trendline.
DXY is also testing 1W uptrend line
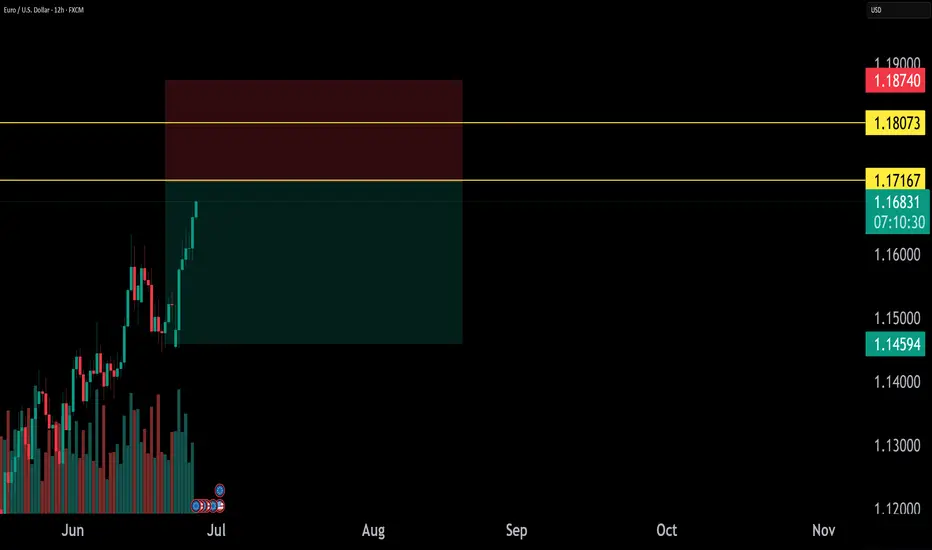
EUR/USD Short Idea Analysis EUR/USD exhibits bearish potential on the daily timeframe, with the 1.17160–1.18070 zone acting as a key resistance area for a short setup.
Technical Analysis:
Price Action: Price is testing the 1.17160–1.18070 resistance zone, which aligns with prior highs and a rejection area. A bearish reversal pattern (e.g., shooting star or engulfing) could confirm the short.
Support/Target: Initial support at 1.1600, with a deeper target at 1.1500 if selling pressure accelerates.
Indicators: RSI is nearing overbought levels (above 65), suggesting a potential reversal. MACD shows weakening bullish momentum, supporting a bearish bias.
Fibonacci: The 1.17160–1.18070 zone aligns with the 78.6% Fibonacci retracement of the prior downmove, reinforcing resistance.
Risks: A break above 1.1820 could invalidate the setup. Watch for ECB policy updates or unexpected US data shifts.
Conclusion: The 1.17160–1.18070 resistance zone offers a compelling short opportunity for EUR/USD, backed by technical and fundamental factors. Use tight risk management due to potential volatility.
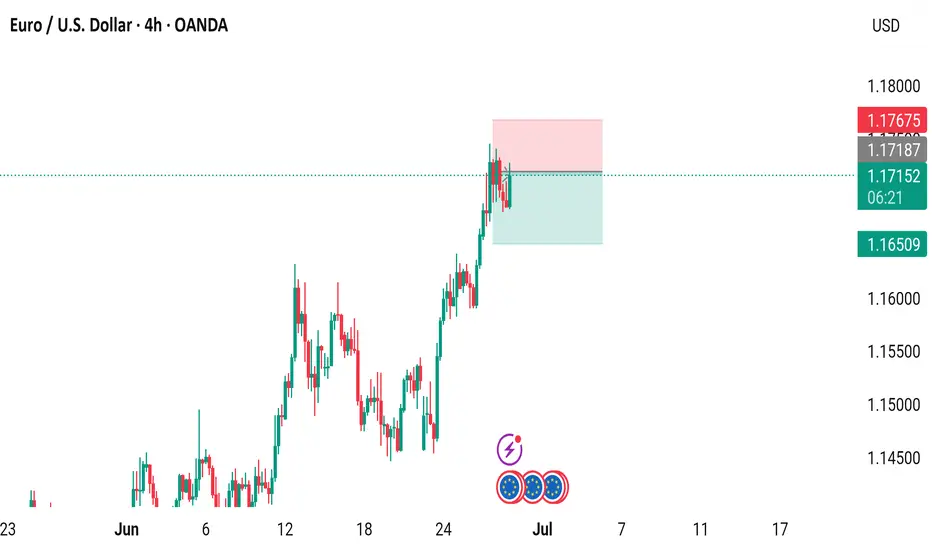
EUR/USD 4-Hour Chart (OANDA)4-hour performance of the Euro/US Dollar (EUR/USD) currency pair, sourced from OANDA. The current exchange rate is 1.17152, reflecting a 0.12% increase (+0.00136). The graph shows a recent upward trend, with a highlighted resistance zone around 1.17187, where the price has approached but not consistently broken through. The timeframe spans from late June to early July 2025, with key price levels marked on the right side ranging from 1.14500 to 1.18000 USD.
CHECK EURUSD SIGNAL READ CAPTAINsell Setup)
Entry Zone: Around 1.17200 \1.17150
Stop Loss: 1.17400
Take Profits:
TP1: ~1.17000
TP2: ~1.16750
Final Target: 1.16550
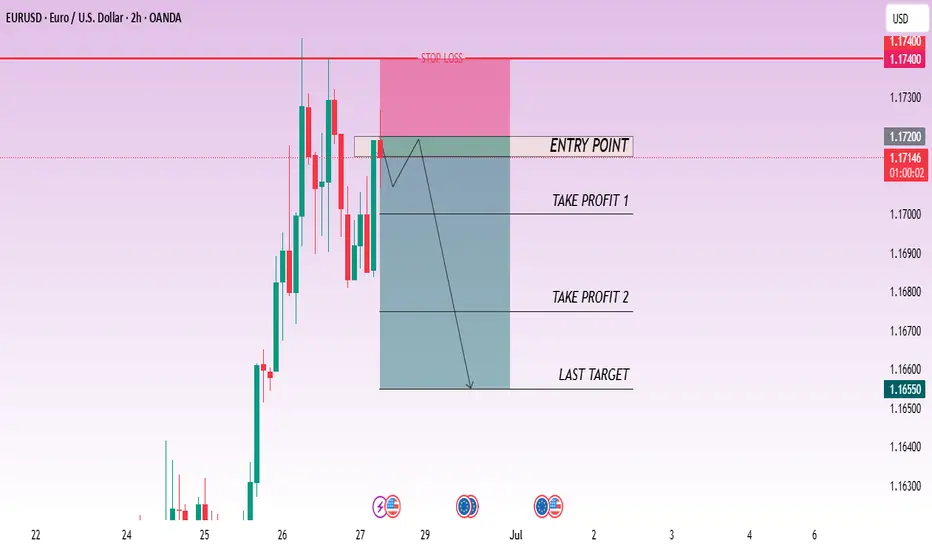
Eurusd Reaching physiological level of 1.17200 clear break and retest on the 2hr and 1hr , entering a counter trade to 1.16190